> ## Documentation Index
> Fetch the complete documentation index at: https://launchdarkly.com/docs/llms.txt
> Use this file to discover all available pages before exploring further.
# Experiment results data
This topic explains how to interpret an experiment's results and apply its findings to your product.
The data an experiment has collected is represented in its **Results** tab. The **Results** tab provides information about each variation's performance in the experiment, how it compares to the other variations, and which variations are likely to be best or beat the control out of all the tested options. Understanding how to read this tab can help you make informed decisions about when to edit, stop, or choose a winning variation for your experiments.
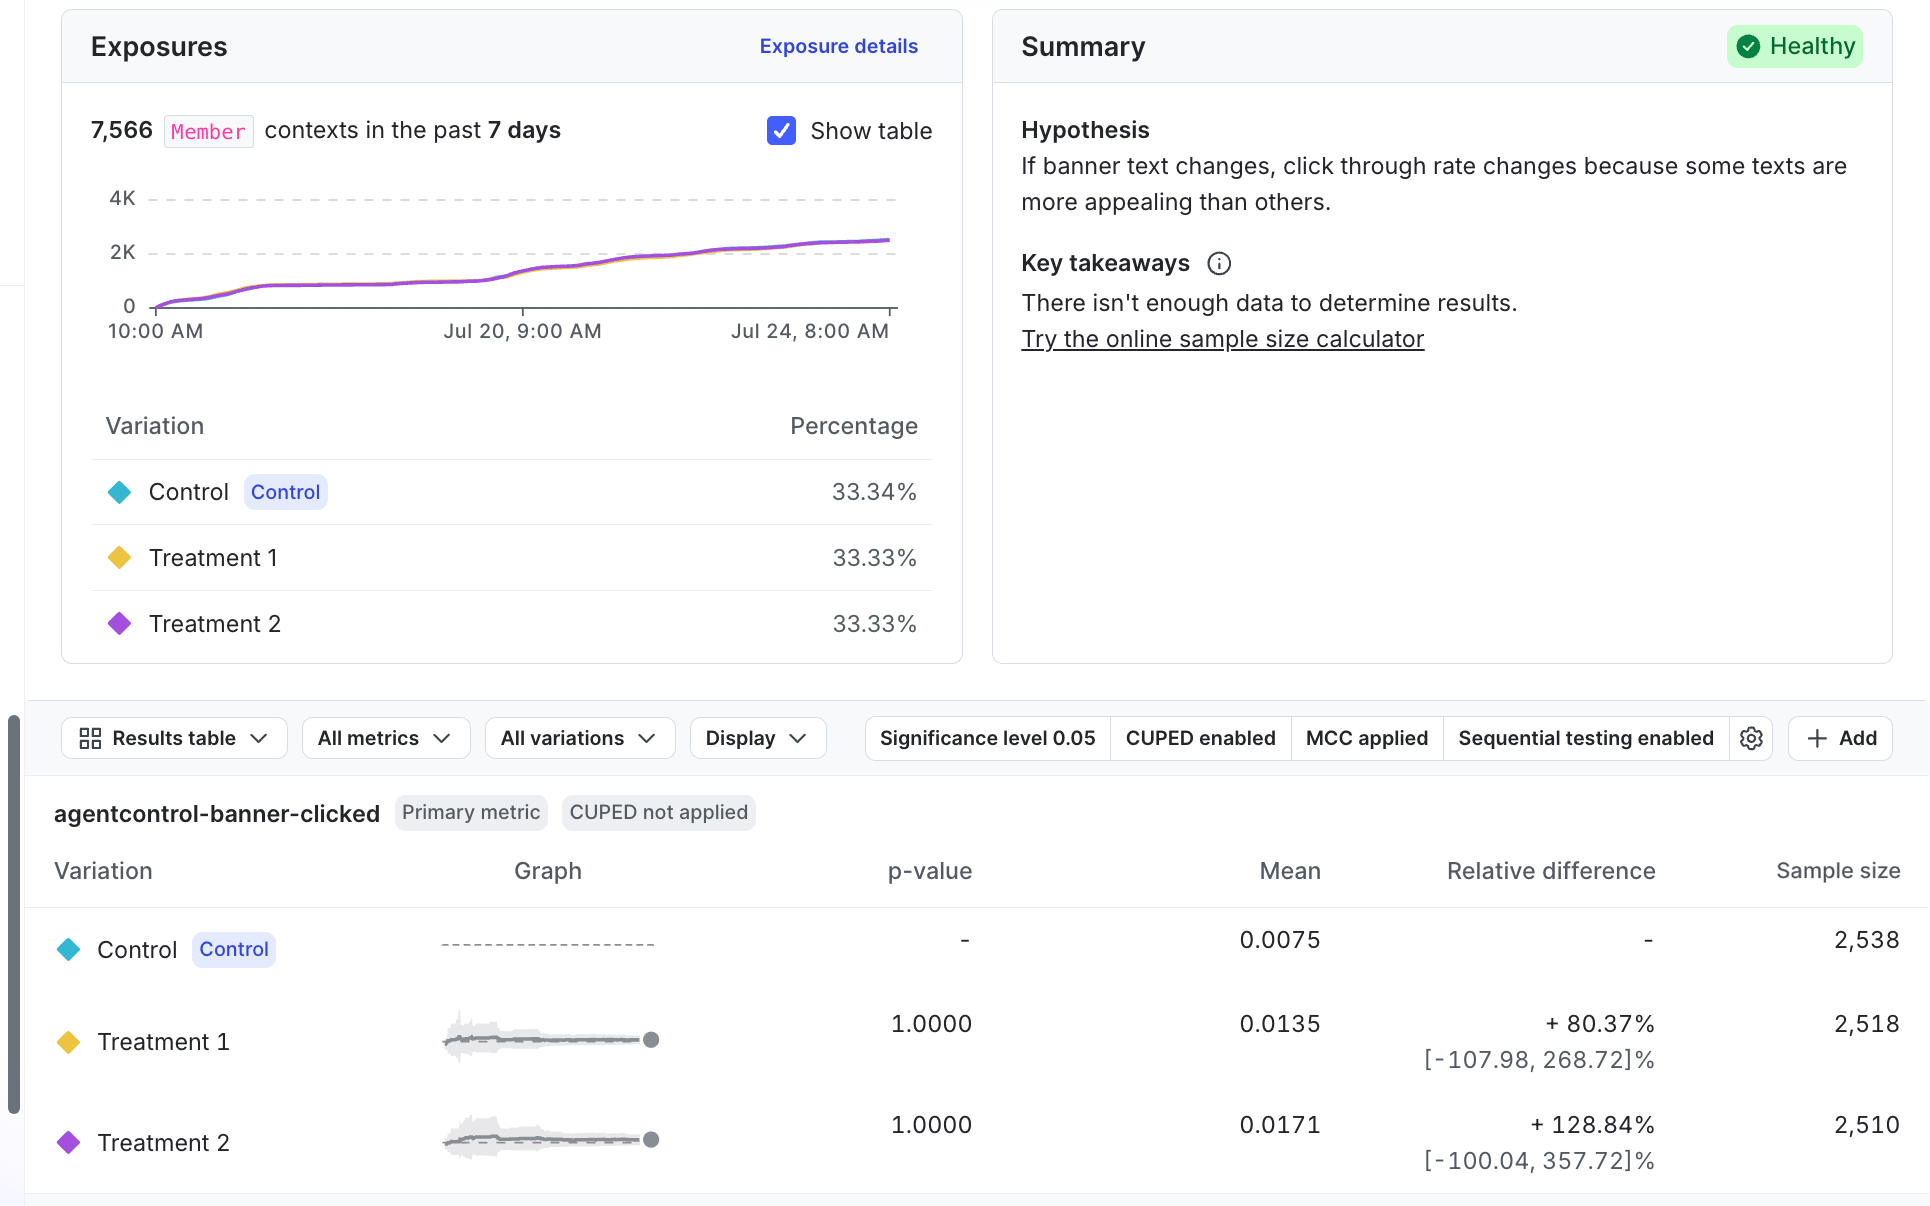
Here is an example **Results** tab for an experiment:
 ### Results update frequency
How often LaunchDarkly updates experiment results depends on the age of the experiment:
* In the first 24 hours of an experiment, LaunchDarkly updates the results at least every ten minutes.
* For experiments that are between 1-60 days old, LaunchDarkly updates the results every hour.
* For experiments more than 60 days old, LaunchDarkly updates the results once per day.
## Summary
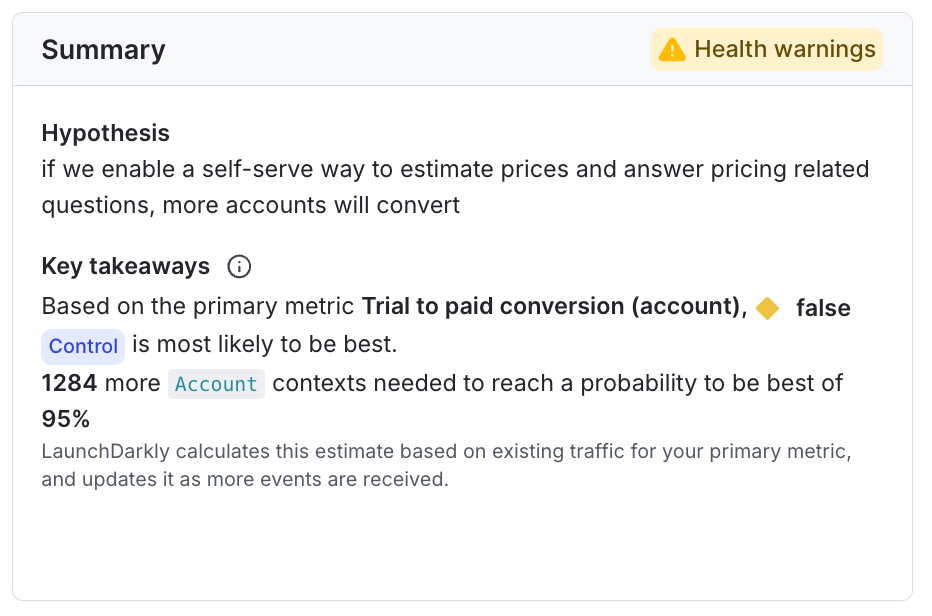
The "Summary" section displays the experiment's hypothesis and key takeaways, including whether or not you have enough data to determine a winning variation for the experiment. A health status badge in the section header indicates whether LaunchDarkly has detected any problems with your experiment's configuration. To learn more, read [Experiment health checks](/docs/home/experimentation/health-checks).
After you stop an experiment, the "Summary" section also displays the following information:
* Duration: The dates the experiment iteration ran and its total run time.
* Shipped variation: The variation you shipped when you stopped the experiment.
* Primary metric result: The relative difference and probability to beat control for the primary metric.
* Reason for stopping: The reason you entered when you stopped the experiment.
### Bayesian experiments
For Bayesian experiments, the summary includes a sample size estimator that gives an estimate of how much more traffic needs to encounter your experiment before reaching your chosen probability to be best. To learn more, read [Sample sizes for Bayesian experiments](/docs/guides/experimentation/designing-experiments#sample-sizes-for-bayesian-experiments).
### Results update frequency
How often LaunchDarkly updates experiment results depends on the age of the experiment:
* In the first 24 hours of an experiment, LaunchDarkly updates the results at least every ten minutes.
* For experiments that are between 1-60 days old, LaunchDarkly updates the results every hour.
* For experiments more than 60 days old, LaunchDarkly updates the results once per day.
## Summary
The "Summary" section displays the experiment's hypothesis and key takeaways, including whether or not you have enough data to determine a winning variation for the experiment. A health status badge in the section header indicates whether LaunchDarkly has detected any problems with your experiment's configuration. To learn more, read [Experiment health checks](/docs/home/experimentation/health-checks).
After you stop an experiment, the "Summary" section also displays the following information:
* Duration: The dates the experiment iteration ran and its total run time.
* Shipped variation: The variation you shipped when you stopped the experiment.
* Primary metric result: The relative difference and probability to beat control for the primary metric.
* Reason for stopping: The reason you entered when you stopped the experiment.
### Bayesian experiments
For Bayesian experiments, the summary includes a sample size estimator that gives an estimate of how much more traffic needs to encounter your experiment before reaching your chosen probability to be best. To learn more, read [Sample sizes for Bayesian experiments](/docs/guides/experimentation/designing-experiments#sample-sizes-for-bayesian-experiments).
 ## Exposures
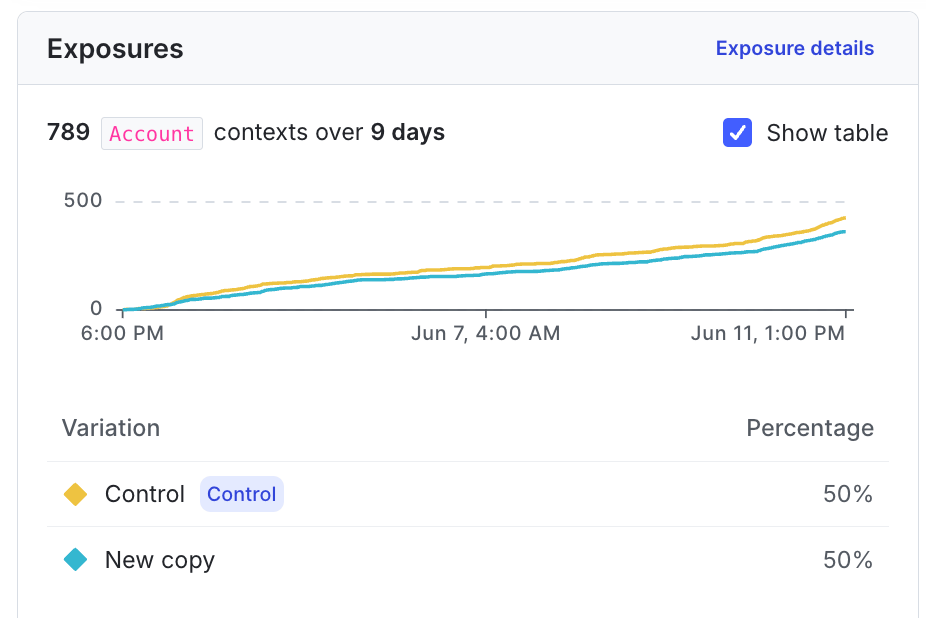
The "Exposures" section displays the total number of contexts exposed to the experiment, the percentage of contexts exposed to each variation, and a chart of exposures over time. To learn more, read [Experiment sample size and run time](/docs/home/experimentation/size).
To show or hide the table of variations and percentages below the chart, check or uncheck the **Show table** box. To view raw exposure events for the experiment, click **Exposure details** to open the **Exposures** tab. To learn more, read [Validate experiment exposures](/docs/home/experimentation/exposure-validation).
## Exposures
The "Exposures" section displays the total number of contexts exposed to the experiment, the percentage of contexts exposed to each variation, and a chart of exposures over time. To learn more, read [Experiment sample size and run time](/docs/home/experimentation/size).
To show or hide the table of variations and percentages below the chart, check or uncheck the **Show table** box. To view raw exposure events for the experiment, click **Exposure details** to open the **Exposures** tab. To learn more, read [Validate experiment exposures](/docs/home/experimentation/exposure-validation).
 ## Statistics information
The following statistics information displays above the results tables:
* **Significance level** (frequentist experiments only): The configured allowable rate of false positives for an experiment. To learn more, read [Frequentist experiment results](/docs/home/experimentation/frequentist-results).
* **Threshold** (Bayesian experiments only): The threshold represents how confident you want to be in an experiment's results before making a decision. The threshold determines the width of your [credible intervals](/docs/home/experimentation/bayesian-results#probability-density), and when LaunchDarkly declares a variation the winning variation. You select your desired threshold when you create an experiment. To learn more, read [Bayesian experiment results](/docs/home/experimentation/bayesian-results).
* **CUPED**: Specifies if LaunchDarkly has enabled [covariate adjustment (CUPED)](/docs/home/getting-started/vocabulary#cuped) for this experiment. CUPED uses data collected before contexts encounter an experiment to reduce variance in experiment results.
* **MCC** (frequentist experiments only): Specifies if you have [multiple comparisons correction (MCC)](/docs/guides/statistical-methodology/mcc) enabled to help reduce false positives in your experiment.
* To toggle off MCC on a running or completed experiment, click the **gear** icon in the results toolbar and uncheck the **Multiple comparisons correction** checkbox.
* **Sequential testing**: (Frequentist experiments only) Whether or not you have enabled [sequential testing to allow you to act on the results at any time](/docs/guides/statistical-methodology/choosing#fixed-horizon-versus-sequential).
LaunchDarkly reports sample ratio mismatch (SRM) detection as part of an experiment's health checks. To learn more, read [Experiment health checks](/docs/home/experimentation/health-checks).
## Statistics information
The following statistics information displays above the results tables:
* **Significance level** (frequentist experiments only): The configured allowable rate of false positives for an experiment. To learn more, read [Frequentist experiment results](/docs/home/experimentation/frequentist-results).
* **Threshold** (Bayesian experiments only): The threshold represents how confident you want to be in an experiment's results before making a decision. The threshold determines the width of your [credible intervals](/docs/home/experimentation/bayesian-results#probability-density), and when LaunchDarkly declares a variation the winning variation. You select your desired threshold when you create an experiment. To learn more, read [Bayesian experiment results](/docs/home/experimentation/bayesian-results).
* **CUPED**: Specifies if LaunchDarkly has enabled [covariate adjustment (CUPED)](/docs/home/getting-started/vocabulary#cuped) for this experiment. CUPED uses data collected before contexts encounter an experiment to reduce variance in experiment results.
* **MCC** (frequentist experiments only): Specifies if you have [multiple comparisons correction (MCC)](/docs/guides/statistical-methodology/mcc) enabled to help reduce false positives in your experiment.
* To toggle off MCC on a running or completed experiment, click the **gear** icon in the results toolbar and uncheck the **Multiple comparisons correction** checkbox.
* **Sequential testing**: (Frequentist experiments only) Whether or not you have enabled [sequential testing to allow you to act on the results at any time](/docs/guides/statistical-methodology/choosing#fixed-horizon-versus-sequential).
LaunchDarkly reports sample ratio mismatch (SRM) detection as part of an experiment's health checks. To learn more, read [Experiment health checks](/docs/home/experimentation/health-checks).
 ## Results table
An experiment's results table displays each variation's performance in the experiment. You can display the results as a **Results table** or as a **Forest plot**. To switch between them, click the view menu and select the view you want. To show or hide columns in the results table, click the **Display** menu and select or deselect the columns you want to view.
To learn more, read [Bayesian experiment results](/docs/home/experimentation/bayesian-results) and [Frequentist experiment results](/docs/home/experimentation/frequentist-results).
The results table groups variation results by the metrics chosen for the experiment.
The "Sample size" column displays the number of units included in the analysis for each variation. Click a value in this column to view a breakdown of:
* The variation's total number of units exposed to the variation.
* The number of units included in the analysis after any exclusions. LaunchDarkly may exclude units from the experiment if you are using [metric measurement windows](/docs/home/metrics/components/window).
## Further analyzing results
You can further analyze your results using Data Export or by implementing qualitative user feedback.
### Data Export
If you're using Data Export, you can further analyze your experiment data using third-party tools. To learn more, read [Data Export](/docs/integrations/data-export).
### Qualitative user feedback
Experimentation provides useful quantitative feedback, but you may be interested in gathering qualitative feedback as well. To do this, you can configure your application to send user feedback to LaunchDarkly. To learn how, read [Collecting user feedback](/docs/home/releases/user-feedback).
## Results table
An experiment's results table displays each variation's performance in the experiment. You can display the results as a **Results table** or as a **Forest plot**. To switch between them, click the view menu and select the view you want. To show or hide columns in the results table, click the **Display** menu and select or deselect the columns you want to view.
To learn more, read [Bayesian experiment results](/docs/home/experimentation/bayesian-results) and [Frequentist experiment results](/docs/home/experimentation/frequentist-results).
The results table groups variation results by the metrics chosen for the experiment.
The "Sample size" column displays the number of units included in the analysis for each variation. Click a value in this column to view a breakdown of:
* The variation's total number of units exposed to the variation.
* The number of units included in the analysis after any exclusions. LaunchDarkly may exclude units from the experiment if you are using [metric measurement windows](/docs/home/metrics/components/window).
## Further analyzing results
You can further analyze your results using Data Export or by implementing qualitative user feedback.
### Data Export
If you're using Data Export, you can further analyze your experiment data using third-party tools. To learn more, read [Data Export](/docs/integrations/data-export).
### Qualitative user feedback
Experimentation provides useful quantitative feedback, but you may be interested in gathering qualitative feedback as well. To do this, you can configure your application to send user feedback to LaunchDarkly. To learn how, read [Collecting user feedback](/docs/home/releases/user-feedback).