> ## Documentation Index
> Fetch the complete documentation index at: https://launchdarkly.com/docs/llms.txt
> Use this file to discover all available pages before exploring further.
# Custom numeric metrics
This topic explains how to create a custom numeric metric in LaunchDarkly.
## About custom numeric metrics
Custom numeric metrics track changes to the amount of something, such as dollars spent or latency time. Unlike conversion metrics, which track how many users triggered an event or the number of times an event occurs, numeric metrics let you measure changes in value against a baseline flag variation you choose.
For example, you can use numeric metrics to track:
* Page load time
* The number of items in a shopping cart at checkout
* How long it takes for a server to respond to a request
**Call track and flush when an end user is redirected**
SDKs send events at regular intervals, such as every five seconds. If a browser redirects an end user to another page, any events that occurred between when the SDK last sent events and when the browser redirects are lost. To avoid this, call track and then flush when you know the browser redirects an end user to another page, such as on click. To learn more, read [Tracking custom events](/docs/sdk/features/events) and [Flushing events](/docs/sdk/features/flush).
### Example metric in SQL
Some customers find it helpful to think about LaunchDarkly metric calculations in terms of SQL statements. The following examples show how a custom numeric metric could be represented as SQL expressions, depending on whether you exclude or include units that generate no events, using example table and column names to represent metric components:
```sql title="Numeric metric excluding units" lines wrap theme={null}
WITH user_aggregates AS (
SELECT user_id, unit_agg_func(value) AS agg_value
FROM events
GROUP BY user_id
)
SELECT aggregation_func(agg_value)
FROM user_aggregates;
```
```sql title="Numeric metric including units" lines wrap theme={null}
WITH user_aggregates AS (
SELECT exposures.user_id, unit_agg_func(value) AS agg_value
FROM exposures
LEFT JOIN events
ON exposures.user_id = events.user_id
GROUP BY exposures.user_id
)
SELECT aggregation_func(agg_value)
FROM user_aggregates;
```
In these examples:
* `events` is a table that stores all of the metric events on which the metric is defined.
* `exposures` is a table that contains flag evaluation data collected during an experiment or guarded rollout that uses the metric.
* `user_id` is a table column that represents the context both for the metric analysis unit and for the randomization unit used in the experiment or guarded rollout. This example uses the "user" context kind, but a metric can use other context kinds, such as "account," "session," or "device."
* `unit_agg_func` represents the aggregation applied to each unit's events, either `SUM` or `AVG`, depending on whether you select **Sum** or **Average** as the aggregation type.
* `aggregation_func` represents the aggregation function that corresponds to the analysis method you select, such as `AVG` for average analysis or `PERCENTILE_CONT` for percentile analysis.
## Metric definition
When you configure the metric definition for a custom numeric metric, you first select either **Sum** or **Average** as the aggregation type for your measurement.
You then choose from options to define the analysis method and success criteria:
* The analysis units to use for measuring the event. This can be one or more context kinds, such as "user," "device," or "request," that the metric can measure events from.
* Analysis method:
* **Average**: "average" is the default analysis method. This method calculates the average of numerical event values per context.
* **P50** to **P99**: to use percentile analysis, choose between P50-P99. The options represent the 50th through the 99th percentile. This method analyzes event values that fall into the chosen percentile.
* Success criteria:
* **Higher is better**: choose this option for metrics measuring positive things like cart checkouts or sign-ups.
* **Lower is better**: choose this option for metrics measuring negative things like errors.
Finally, choose how to handle analysis units in experiments or rollouts that do not generate events:
* **Include units and set the value to 0**: this option is best for metrics where an incomplete process can be treated the same as 0, such as tracking cart totals for an online store. In this example, customers who put items in their cart but never completed the checkout process are treated as if they purchased \$0.
* **Exclude units that generate no events**: this option is best for latency metrics. If LaunchDarkly never receives an event for a context instance, you do not want to default to 0 because LaunchDarkly would interpret this as an extremely fast latency time, which would skew or invalidate the results.
To learn more about the metric definition options, read [Metric components](/docs/home/metrics/components).
You cannot use custom numeric metrics in funnel metric groups. To learn more, read [Funnel metric groups](/docs/home/metrics/metric-groups#funnel-metric-groups).
## Create custom numeric metrics
To add a custom numeric metric in LaunchDarkly, you must identify it with a code snippet embedded in your app.
This is an example of sending a `custom` event:
```java title="Example event" lines wrap theme={null}
client.track("Example event key", context, null, numericValue);
/* The `context` parameter is omitted in client-side SDKs */
```
Numeric metrics require an event key from your application's code to track metric data. The area of your code you should put custom metric information into, and the type of information you should include, vary based on which SDKs you use.
Usually, the information you should put in your code includes the event key, context object, data field, or numeric value fields.
**Event keys and metric keys are different**
Sending custom events to LaunchDarkly requires a unique event key. Set the event key to anything you want. Adding this event key to your codebase lets your SDK track actions customers take in your app as events. To learn more, read [Tracking custom events](/docs/sdk/features/events).
LaunchDarkly also automatically generates a metric key when you create a metric. You only use the metric key to identify the metric in API calls. To learn more, read [Creating and managing metrics](/docs/home/metrics/create-metrics).
Try it in your SDK: [Tracking custom events](/docs/sdk/features/events)
To create a custom numeric metric:
1. Open the **Data** section and navigate to the **Metrics** list.
2. Click **Create metric**. The "Create metric" dialog appears.
3. If you use [warehouse native metrics](/docs/home/warehouse-native/metrics), you can select either **LaunchDarkly hosted** or **Warehouse native**.
* Select **LaunchDarkly hosted** to measure events from LaunchDarkly SDKs.
* Select **Warehouse native** to measure events from an external warehouse, such as Snowflake.
* Select an existing **Metric data source** or click **+ Create** to create a new data source. To learn more, read [Metric data sources](/docs/home/warehouse-native/metric-data-sources).
4. If you chose the **LaunchDarkly hosted** event source, select an event kind of **Custom**.
5. Search for or enter an **Event key**.
* A list of events your environment has recently received appears when you click into the **Event key** field. Begin typing an event key to view a list of events that match your search. Hover over an event from the list to view which environments the event appears in, which context kinds sent the latest event, and which SDKs the event is coming from.
6. In the [Metric definition](#metric-definition) section, choose **Sum** or **Average** as the aggregation type for your metric. The window populates a full metric definition using default values.
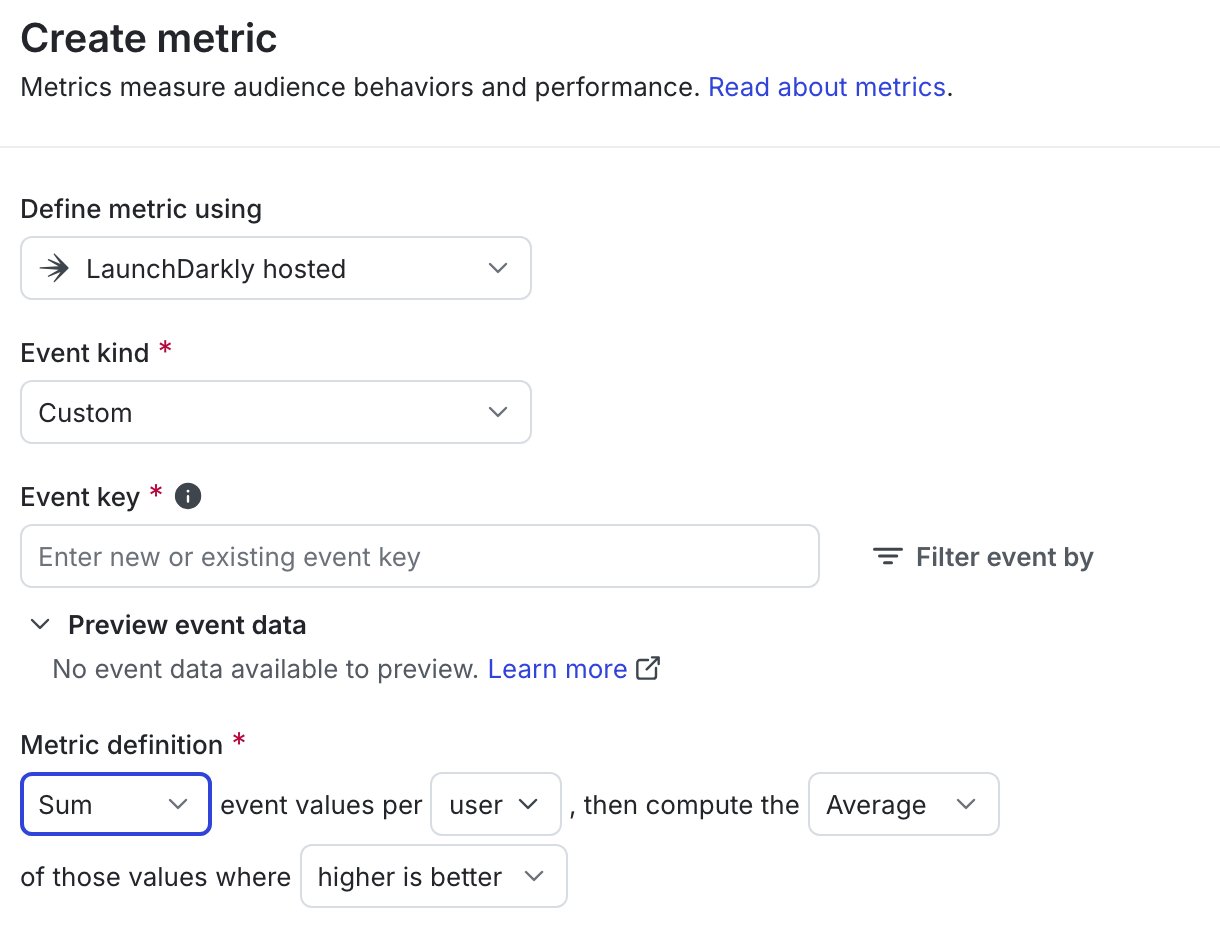 7. Change options in the "Metric definition" drop-down menus as needed:
* Change or select additional context kinds to use as the analysis units for the metric. Only context kinds marked as available for experiments and guarded rollouts appear as options. To learn more, read [Mark context kinds available for experiments](/docs/home/experimentation/randomization#mark-context-kinds-available-for-experiments).
* Select **Average** or a percentile between **P50** to **P99** to configure the analysis method.
* Choose **higher is better** or **lower is better** to define success criteria for attached experiments or guarded rollouts.
8. Select an option to handle units without events:
* **Include units and set the value to 0**: Select this option for metrics where an incomplete process can be treated the same as 0, such as for tracking cart totals for an online store.
* **Exclude units that generate no events**: Select this option for latency metrics or other metrics where a default value of 0 would skew or invalidate results.
9. Enter a **Unit of measure**.
10. Enter a **Metric Name**.
11. (Optional) Add a **Description**.
12. (Optional) Add any **Tags**.
13. (Optional) Update the **Maintainer**.
14. Click **Create**.
You can connect the metric to an [experiment](/docs/home/experimentation/create) or [guarded rollout](/docs/home/releases/guarded-rollouts) to monitor the impact of a flag change.
You can also use the REST API: [Create metric](/docs/api/metrics/create-metric)
7. Change options in the "Metric definition" drop-down menus as needed:
* Change or select additional context kinds to use as the analysis units for the metric. Only context kinds marked as available for experiments and guarded rollouts appear as options. To learn more, read [Mark context kinds available for experiments](/docs/home/experimentation/randomization#mark-context-kinds-available-for-experiments).
* Select **Average** or a percentile between **P50** to **P99** to configure the analysis method.
* Choose **higher is better** or **lower is better** to define success criteria for attached experiments or guarded rollouts.
8. Select an option to handle units without events:
* **Include units and set the value to 0**: Select this option for metrics where an incomplete process can be treated the same as 0, such as for tracking cart totals for an online store.
* **Exclude units that generate no events**: Select this option for latency metrics or other metrics where a default value of 0 would skew or invalidate results.
9. Enter a **Unit of measure**.
10. Enter a **Metric Name**.
11. (Optional) Add a **Description**.
12. (Optional) Add any **Tags**.
13. (Optional) Update the **Maintainer**.
14. Click **Create**.
You can connect the metric to an [experiment](/docs/home/experimentation/create) or [guarded rollout](/docs/home/releases/guarded-rollouts) to monitor the impact of a flag change.
You can also use the REST API: [Create metric](/docs/api/metrics/create-metric)