> ## Documentation Index
> Fetch the complete documentation index at: https://launchdarkly.com/docs/llms.txt
> Use this file to discover all available pages before exploring further.
# Observability metrics
**Observability is not available in federal environments**
To learn more, read LaunchDarkly in federal environments.
**This feature is in Early Access**
LaunchDarkly's observability features are publicly available in early access. Enable observability in the billing page.
This topic explains how to use LaunchDarkly observability features to ingest and visualize OpenTelemetry metrics from a variety of sources.
The LaunchDarkly OpenTelemetry collector provides the ability to ingest OpenTelemetry metrics from cloud environment integrations, from applications that use the LaunchDarkly observability SDK plugins, or from other applications that instrument OpenTelemetry metrics. The **Observability metrics** page displays all collected metric data, enabling you to view application and infrastructure measurements alongside existing errors, logs, and traces.
 You can use LaunchDarkly observability metrics features as a simple way to unify observability for your applications and cloud infrastructure without requiring additional software. It also provides a way to easily integrate existing services or applications that instrument OpenTelemetry metrics with newer applications that use LaunchDarkly observability SDKs.
## About observability metrics
Metrics displayed on the **Observability metrics** page are measurements recorded at runtime to provide health or performance signals for a given application or service. Observability metrics can come from a variety of sources, including from systems outside of LaunchDarkly, and you generally cannot use them to create experiments or guarded rollouts. When using the **Observability metrics** page, your focus should be on assessing the health or performance of applications and services independent of flag variations.
To learn more about creating and using LaunchDarkly metrics to evaluate flag variations in an experiment or rollout, read [Metrics in LaunchDarkly](/docs/home/metrics). The LaunchDarkly observability SDK plugins do export selected observability and OpenTelemetry events as autogenerated metrics that can be used with experiments and rollouts. To learn more, read [Autogenerated metrics](/docs/home/metrics/autogen-metrics).
## Viewing observability metrics
Use the main **Observability metrics** page to visualize the metrics available in LaunchDarkly. The **Time range** menu limits all displayed results to the selected time range.
You can use LaunchDarkly observability metrics features as a simple way to unify observability for your applications and cloud infrastructure without requiring additional software. It also provides a way to easily integrate existing services or applications that instrument OpenTelemetry metrics with newer applications that use LaunchDarkly observability SDKs.
## About observability metrics
Metrics displayed on the **Observability metrics** page are measurements recorded at runtime to provide health or performance signals for a given application or service. Observability metrics can come from a variety of sources, including from systems outside of LaunchDarkly, and you generally cannot use them to create experiments or guarded rollouts. When using the **Observability metrics** page, your focus should be on assessing the health or performance of applications and services independent of flag variations.
To learn more about creating and using LaunchDarkly metrics to evaluate flag variations in an experiment or rollout, read [Metrics in LaunchDarkly](/docs/home/metrics). The LaunchDarkly observability SDK plugins do export selected observability and OpenTelemetry events as autogenerated metrics that can be used with experiments and rollouts. To learn more, read [Autogenerated metrics](/docs/home/metrics/autogen-metrics).
## Viewing observability metrics
Use the main **Observability metrics** page to visualize the metrics available in LaunchDarkly. The **Time range** menu limits all displayed results to the selected time range.
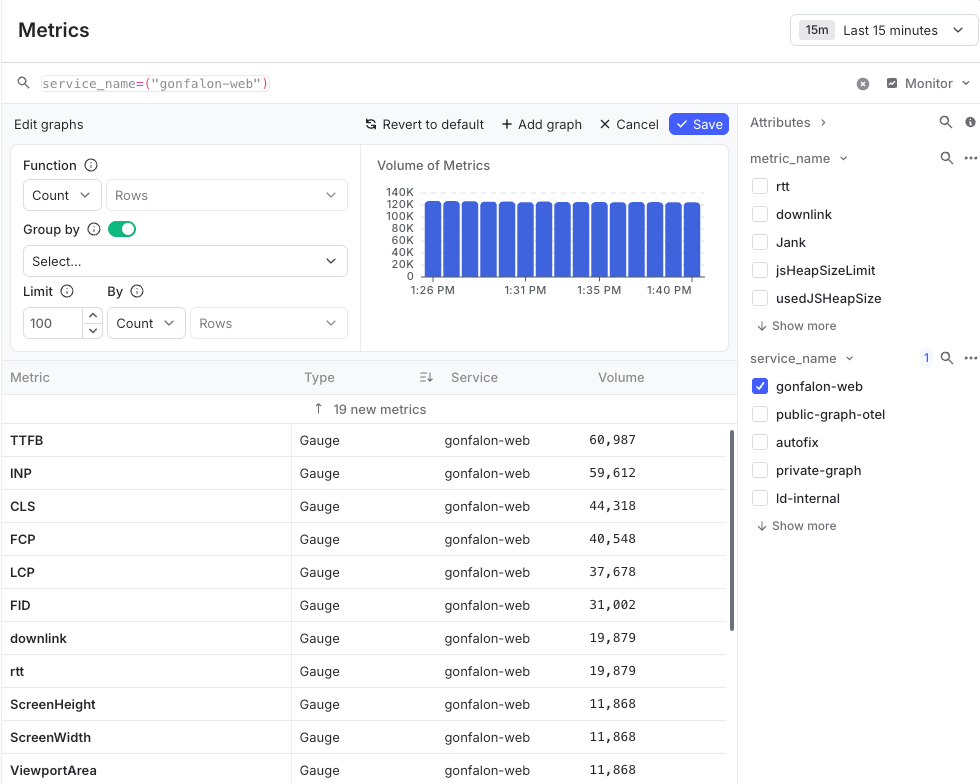 Rows below the chart show details for each available metric, including the metric type, the service that generated the metric, and the volume of metric measurements that were collected. Click a column name to sort by that attribute. Click the name of a metric to open full details about the metric and its associated attributes.
Click **Show all filters** to select attributes to filter the metrics shown on the page.
Click **Edit graphs** to modify the functions and values used to visualize metrics on the timeline chart, or to create new graphs to show multiple metric measurements in the timeline.
On line charts, you can overlay exemplars, which are references to the individual measurements behind an aggregated value. Each exemplar links back to the trace or session that recorded the measurement. To learn more, read [Metric exemplars](/docs/home/observability/metric-exemplars).
## Sending observability metrics to LaunchDarkly
LaunchDarkly can ingest observability metrics from a variety of sources:
* Observability SDK plugins provide methods to help you record metrics and metric values in your LaunchDarkly application, including point-in-time, cumulative count, cumulative increment, and counter metrics. The available metric types and the methods used to generate them vary by LaunchDarkly SDK. All metrics generated using the SDK plugins are immediately available as LaunchDarkly observability metrics. To learn more, read [Recording metrics](/docs/sdk/features/observability-metrics).
* LaunchDarkly provides several integrations to help you connect LaunchDarkly to cloud providers for the purpose of ingesting metric measurements generated in your cloud platform. To learn more, read [AWS CloudWatch Metrics](/docs/home/observability/aws-cloudwatch-metrics) or [Azure Monitor](/docs/home/observability/azure-monitor).
* Any applications that use the [OpenTelemetry Metrics API](https://opentelemetry.io/docs/specs/otel/metrics/) to generate metrics can send metrics to the LaunchDarkly OTLP endpoint at `https://otel.observability.app.launchdarkly.com/v1/metrics`, using either an OpenTelemetry [Collector](https://opentelemetry.io/docs/specs/otel/overview/#collector) or another OpenTelemetry-compatible pipeline. To learn more, read [Sending OpenTelemetry data to LaunchDarkly](/docs/sdk/features/opentelemetry-client-side#sending-opentelemetry-data-to-launchdarkly).
Rows below the chart show details for each available metric, including the metric type, the service that generated the metric, and the volume of metric measurements that were collected. Click a column name to sort by that attribute. Click the name of a metric to open full details about the metric and its associated attributes.
Click **Show all filters** to select attributes to filter the metrics shown on the page.
Click **Edit graphs** to modify the functions and values used to visualize metrics on the timeline chart, or to create new graphs to show multiple metric measurements in the timeline.
On line charts, you can overlay exemplars, which are references to the individual measurements behind an aggregated value. Each exemplar links back to the trace or session that recorded the measurement. To learn more, read [Metric exemplars](/docs/home/observability/metric-exemplars).
## Sending observability metrics to LaunchDarkly
LaunchDarkly can ingest observability metrics from a variety of sources:
* Observability SDK plugins provide methods to help you record metrics and metric values in your LaunchDarkly application, including point-in-time, cumulative count, cumulative increment, and counter metrics. The available metric types and the methods used to generate them vary by LaunchDarkly SDK. All metrics generated using the SDK plugins are immediately available as LaunchDarkly observability metrics. To learn more, read [Recording metrics](/docs/sdk/features/observability-metrics).
* LaunchDarkly provides several integrations to help you connect LaunchDarkly to cloud providers for the purpose of ingesting metric measurements generated in your cloud platform. To learn more, read [AWS CloudWatch Metrics](/docs/home/observability/aws-cloudwatch-metrics) or [Azure Monitor](/docs/home/observability/azure-monitor).
* Any applications that use the [OpenTelemetry Metrics API](https://opentelemetry.io/docs/specs/otel/metrics/) to generate metrics can send metrics to the LaunchDarkly OTLP endpoint at `https://otel.observability.app.launchdarkly.com/v1/metrics`, using either an OpenTelemetry [Collector](https://opentelemetry.io/docs/specs/otel/overview/#collector) or another OpenTelemetry-compatible pipeline. To learn more, read [Sending OpenTelemetry data to LaunchDarkly](/docs/sdk/features/opentelemetry-client-side#sending-opentelemetry-data-to-launchdarkly).