> ## Documentation Index
> Fetch the complete documentation index at: https://launchdarkly.com/docs/llms.txt
> Use this file to discover all available pages before exploring further.
# Experimentation rate
**Engineering insights is not available in federal environments**
To learn more, read LaunchDarkly in federal environments.
**Engineering insights is not available in LaunchDarkly's European Union (EU) instance**
To learn more, read LaunchDarkly in the European Union (EU).
This topic explains how to use the Experimentation rate page in engineering insights.
Experiments let you measure the effect of flags on end users by tracking metrics your team cares about. You can measure things like page views, clicks, load time, infrastructure costs, and more. By connecting metrics you create to flags in your LaunchDarkly environment, you can measure the changes in your customers' behavior based on what flags they evaluate. This helps you make more informed decisions, so the features your development team ships align with your business objectives. To learn more, read [Experimentation](/docs/home/experimentation).
The Experimentation rate page displays the number of flag changes that are associated with an experiment.
## Experimentation summary
The Experimentation summary includes the following information:
* Percentage of flag changes with experiments
* Total number of changes with experiments
* Total number of changes
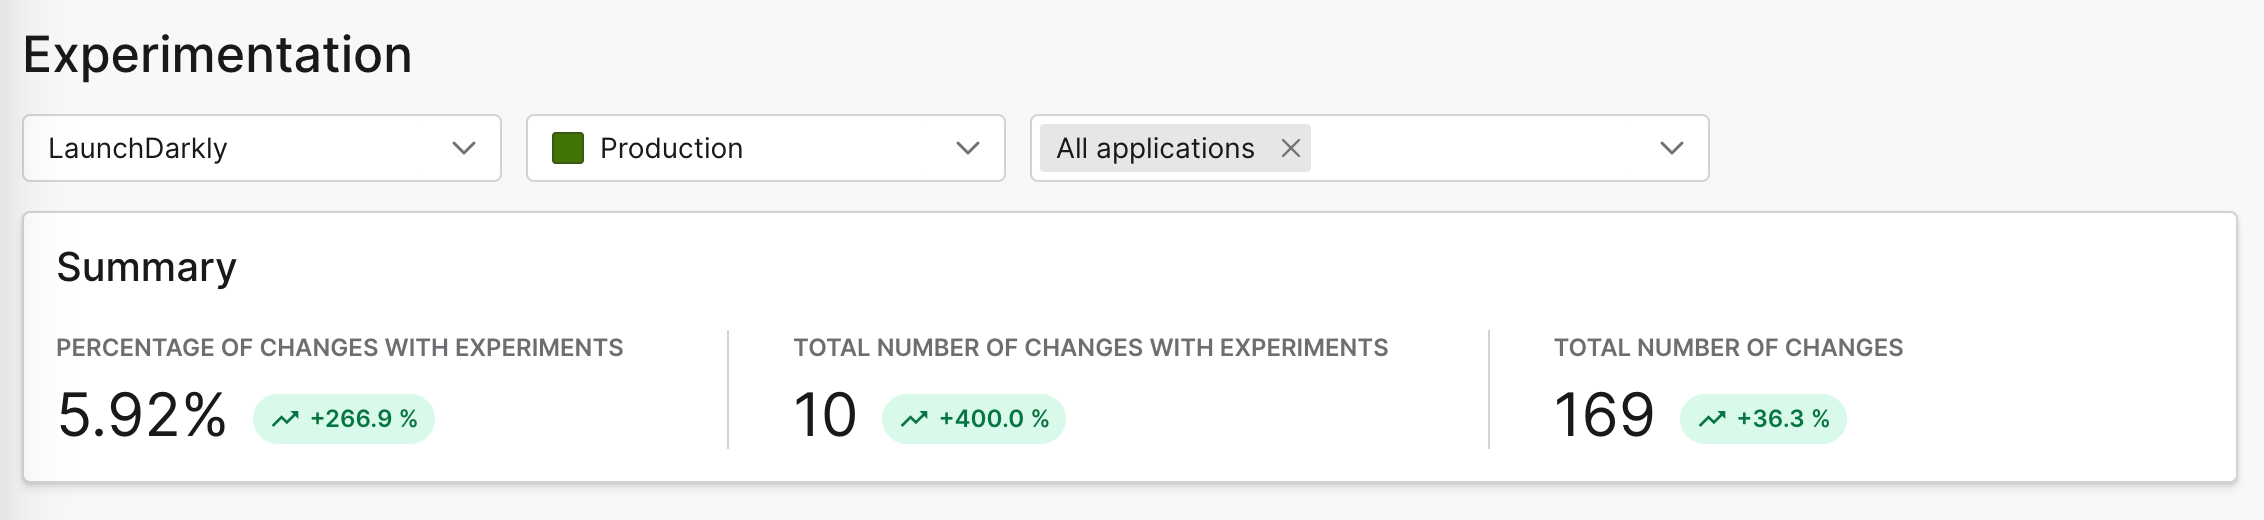 Use the selection menus to narrow your view to a specific LaunchDarkly project or environment, or one or more applications. You can also change the selected time range to the last 1, 2, 4, or 12 weeks, or a custom range.
## Experimentation rate
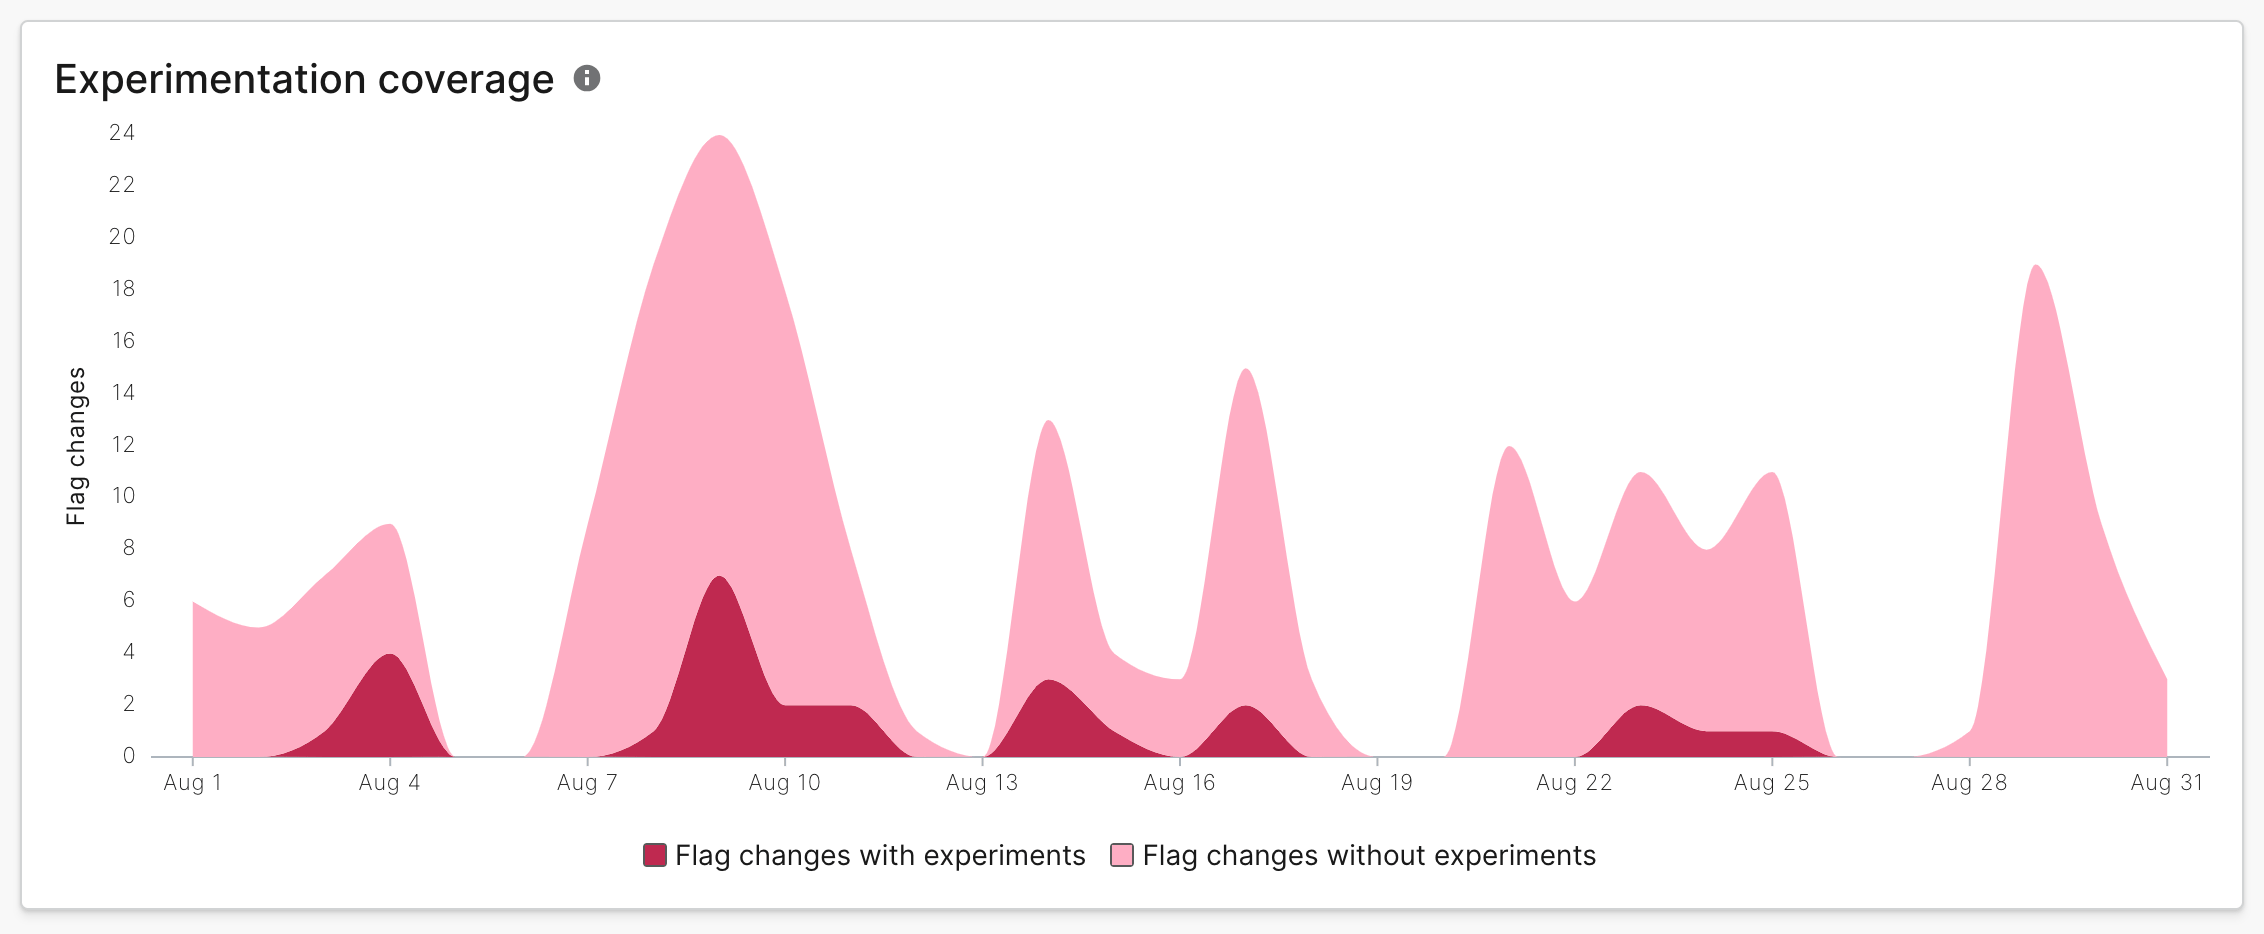
The Experimentation rate chart tracks the number of flag changes with and without experiments by date.
Use the selection menus to narrow your view to a specific LaunchDarkly project or environment, or one or more applications. You can also change the selected time range to the last 1, 2, 4, or 12 weeks, or a custom range.
## Experimentation rate
The Experimentation rate chart tracks the number of flag changes with and without experiments by date.
 ## Flag changes
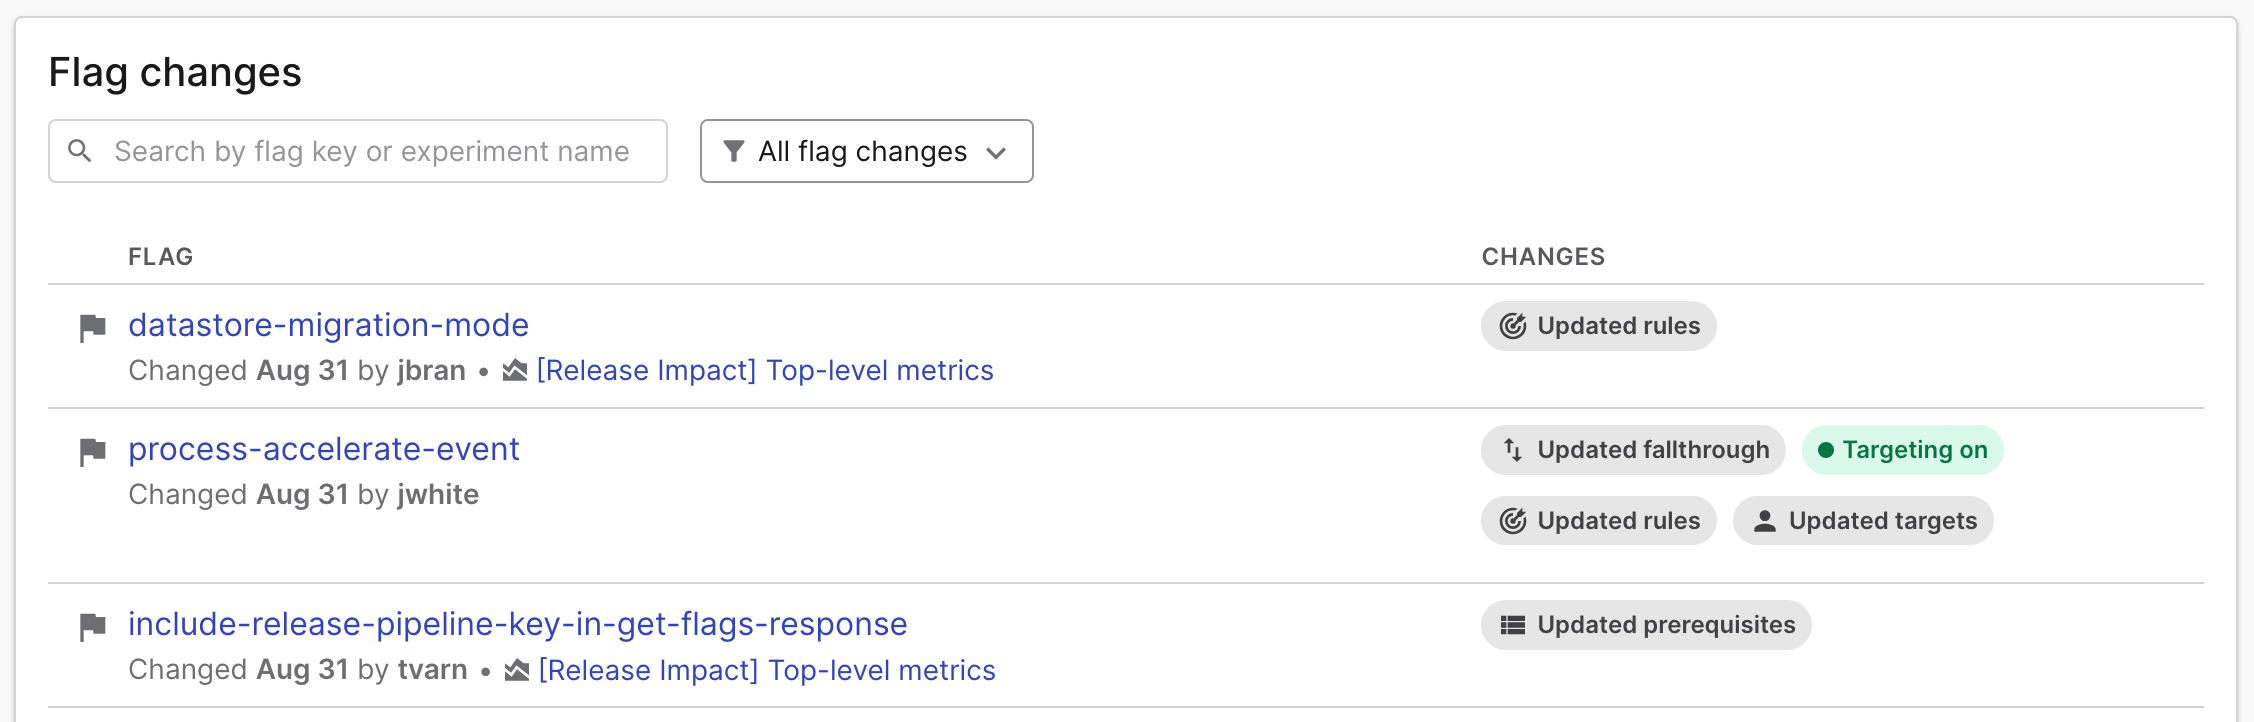
The flag changes list displays the following information:
* The flag name. Click on the flag name to view the full flag details in the **Flags** list.
* The date of the flag change.
* The name of the member who made the flag change.
* Which experiment the flag change is associated with. Click on the experiment name to view the associated experiment iteration.
* The kinds of changes made.
You can filter by flag changes with or without experiments, and search by flag key or experiment name.
## Flag changes
The flag changes list displays the following information:
* The flag name. Click on the flag name to view the full flag details in the **Flags** list.
* The date of the flag change.
* The name of the member who made the flag change.
* Which experiment the flag change is associated with. Click on the experiment name to view the associated experiment iteration.
* The kinds of changes made.
You can filter by flag changes with or without experiments, and search by flag key or experiment name.