Proving ROI with data-driven AI agent experiments
Proving ROI with data-driven AI agent experiments
Newer features are available with AgentControl
This guide was published in 2025, before LaunchDarkly shipped several features that supersede or extend the experiment patterns shown below. The methodology documented in this guide still works, but for new experiments you may also want to use:
- Online evaluations and custom judges: LLM-as-judge scores feed directly into experiment metrics, so judge accuracy or toxicity can be the primary metric
- Agent graphs: Agent graphs support A/B test routing topology and per-node model choices, not just whole-config swaps
- Offline evaluations and Datasets: Supply your own data to lock in a regression baseline before you run a live experiment
- LLM Playground: Test variations on prompts before you send them to real traffic
To learn more, read AgentControl.
This guide explains how to measure and prove the return on investment (ROI) of AI model changes with LaunchDarkly experiments. It shows you how to use statistical analysis to find unexpected performance wins and cost paradoxes.
Imagine a scenario where your CEO asks you “Is the new expensive AI model worth it? And does the enhanced privacy justify the cost?” By the end of this guide, you will be able to answer this question.
You will run two A/B tests that reveal:
- Whether aggressive PII redaction hurts user satisfaction
- Whether Claude Opus 4 is worth 33% more than GPT-4o
- Any other unexpected gains from using the new model
You can use this guide in one of two ways:
- Just the concepts (5-minute read): Skip to About the two experiments to learn the methodology without running code.
- Full working tutorial (30 minutes): Follow the complete guide to run your own experiments.
Prerequisites
If you choose to complete the full tutorial, you need the following prerequisites:
- An active LaunchDarkly project, set up according to the following tutorials:
- API keys for Anthropic, OpenAI, and LaunchDarkly:
Agent costs
The agent costs associated with the experiment may cost anywhere from $5 to $35. The default walk-through uses Claude Opus 4 (premium model) for testing. To reduce costs while still learning the experimentation patterns, you can modify bootstrap/tutorial_3_experiment_variations.py in your cloned repository to test with the free Mistral model instead.
To reduce costs, change the following in the create_premium_model_variations function:
This reduces the experiment cost by about $20. You will still have costs from the control group using GPT-4o and other agents in the system.
How the experiments work
Your AI system will automatically test variations on simulated users, collecting real performance data that flows directly to LaunchDarkly for statistical analysis.
Here’s how:
- Traffic simulation generates queries from your knowledge base
- The experiments randomly assign each user to experiment variations
- LaunchDarkly evaluates AI responses for quality and tracks cost and speed
- LaunchDarkly calculates statistical significance automatically
The two experiments can run independently. Users can participate in both, but the results are analyzed separately.
Methodology
Our supervisor agent routes PII queries to the security agent, then to support, while clean queries go directly to support. LaunchDarkly tracks metrics at the user level across all agents, which can reveal system-wide effects.
About the two experiments
This guide explains how to run two concurrent experiments:
- Security agent analysis
- Premium model value analysis
The experiments are explained below.
Experiment 1: Security agent analysis
Here is an overview of the first experiment:
- Hypothesis: “Strict security using free Mistral model with aggressive PII redaction will improve performance without harming user experience or significantly increasing system costs.”
- Variations (50% each):
- Control: Basic security with Claude Haiku, including moderate PII redaction
- Treatment: Strict security with Mistral free, including aggressive PII redaction
- Success criteria:
- Positive feedback rate: stable or improving (not significantly worse)
- Cost increase: ≤15% with ≥75% confidence
- Latency increase: ≤3 seconds (don’t significantly slow down)
- Enhanced privacy protection delivered
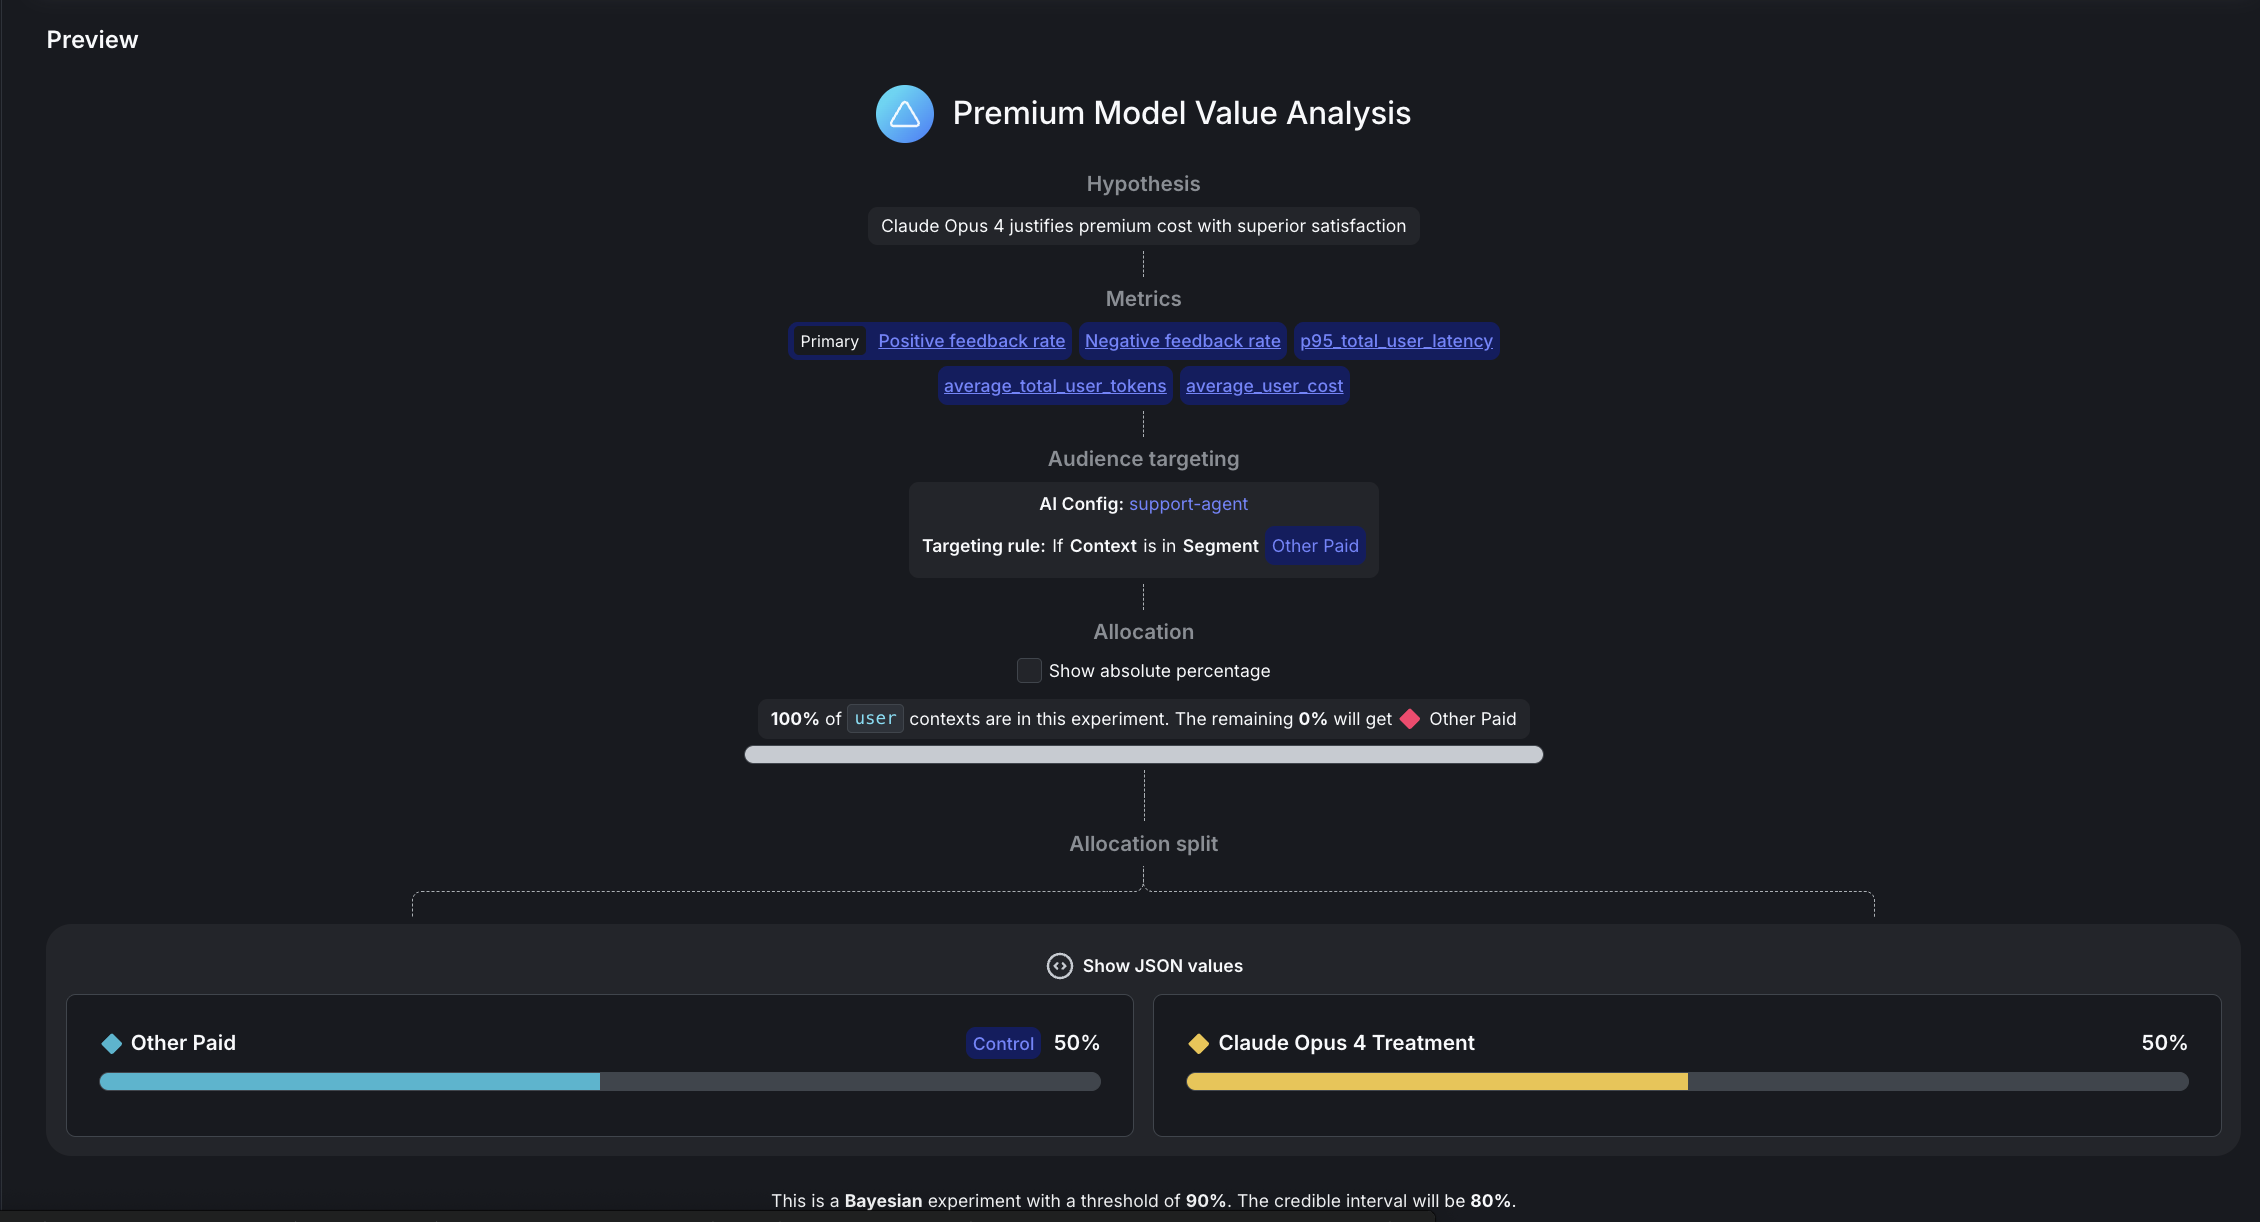
Experiment 2: Premium model value analysis
Here is an overview of the second experiment:
- Hypothesis: “Claude Opus 4 will justify its premium cost over GPT-4o due to its improved feedback rate.”
- Variations (50% each):
- Control: GPT-4o with full tools (current version)
- Treatment: Claude Opus 4 with identical tools
- Success criteria (must meet 90% threshold):
- ≥15% positive feedback rate improvement by Claude Opus 4
- Cost-value ratio ≥ 0.25 (positive feedback rate gain % ÷ cost increase %)
Step 1: Set up metrics
This section explains how to configure the metrics needed for your two experiments.
Navigate to Metrics in LaunchDarkly and create three custom metrics:
Expand the sections below to view the full metric setups.
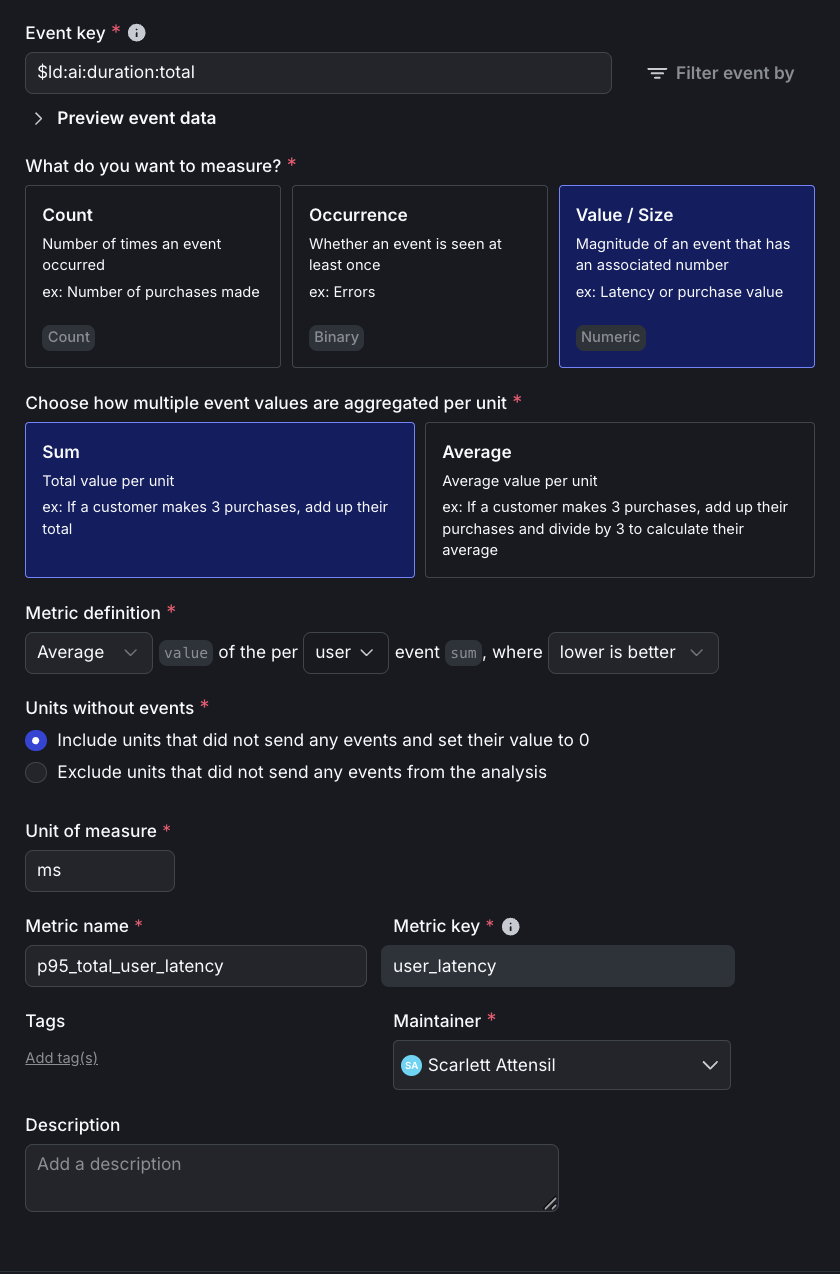
Click to expand the P95 latency metric setup
Here is the detailed setup for the P95 latency metric:
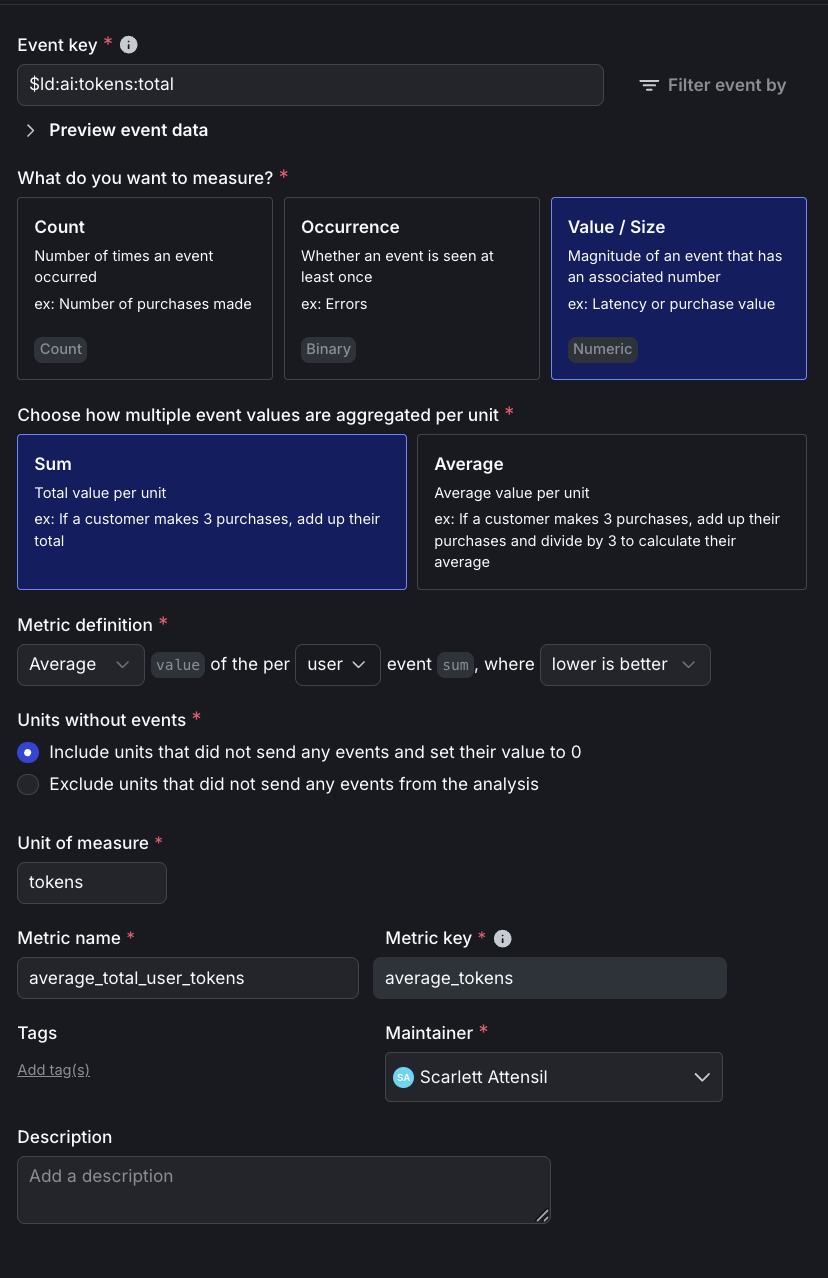
Click to expand the total tokens metric setup
Here is the detailed setup for the total tokens metric:
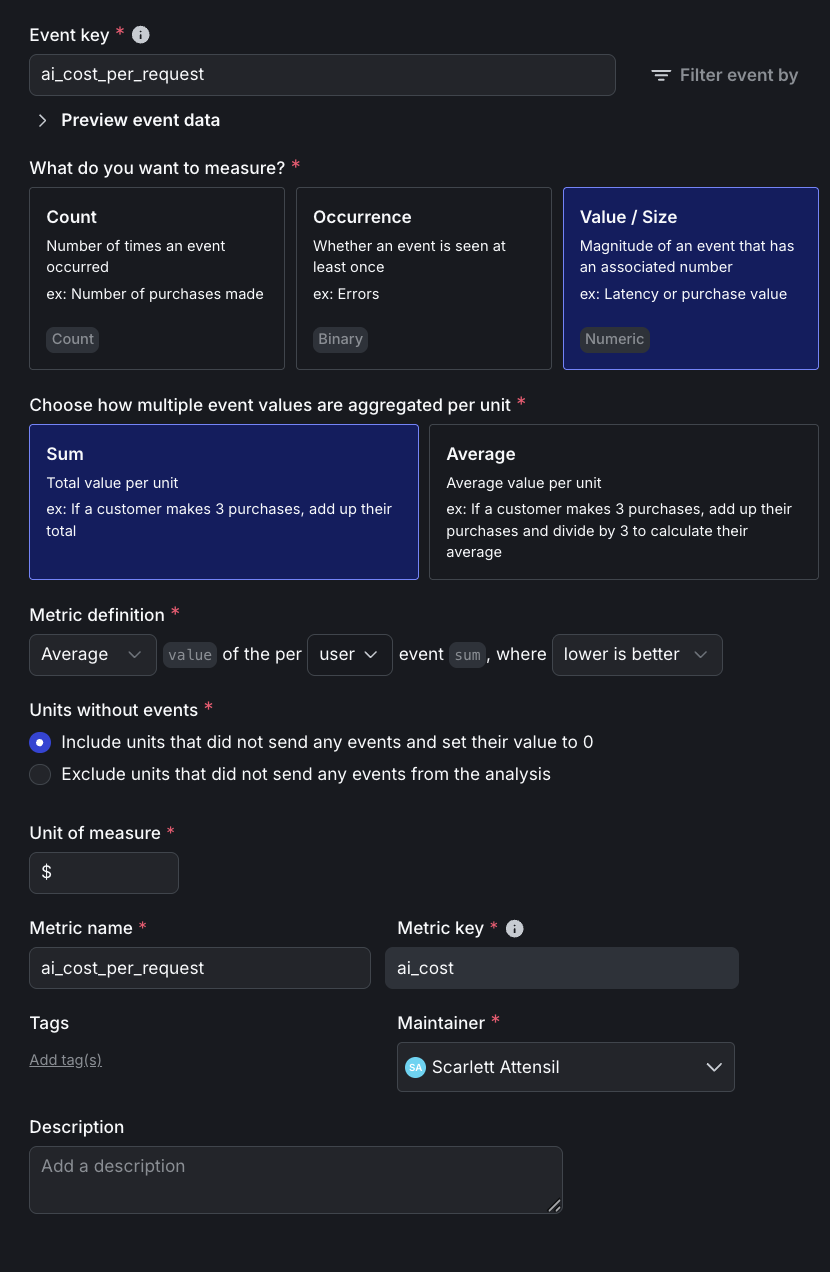
Click to expand the cost per request metric setup
Here is the detailed setup for the cost per request metric:
In addition to the above custom metrics, you will also use these built-in metrics:
The cost tracking is implemented in utils/cost_calculator.py, which calculates actual dollar costs using the formula (input_tokens × input_price + output_tokens × output_price) / 1M. The system has pre-configured pricing for each model as of October 2025: GPT-4o at $2.50/$10 per million tokens, Claude Opus 4 at $15/$75, and Claude Sonnet at $3/$15. When a request completes, the cost is immediately calculated and sent to LaunchDarkly as a custom event, enabling direct cost-per-user analysis in your experiments.
Step 2: Create experiment variations
Create the experiment variations using this bootstrap script:
This creates the claude-opus-treatment variation for the “Premium model value analysis” experiment. To verify the script worked correctly, navigate to your “support-model-config” feature flag in LaunchDarkly. You should now see the claude-opus-treatment variation alongside your existing variations. The “Security agent analysis” experiment will use your existing baseline and enhanced variations. Both experiments use the existing other-paid configuration as their control group.
Step 3: Configure the security agent experiment
In the left sidebar, expand AI, then select Configs, then open security-agent. In the right sidebar, click the plus + sign next to Experiments to create a new experiment.
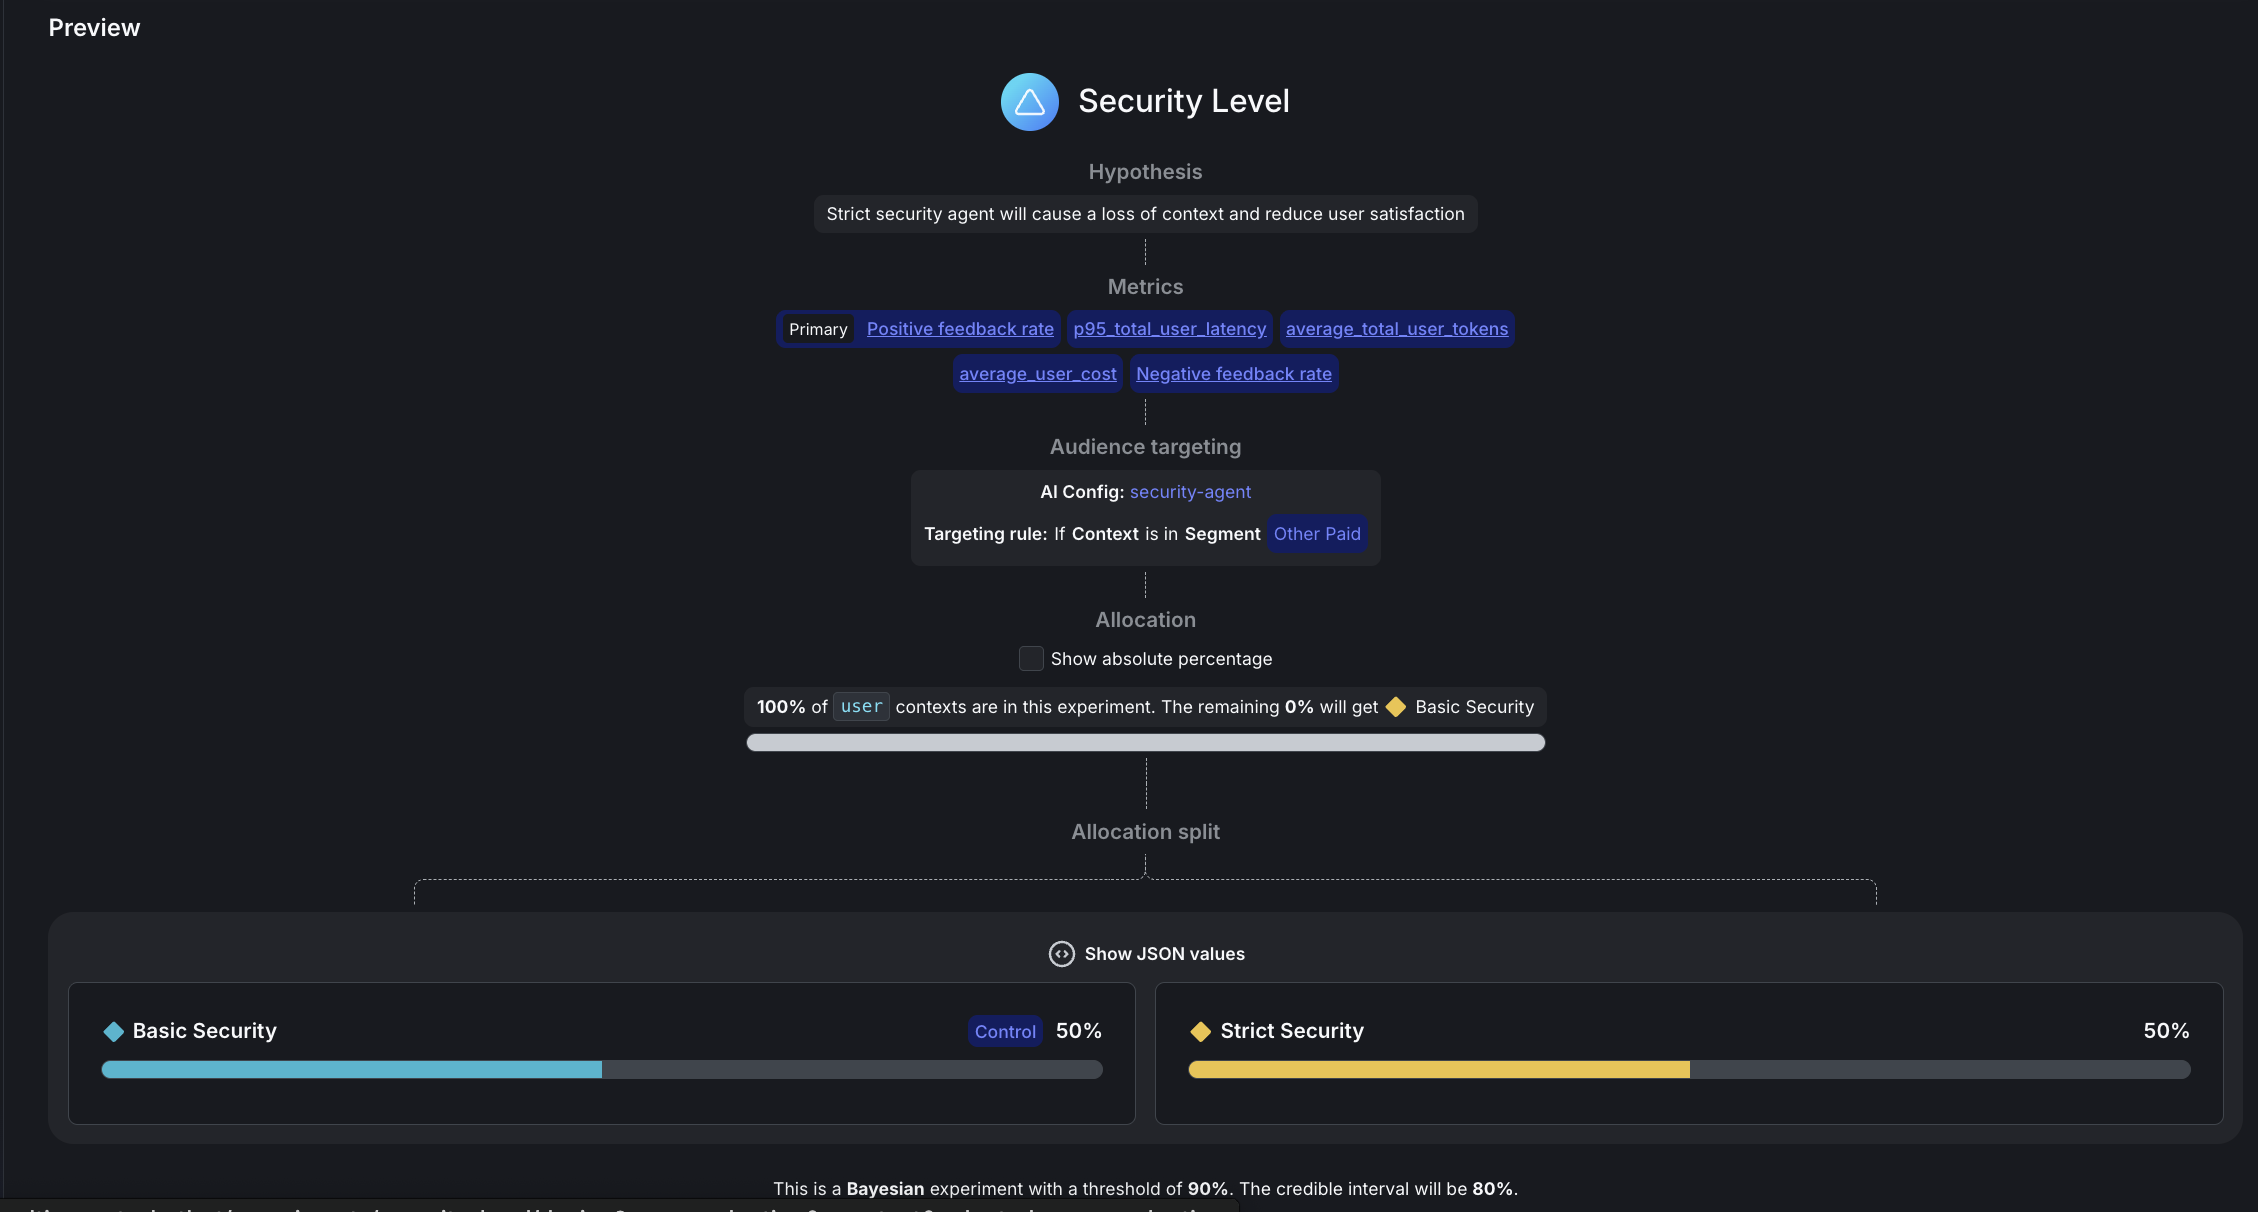
Here is how to set up your experiment:
- Name: Security level
- Hypothesis: “Strict security using free Mistral model with aggressive PII redaction will improve performance without harming user experience or significantly increasing system costs.”
- Randomize by:
user - Metrics: Click “Select metrics or metric groups” and add:
Positive feedback rate: Select first to set as PrimaryNegative feedback ratep95_total_user_latencyai_cost_per_request
- Flag or config: security-agent
Targeting rule: Rule 4
- This configures
If Context>is in SegmentthenOther Paid
- This configures
- Variations served outside of this experiment:
Basic Security - Sample size: Set to
100%of users in this experiment - Variations split: Click “Edit” and configure:
pii-detector:0%Basic Security:50%Strict Security:50%- To set these percentages, first scroll down to the Control field and set
Basic Securityas the control variation, otherwise you won’t be able to allocate 50% traffic to it.
- Control:
Basic Security - Statistical approach:
Bayesian - Threshold:
90%
Click Save, then click Start experiment.
You may see a “Health warning” indicator after starting the experiment. This is normal and expected when no variations have been exposed yet. The warning will clear after your experiment starts receiving traffic and data begins flowing.
Step 4: Configure the premium model experiment
In the left sidebar, expand AI, then select Configs, then open support-agent. In the right sidebar, click the plus + sign next to Experiments to create a new experiment.
Here is how to set up your experiment:
- Name: Premium model value analysis
- Hypothesis: “Claude Opus 4 will justify its premium cost over GPT-4o due to its improved feedback rate.”
- Randomize by:
user - Metrics: Click “Select metrics or metric groups” and add:
Positive feedback rate: Select first to set as PrimaryNegative feedback ratep95_total_user_latencyaverage_total_user_tokensai_cost_per_request
- Flag or config: support-agent
- Targeting rule: Rule 4
- This configures
If Context>is in SegmentthenOther Paid
- This configures
- Variations served outside of this experiment:
other-paid - Sample size: Set to
100%of users in this experiment - Variations split: Click “Edit” and configure:
rag-search-enhanced:0%eu-free:0%eu-paid:0%other-free:0%other-paid:50%international-standard:0%claude-opus-treatment:50%- To set these percentages, first scroll down to the Control field and set
Basic Securityas the control variation, otherwise you won’t be able to allocate 50% traffic to it.
- Control:
other-paid - Statistical approach:
Bayesian - Threshold:
90%
Click Save, then click Start experiment.
You may see a “Health warning” indicator after starting the experiment. This is normal and expected when no variations have been exposed yet. The warning will clear once your experiment starts receiving traffic and data begins flowing.
Understanding your experiment design
If two independent experiments are running concurrently on the same users, then each user experiences:
- One security variation (
Basic SecurityorStrict Security) - One model variation (
Claude Opus 4 TreatmentorOther Paid (GPT-4o))
Random assignment ensures balance, because ~50% of users receive each combination.
Step 5: Run a traffic generator
Start your backend and generate realistic experiment data. Choose between sequential or concurrent traffic generation.
Concurrent traffic generator
We recommend this option for large datasets.
Here is the code for faster experiment data generation with parallel requests:
This configuration includes:
- 200 queries by default. You can edit the script to change this number.
- 10 concurrent requests running in parallel.
- 2000-second timeout (33 minutes) per request to handle MCP tool rate limits.
Runtime depends largely on if you retain MCP tool enablement as these take much longer to complete.
Sequential traffic generator
We recommend this option for simple, one-at-a-time traffic generation:
What happens during traffic simulation:
- Knowledge extraction: Claude analyzes your docs and identifies 20+ realistic topics
- Query generation: Each test randomly selects from these topics for diversity
- AI-powered evaluation: Claude judges responses as thumbs_up/thumbs_down/neutral
- Automatic tracking: All metrics flow to LaunchDarkly in real-time
Here is an example of the traffic generation output you might see:
Relevant performance information includes:
- Most queries complete in 10-60 seconds
- Queries using
semantic_scholarMCP tool may take 5-20 minutes due to API rate limits - Concurrent execution handles slow requests gracefully by continuing with others
- Failed/timeout requests (typically less than 5%) don’t affect experiment validity
Monitor results
Refresh your LaunchDarkly experiment Results tabs to see data flowing in. Cost metrics appear as custom events alongside feedback and token metrics.
Interpreting your results
After your experiments have collected data from about 100 users per variation, you’ll see results in the LaunchDarkly UI. Here’s how to interpret them:
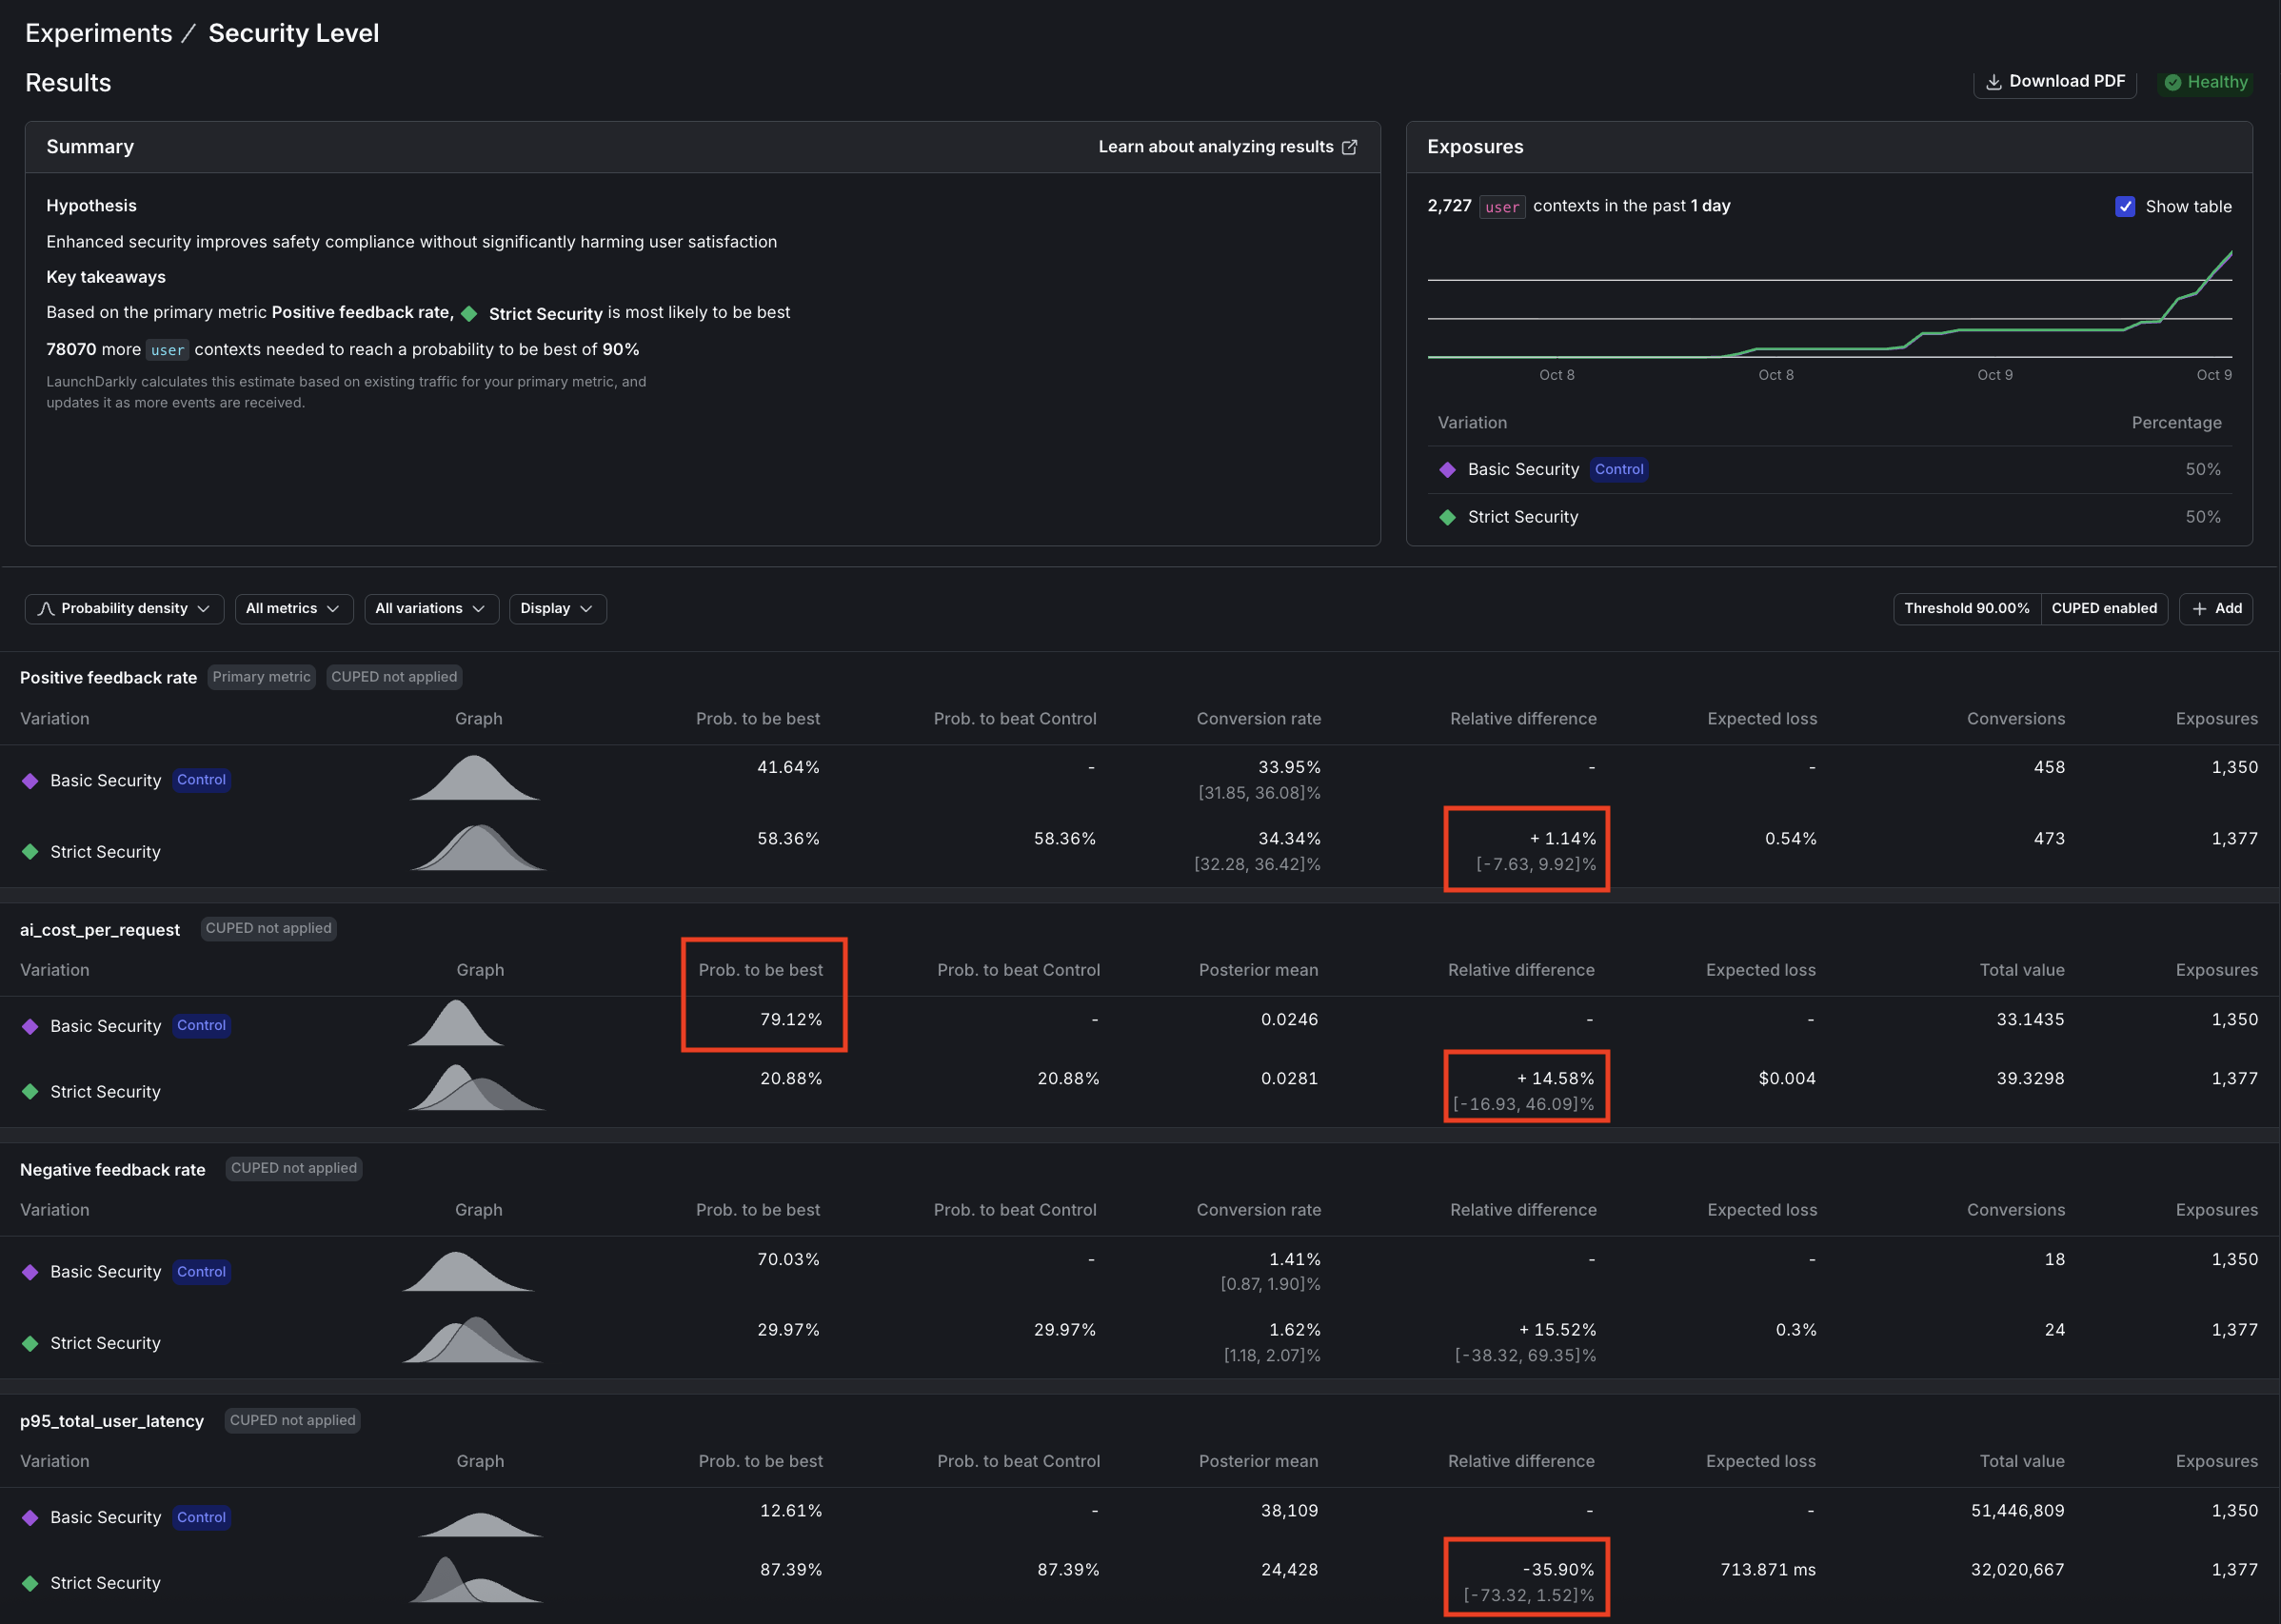
Question 1: Security agent analysis
Question: Does enhanced security improve safety without significantly impacting positive feedback rates?
Answer: Not all metrics reach significance at the same rate. In our security experiment we ran over 2,000 more users than the model experiment, turning off the MCP tools and using --pii-percentage 100 to maximize PII detection.
This is what we found:
- Latency: 87% confidence (nearly significant, clear 36% improvement)
- Cost: 21% confidence (high variance, needs 5-10x more data)
- Feedback: 58% confidence (sparse signal, needs 5-10x more data)
This is normal. Low-variance metrics (latency, tokens) produce results quickly. High-variance metrics (cost, feedback) need massive samples. You may not be able to wait for every metric to hit 90%. Some metrics produce strong signals quickly, but for others, draw conclusions from the data and judgment based on your own experience.
Verdict: Deploy strict security
These results show that enhanced privacy is worth the modest cost.
The results tell a compelling story:
- Latency (p95) is approaching significance with 87% confidence that “Strict security” is faster, a win we didn’t anticipate.
- Cost per request shows 79% confidence that “Basic security” costs less, or conversely, 21% confidence that “Strict” costs more, also approaching significance.
- Positive feedback rate remains inconclusive with only 58% confidence that “Strict security” performs better, indicating we need more data to draw conclusions about user satisfaction.
The hidden cost paradox
Strict security uses free Mistral for PII detection, yet increases total system cost by 14.6%:
Why does the support agent cost more? More aggressive PII redaction removes context, forcing the support agent to generate longer, more detailed responses to compensate for the missing information. This demonstrates why system-level experiments matter. Optimizing one agent can inadvertently increase costs downstream.
Decision logic:
Conclusion: Deploy strict security. We expected latency to stay within 3 seconds of baseline, but discovered a 36% improvement instead (with 87% confidence). Mistral is significantly faster than Claude Haiku. Combined with enhanced privacy protection, this more than justifies the modest 14.5% cost increase (with 79% confidence).
At scale, paying ~$0.004 more per request for significantly better privacy compliance and faster responses is a clear win for EU users and privacy-conscious segments.
Here are the results:
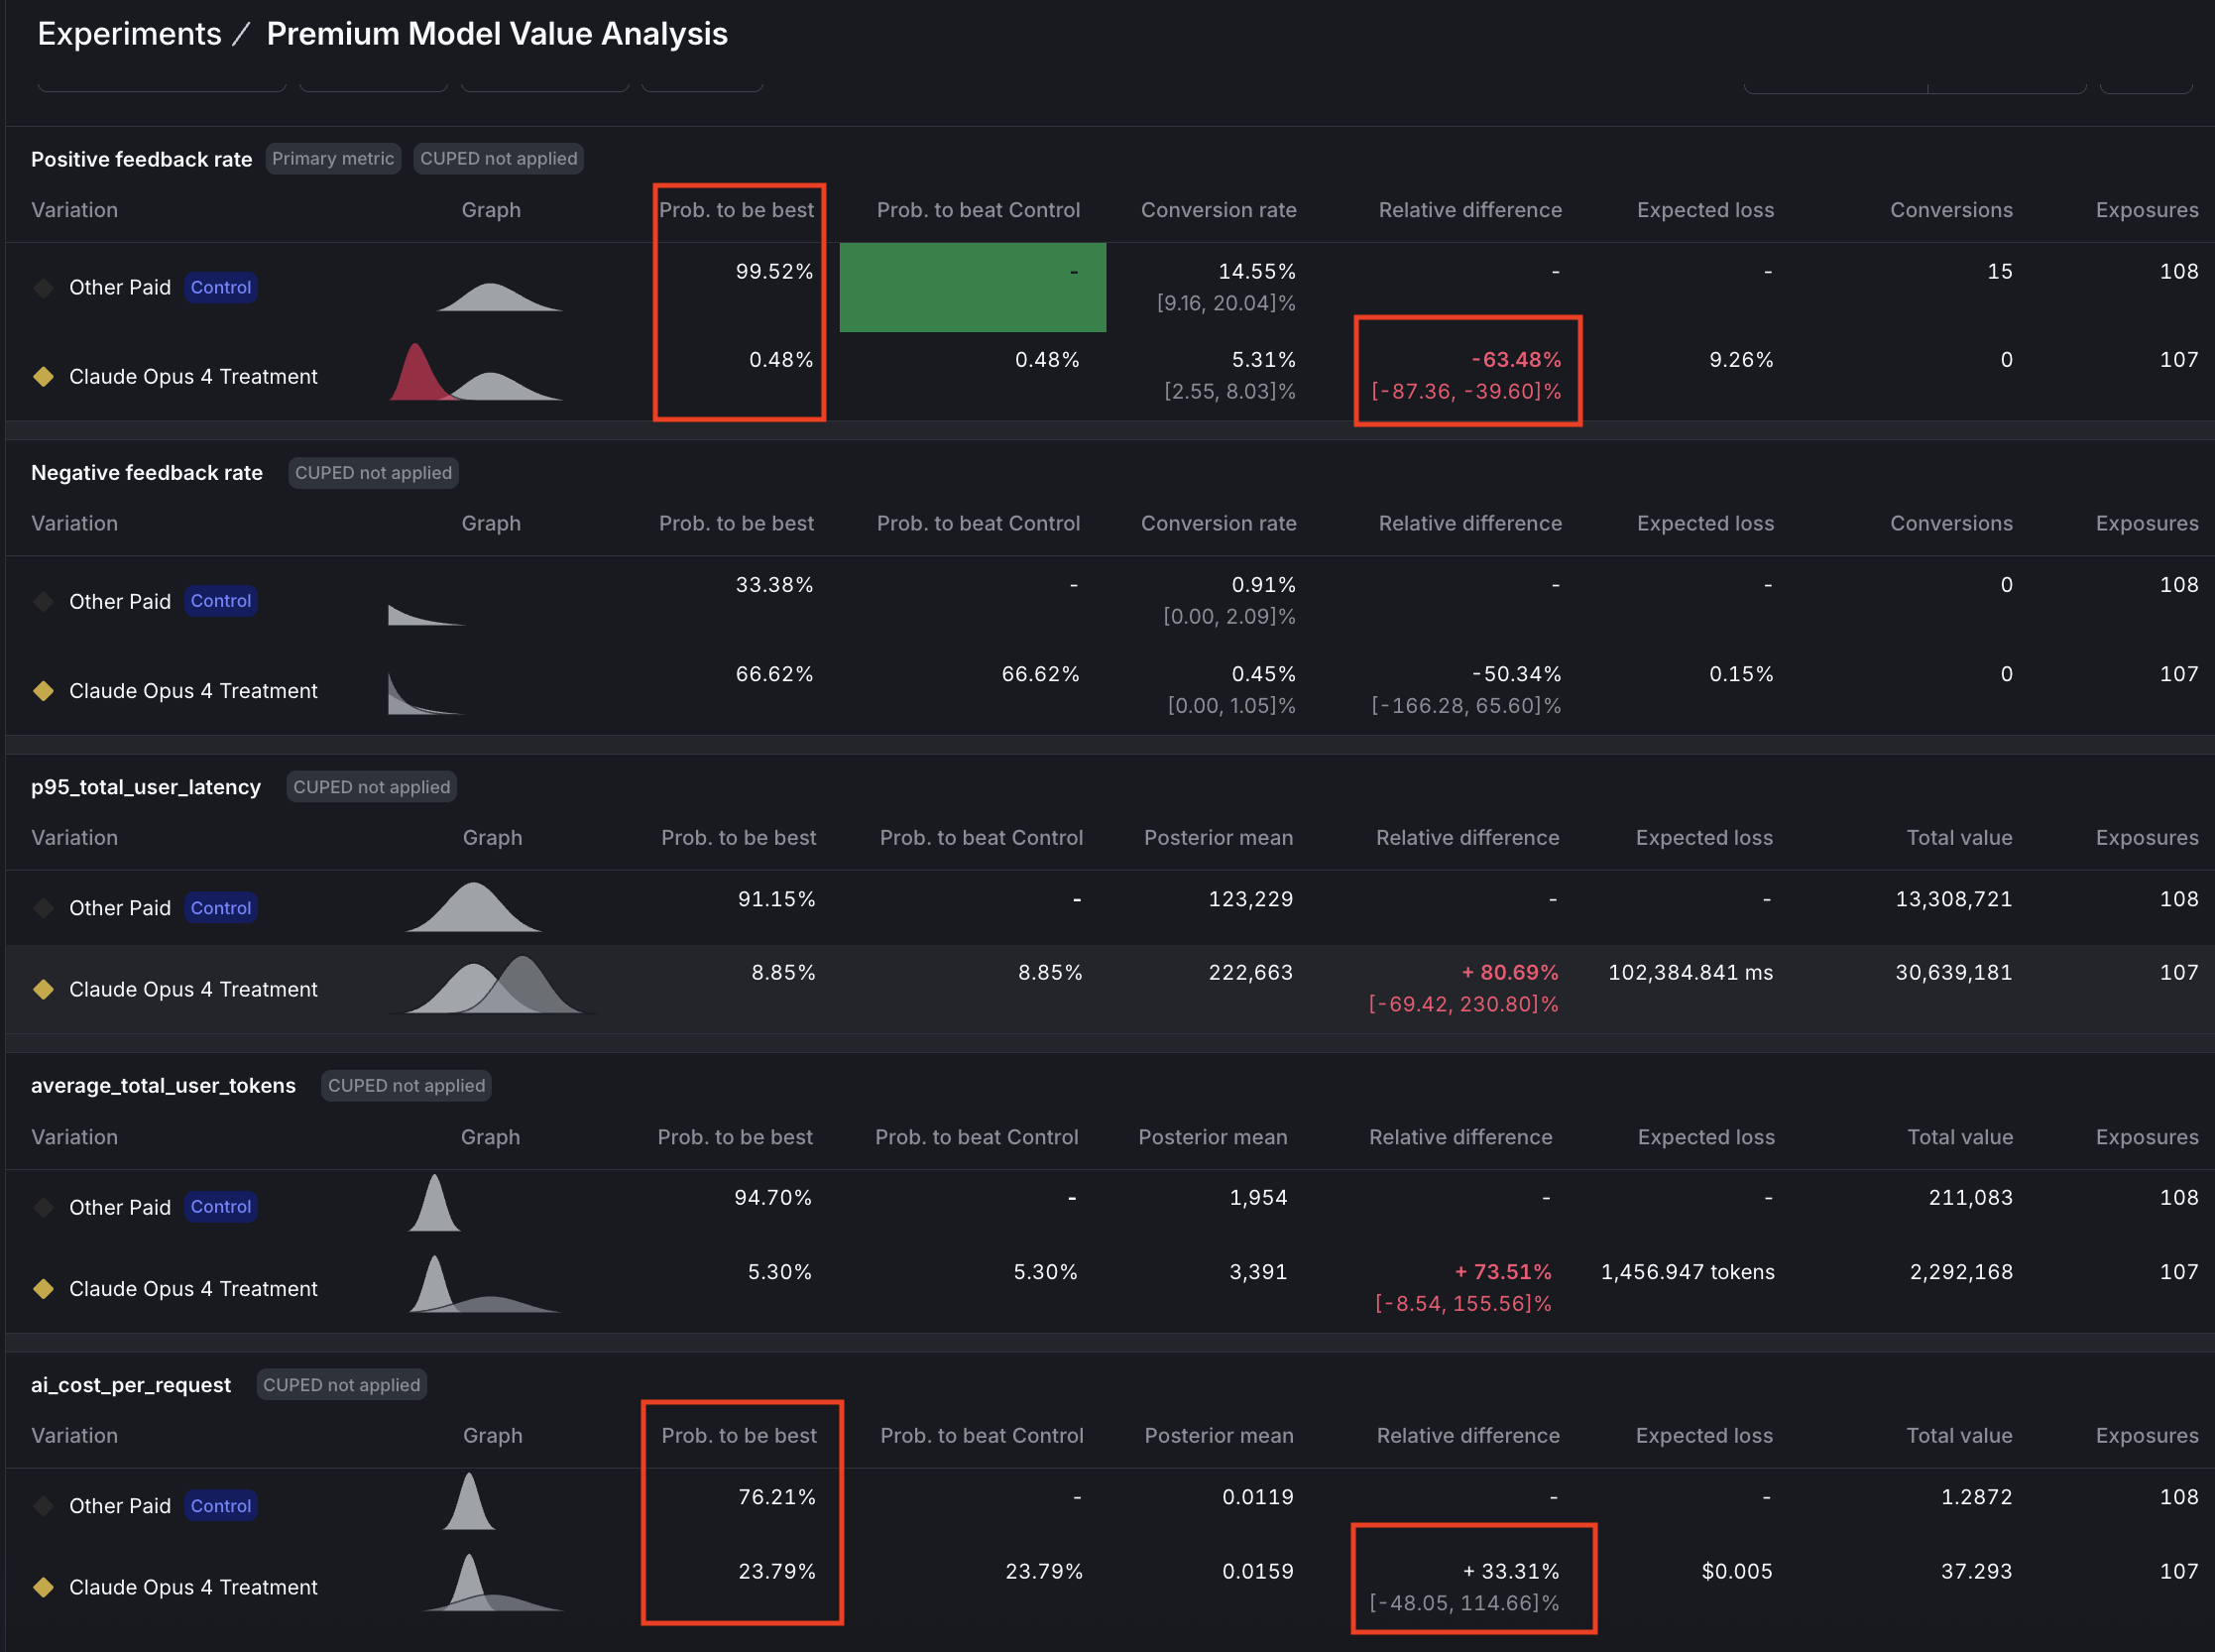
Question 2: Premium model value analysis
Question: Does Claude Opus 4 justify its premium cost with superior positive feedback rates?
Answer: Reject Claude Opus 4.
The experiment delivered a decisive verdict:
- Positive feedback rate showed a significant failure with 99.5% confidence that GPT-4o is superior.
- Cost per request is approaching significance with 76% confidence that Claude Opus is 33% more expensive, while latency (p95) reached significance with 91% confidence that Claude Opus is 81% slower.
- The cost-to-value ratio tells the whole story: -1.9x, meaning we’re paying 33% more for 64% worse performance, which is a clear case of premium pricing without premium results.
Decision logic:
Conclusion: Premium price delivered worse results on every metric. Experiment was stopped when positive feedback rate reached significance.
GPT-4o dominates on performance and speed and most likely also on cost.
Here are the results:
What we learned from our experiment data
Here’s what we learned running these experiments ourselves:
-
Low-variance metrics (latency, tokens) reach significance quickly (~1,000 samples). High-variance metrics (cost, feedback) may need 5,000-10,000+ samples. This isn’t a flaw in your experiment but the reality of statistical power. Don’t chase 90% confidence on every metric; focus on directional insights for high-variance metrics and statistical proof for low-variance ones.
-
Using a free Mistral model for security reduced that agent’s cost to $0, yet increased total system cost by 14.5 because downstream agents had to work harder with reduced context. However, the experiment also revealed an unexpected 36% latency improvement. Mistral is not just free but significantly faster. LaunchDarkly’s user-level tracking captured both effects, enabling an informed decision: enhanced privacy + faster responses for ~$0.004 more per request is a worthwhile tradeoff.
-
At 87% confidence for latency (as compared to 90% target), the 36% improvement is clear enough for decision-making. Perfect statistical significance is ideal, but 85-89% confidence combined with other positive signals (stable feedback, acceptable cost) can justify deployment when the effect size is large.
Experiment limitations
We encountered some limitations while running these experiments:
-
Model-as-judge evaluation: We use Claude to evaluate response quality rather than real users, which represents a limitation of this experimental setup. However, research shows that model-as-judge approaches correlate well with human preferences, as documented in Anthropic’s Constitutional AI paper.
-
Independent experiments: While random assignment naturally balances security versions across model versions, preventing systematic bias, you cannot analyze interaction effects between security and model choices. If interaction effects are important to your use case, consider running a proper factorial experiment design.
-
Statistical confidence: LaunchDarkly uses Bayesian statistics to calculate confidence, where 90% confidence means there’s a 90% probability the true effect is positive. This is not the same as p-value < 0.10 from frequentist tests. We set the threshold at 90%, rather than 95%, to balance false positives versus false negatives, though for mission-critical features you should consider raising the confidence threshold to 95%.
Common mistakes you have avoided
Here are common mistakes you avoided, and what you did instead:
What you’ve accomplished
You’ve built a data-driven optimization engine with statistical rigor through falsifiable hypotheses and clear success criteria. Your predefined success criteria ensure clear decisions and prevent post-hoc rationalization. Every feature investment now has quantified business impact for ROI justification, and you have a framework for continuous optimization through ongoing measurable experimentation.
Findings from our experiments include:
- Unexpected discovery: Free Mistral model is not only $0 but also significantly faster than Claude Haiku
- Cost paradox revealed: “Free” security agent increased total system costs by forcing downstream agents to compensate
- Premium model failure: Claude Opus 4 performed 64% worse than GPT-4o despite costing 33% more
- Sample size reality: High-variance metrics (cost, feedback) require 5-10x more data than low-variance ones (latency)
Troubleshooting
This section includes troubleshooting solutions.
Long response times (>20 minutes)
If you see requests taking exceptionally long, the root cause is likely the semantic_scholar MCP tool hitting API rate limits, which causes 30-second retry delays. Queries using this tool may take 5-20 minutes to complete. The 2000-second timeout handles this gracefully, but if you need faster responses (60-120 seconds typical), consider removing semantic_scholar from tool configurations. You can verify this issue by checking logs for HTTP/1.1 429 errors indicating rate limiting.
Cost metrics not appearing
If ai_cost_per_request events aren’t showing in LaunchDarkly, first verify that utils/cost_calculator.py has pricing configured for your models. Cost is only tracked when requests complete successfully (not on timeout or error). The system flushes cost events to LaunchDarkly immediately after each request completion. To debug, look for COST CALCULATED: and COST TRACKING (async): messages in your API logs.
Beyond this tutorial: Advanced AI Experimentation patterns
In this guide you ran two experiments:
- Security‑agent test: a bundle change, where both prompt/instructions and the model changed.
- Premium‑model test: a model‑only change.
AgentControl configs support two modes: prompt‑based (single‑step completions) and agent‑based (multi‑step workflows with tools). Below are additional patterns to explore.
AgentControl config experiments
Experiments you can run entirely in AgentControl configs with no app redeploy include:
-
Prompt and template experiments (prompt‑based or agent instructions): Duplicate a variation and iterate on system/assistant messages or agent instructions to measure adherence to schema, tone, or qualitative satisfaction. Use LaunchDarkly Experimentation to tie those variations to product metrics.
-
Model‑parameter experiments: In a single model, vary parameters like
temperatureormax_tokens, and optionally add custom parameters you define, for example, an internalmax_tool_callsor decoding setting, directly on the variation. -
Tool‑bundle experiments (agent mode or tool‑enabled completions): Attach/detach reusable tools from the Tools Library to compare stacks, such as
search_v2, a reranker, or MCP‑exposed research tools, across segments. Keep one variable at a time when possible -
Cost/latency trade‑offs: Compare “slim” versus “premium” stacks by segment. Track tokens, time‑to‑first‑token, duration, and satisfaction to decide where higher spend is warranted.
Recommendations include:
- Use Experimentation for behavior impact (clicks, task success). Use the Monitoring tab for LLM‑level metrics (tokens, latency, errors, satisfaction).
- You can’t run a guarded rollout and an experiment on the same flag at the same time. Pick one: guarded rollout for risk‑managed releases, experiment for causal measurement.
Feature flag experiments
Experiments you can run with feature flags include:
-
Fine‑grained RAG tuning: k‑values, similarity thresholds, chunking, reranker swaps, and cache policy are typically coded inside your retrieval layer. Expose these as flags or custom parameters on your AgentControl configs if you want to A/B test them.
-
Tool‑routing guardrails: Fallback flows (for example, retry with a different tool/model on error), escalation rules, or heuristics need logic in your agent/orchestrator. Gate those behaviors behind flags and measure with custom metrics.
-
Safety guardrail calibration: Moderation thresholds, red‑team prompts, and PII sensitivity levers belong in a dedicated safety service, for example, enterprise as compared to free.
-
Session budget enforcement: Monitoring will show token costs and usage, but enforcing per‑session or per‑org budgets (denylist, degrade model, or stop‑tooling) requires application logic. Wrap policies in flags before you experiment.
Targeting and segmentation ideas
These ideas work with all of the experiment suggestions we listed above:
- Target by plan tier, geographic zone, device, or organization using config targeting rules and percentage rollouts.
- Keep variations narrow, one change per experiment, to avoid confounding. Reserve “bundle” tests for tool‑stack comparisons.
Require statistical evidence before shipping configuration changes. Pair each variation with clear success metrics, then A/B test prompt or tool adjustments and use confidence intervals to confirm improvements. When you introduce the new code paths above, protect them behind feature flags so you can run sequential tests, multi-armed bandits for faster convergence, or change your experiment design to understand how prompts, tools, and safety levers interact.
Conclusion: From chaos to clarity
Across this three-part series, you’ve transformed from hardcoded AI configurations to a scientifically rigorous, data-driven optimization engine. Part 1 established your foundation with a dynamic multi-agent LangGraph system controlled by LaunchDarkly AgentControl, eliminating the need for code deployments when adjusting AI behavior. Part 2 added sophisticated targeting with geographic privacy rules, user segmentation by plan tiers, and MCP (Model Context Protocol) tool integration for real academic research capabilities. This tutorial, Part 3, completed your journey with statistical experimentation that proves ROI and guides optimization decisions with mathematical confidence rather than intuition.
You now possess a defensible AI system that adapts to changing requirements, scales across user segments, and continuously improves through measured experimentation. Your stakeholders receive concrete evidence for AI investments, your engineering team deploys features with statistical backing, and your users benefit from optimized experiences driven by real data rather than assumptions. The chaos of ad-hoc AI development has given way to clarity through systematic, scientific product development.
Related tutorials
- Build a LangGraph Multi-Agent system in 20 Minutes - Part 1 of this series: build the agent system that the experiments here measure
- Smart AI Agent Targeting with MCP Tools - Part 2: add user, geo, and tier targeting before experimenting on it
- Beyond n8n for Workflow Automation: Agent Graphs - Externalize the multi-agent topology with visual graph builder and per-node metrics
- When to add online evals - Surface the metrics experiments measure with judge-based scoring on live traffic
- Offline Evaluation of RAG-Grounded Answers - Lock in an offline baseline before running A/B tests
- Evaluate LLM code generation with LLM-as-judge evaluators - Build custom judges to produce the quality metrics your experiments compare