

The Setup
To test session replay against a realistic web application, we created two applications that go hand in hand: A simple React application and a Node.JS application which automates and profiles interactions. The React application accepts URL parameters which determine the number of elements to render in a list, with an optional parameter to enable session replay. When enabled, we would start recording using rrweb (the open source library used by several companies, LaunchDarkly included).- To measure interaction duration, we tracked time from insert beginning to end via the
window.performance.now()API. This metric shows how long it takes the web app to make a change in the UI. We want this value low to keep the rendering looking smooth. - To measure heap memory usage, we used puppeteer’s performance API which tracks the heap usage of the underlying chromium process.
- To measure CPU usage, we compared active computation time vs. total time to have an estimate of JS loop execution. A large amount of time spent in active computation would mean that not much is available towards other important JS execution, which could result in frame drop and render stutter.
Results
Test 1
In this test, there were 250 additions to a list, with an addition of 100 items each. On average, using session replay added 0.017 seconds to the time taken for each addition. Despite this, the INP remains much less than 200 ms, demonstrating that session replay maintains “snappiness” on a regular web application. As more elements are added, the memory consumption difference with session replay increases. On average, there is a 6 MB increase in memory usage when using session replay. Session replay tools often optimize the memory usage. For example, LaunchDarkly buffers a short interval of events in memory before sending them to a web worker. The web worker offloads serialization and compression of the payload to avoid blocking the main javascript thread with the compute-intensive operations. For the CPU usage, we compared the active times for enabled/disabled session replay against the total time of the enabled session replay run. For a given time, we wanted to see how more the CPU is active for each run. In this test, enabling session replay yielded an average increase of 21% more usage of the total time.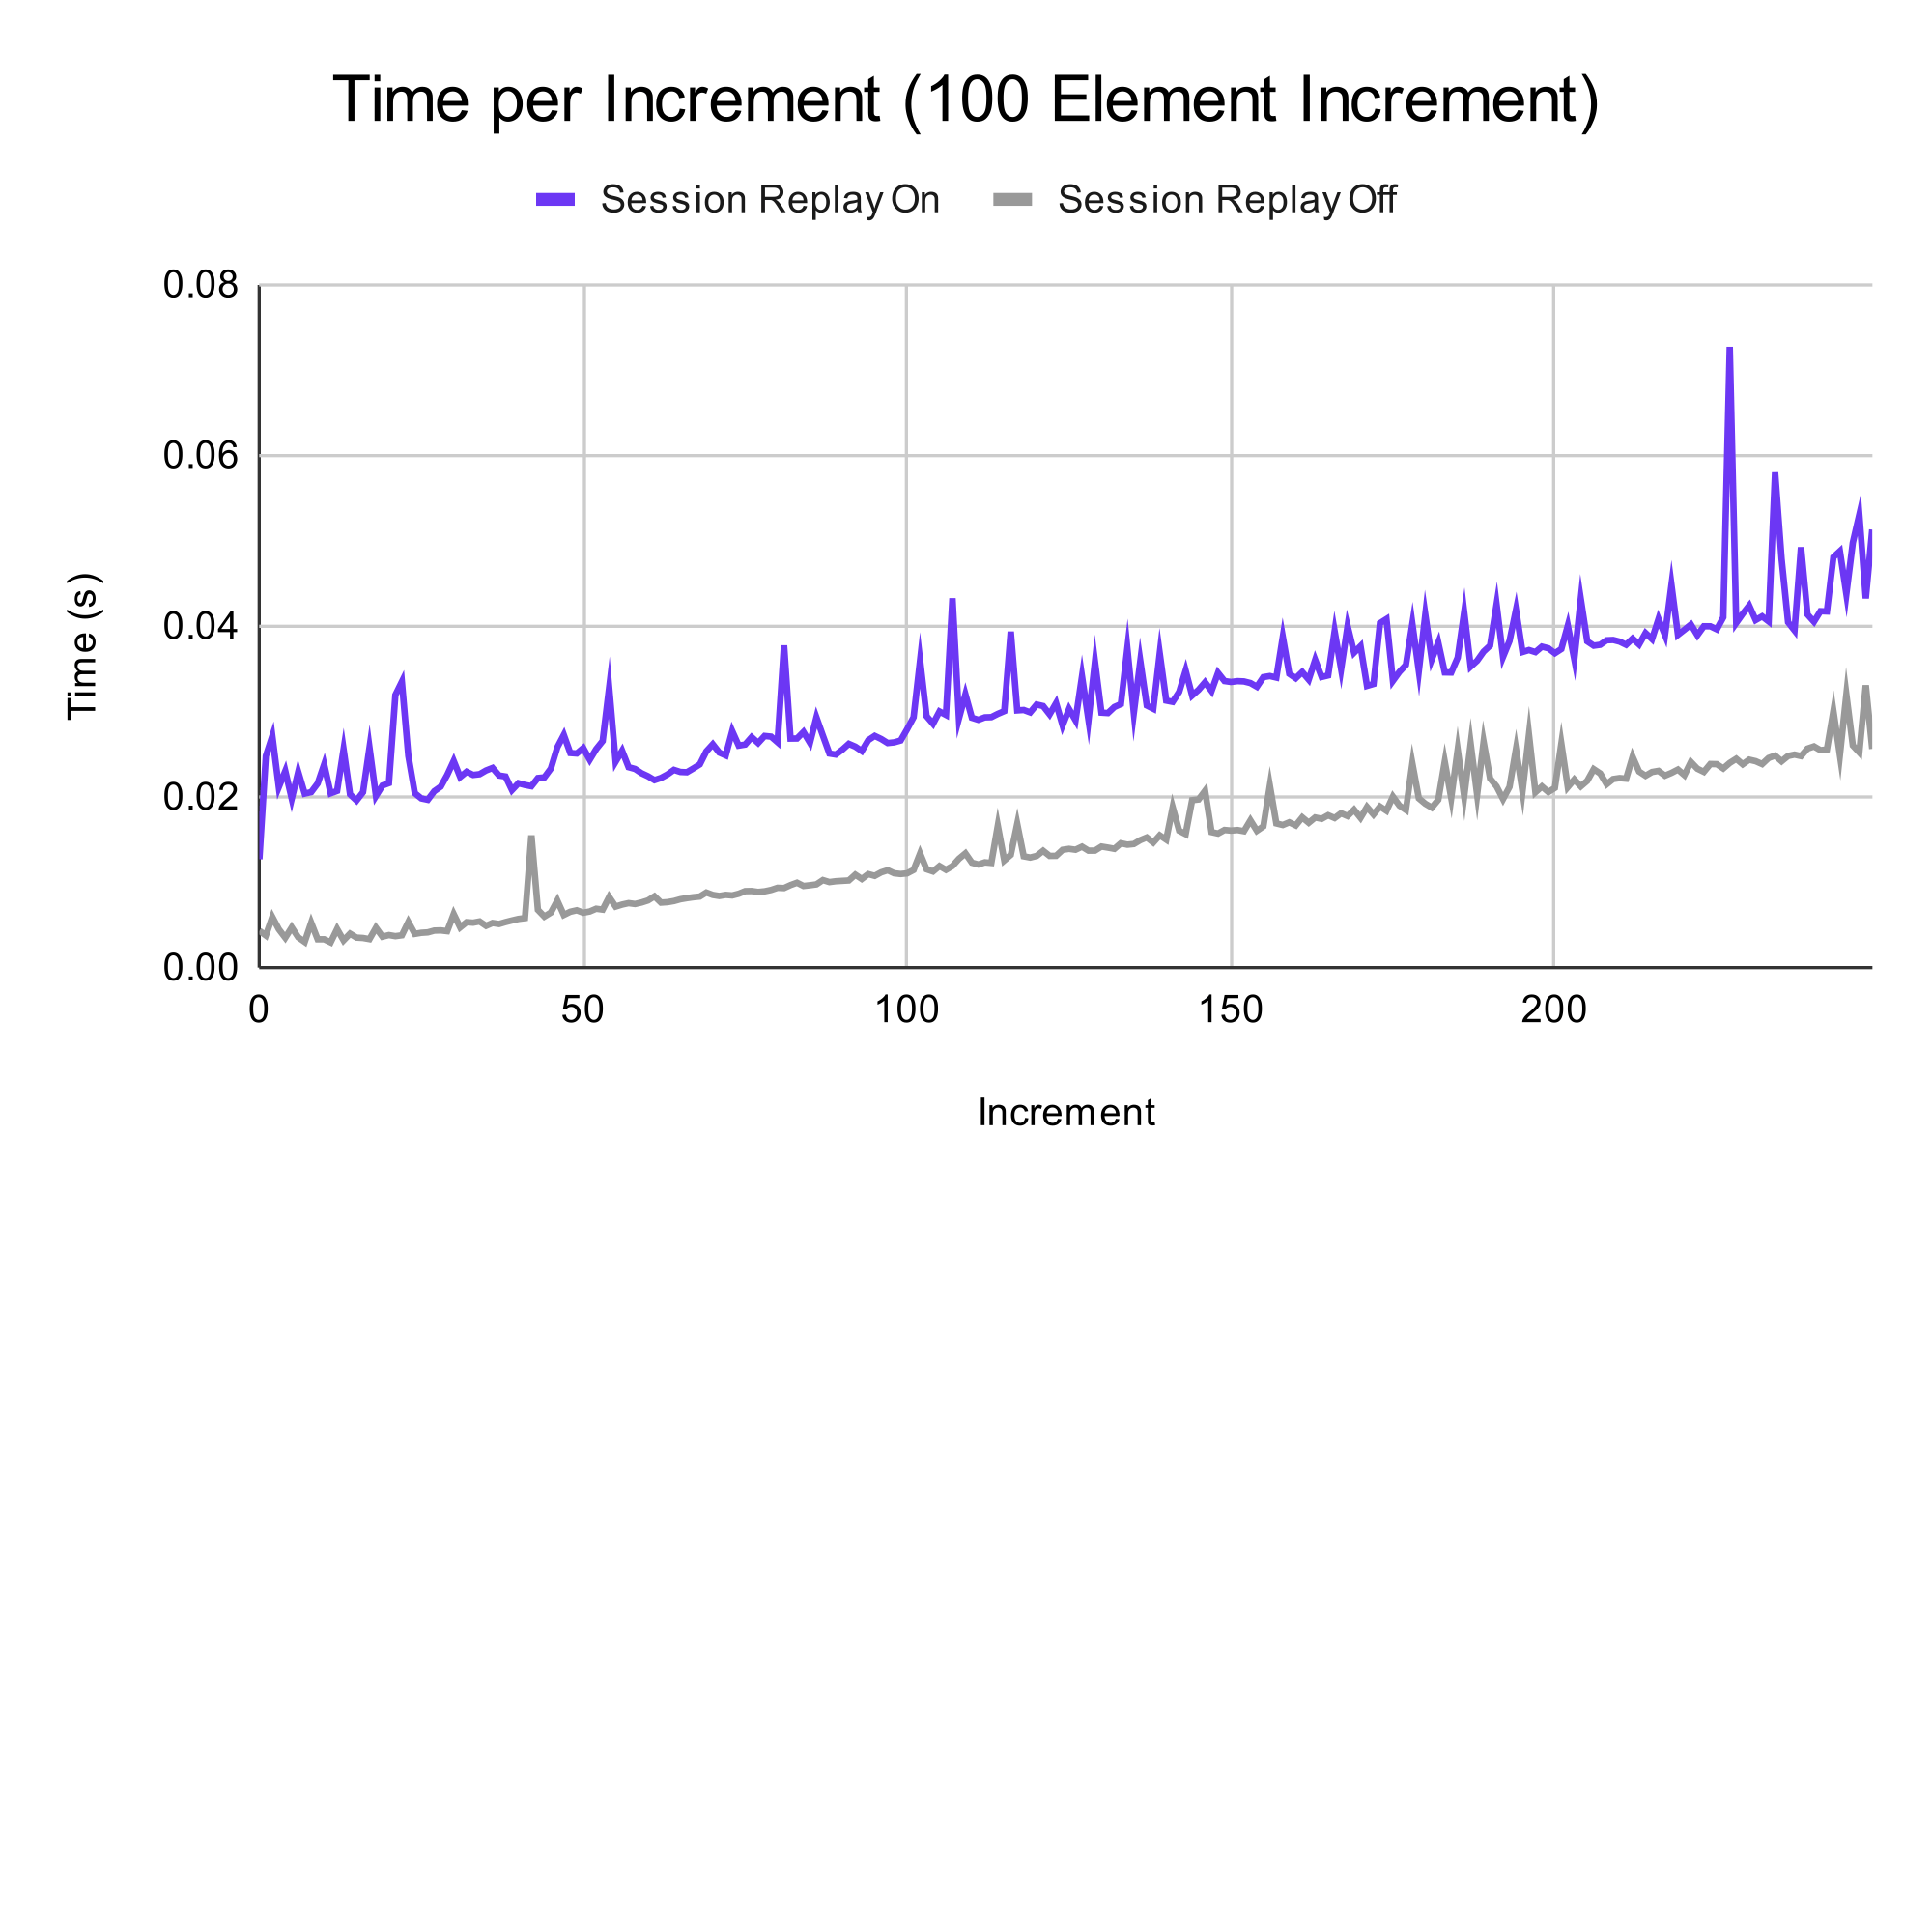
Chart comparing interaction duration with and without session replay for 100-item additions.
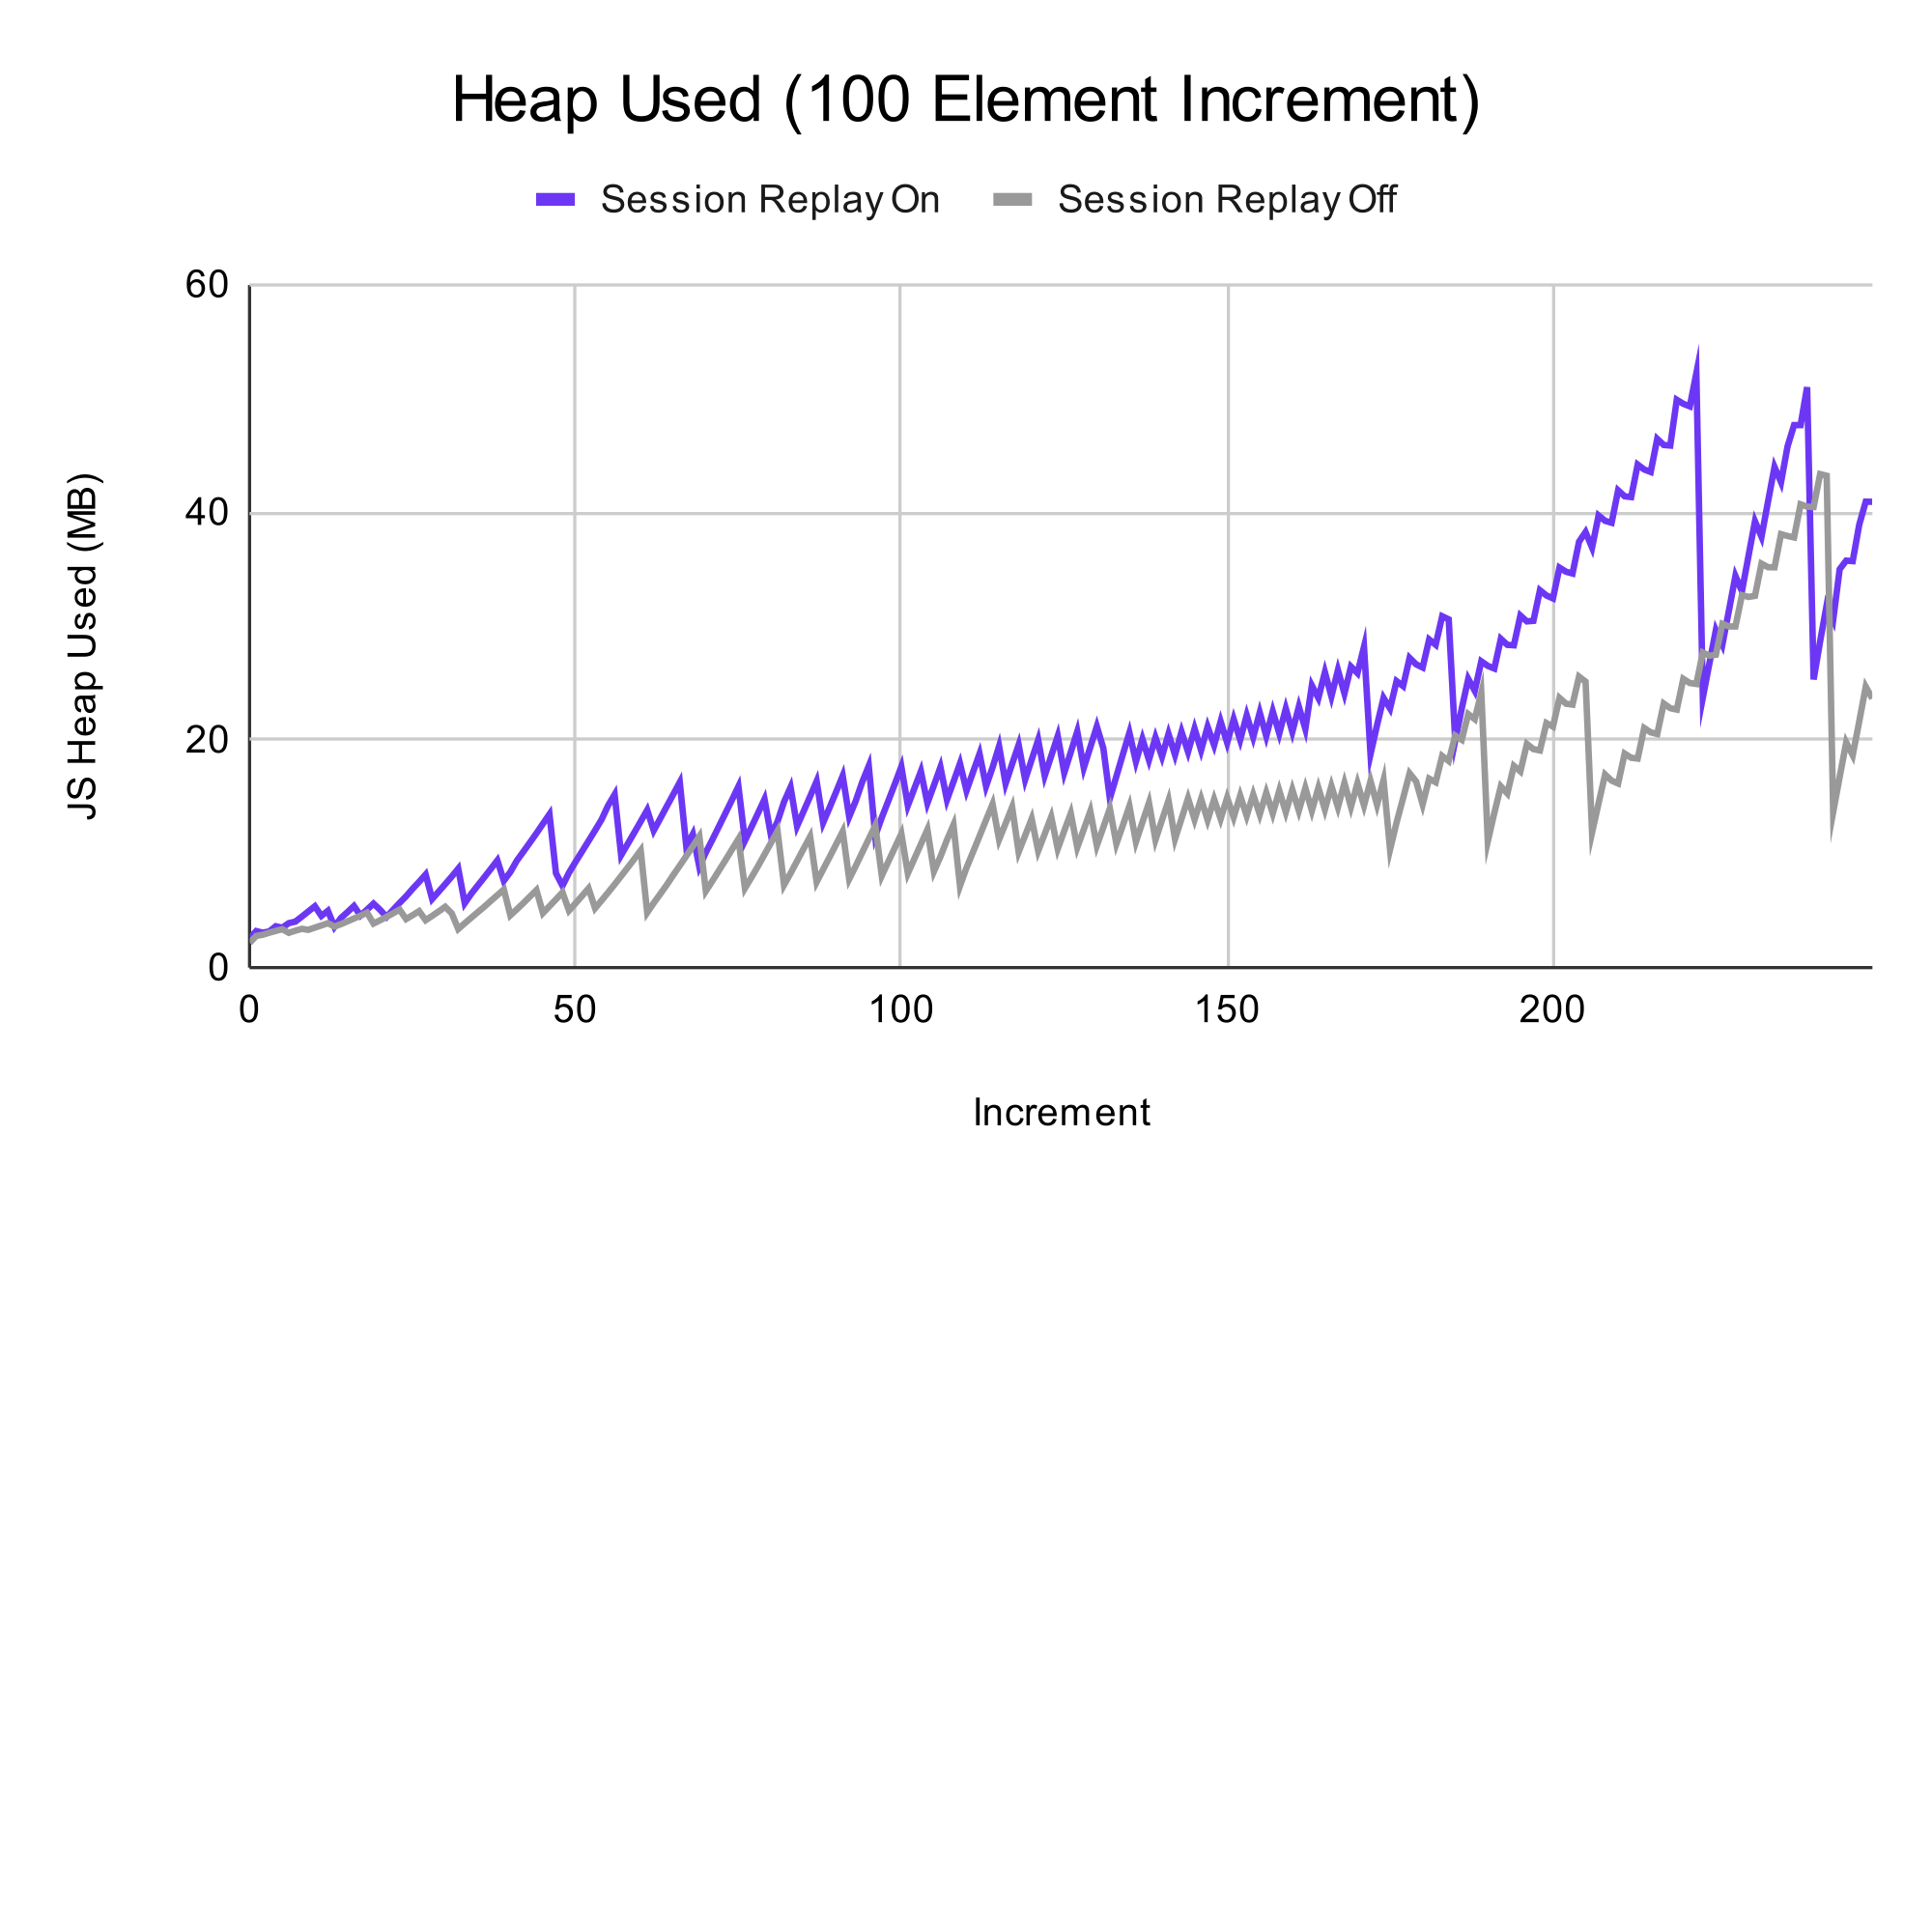
Chart comparing heap memory usage with and without session replay for 100-item additions.
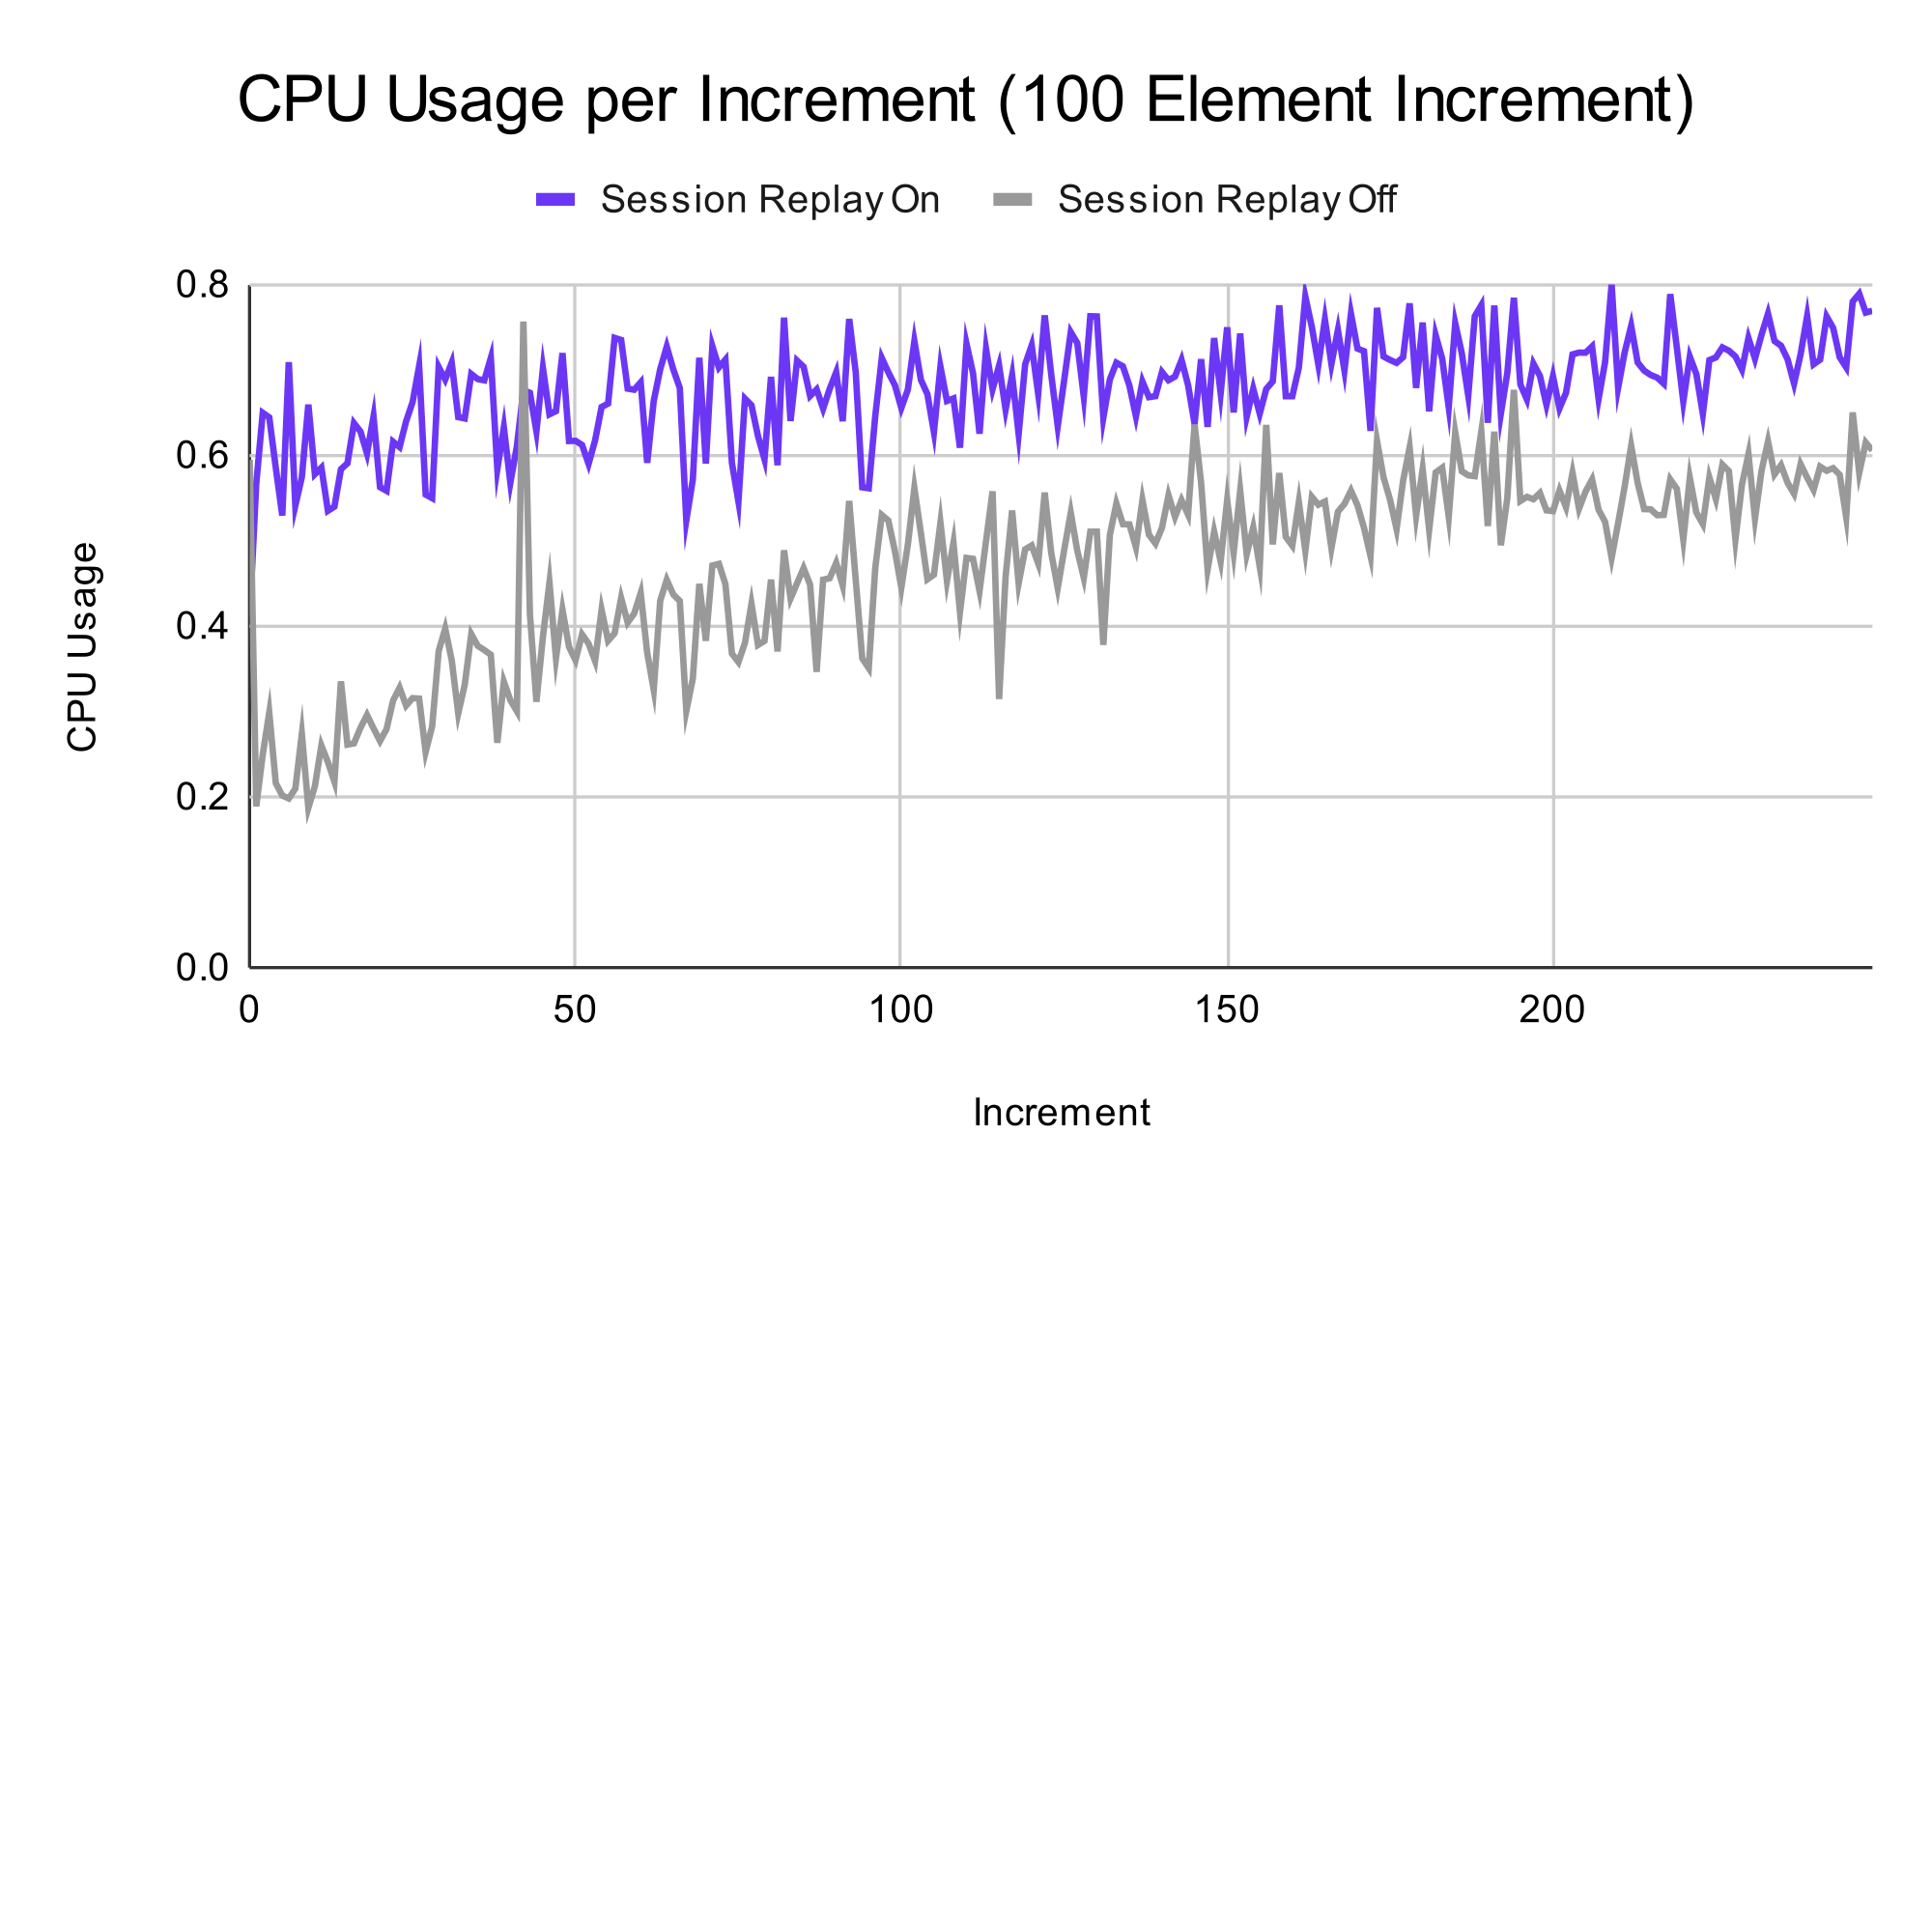
Chart comparing CPU usage with and without session replay for 100-item additions.
Test 2
In this test, there were 250 additions to a list, with an addition of 500 items each. On average, using session replay added 0.07 seconds to the time taken for each addition. Utilizing the 200 ms cutoff from before, we can see that enabling session replay maintains responsiveness until the 200th addition. More importantly, we can confirm that enabling session replay increases the duration of a task by a small constant amount. For this test, the addition is only 3.5% of the responsiveness window of 200 ms. On average, there is a 60 MB increase in memory usage when using session replay, and for the CPU usage, enabling session replay yielded an average increase of 25% more usage of the total time. Again, these numbers are not necessarily negative and they could have different effects on various hardware.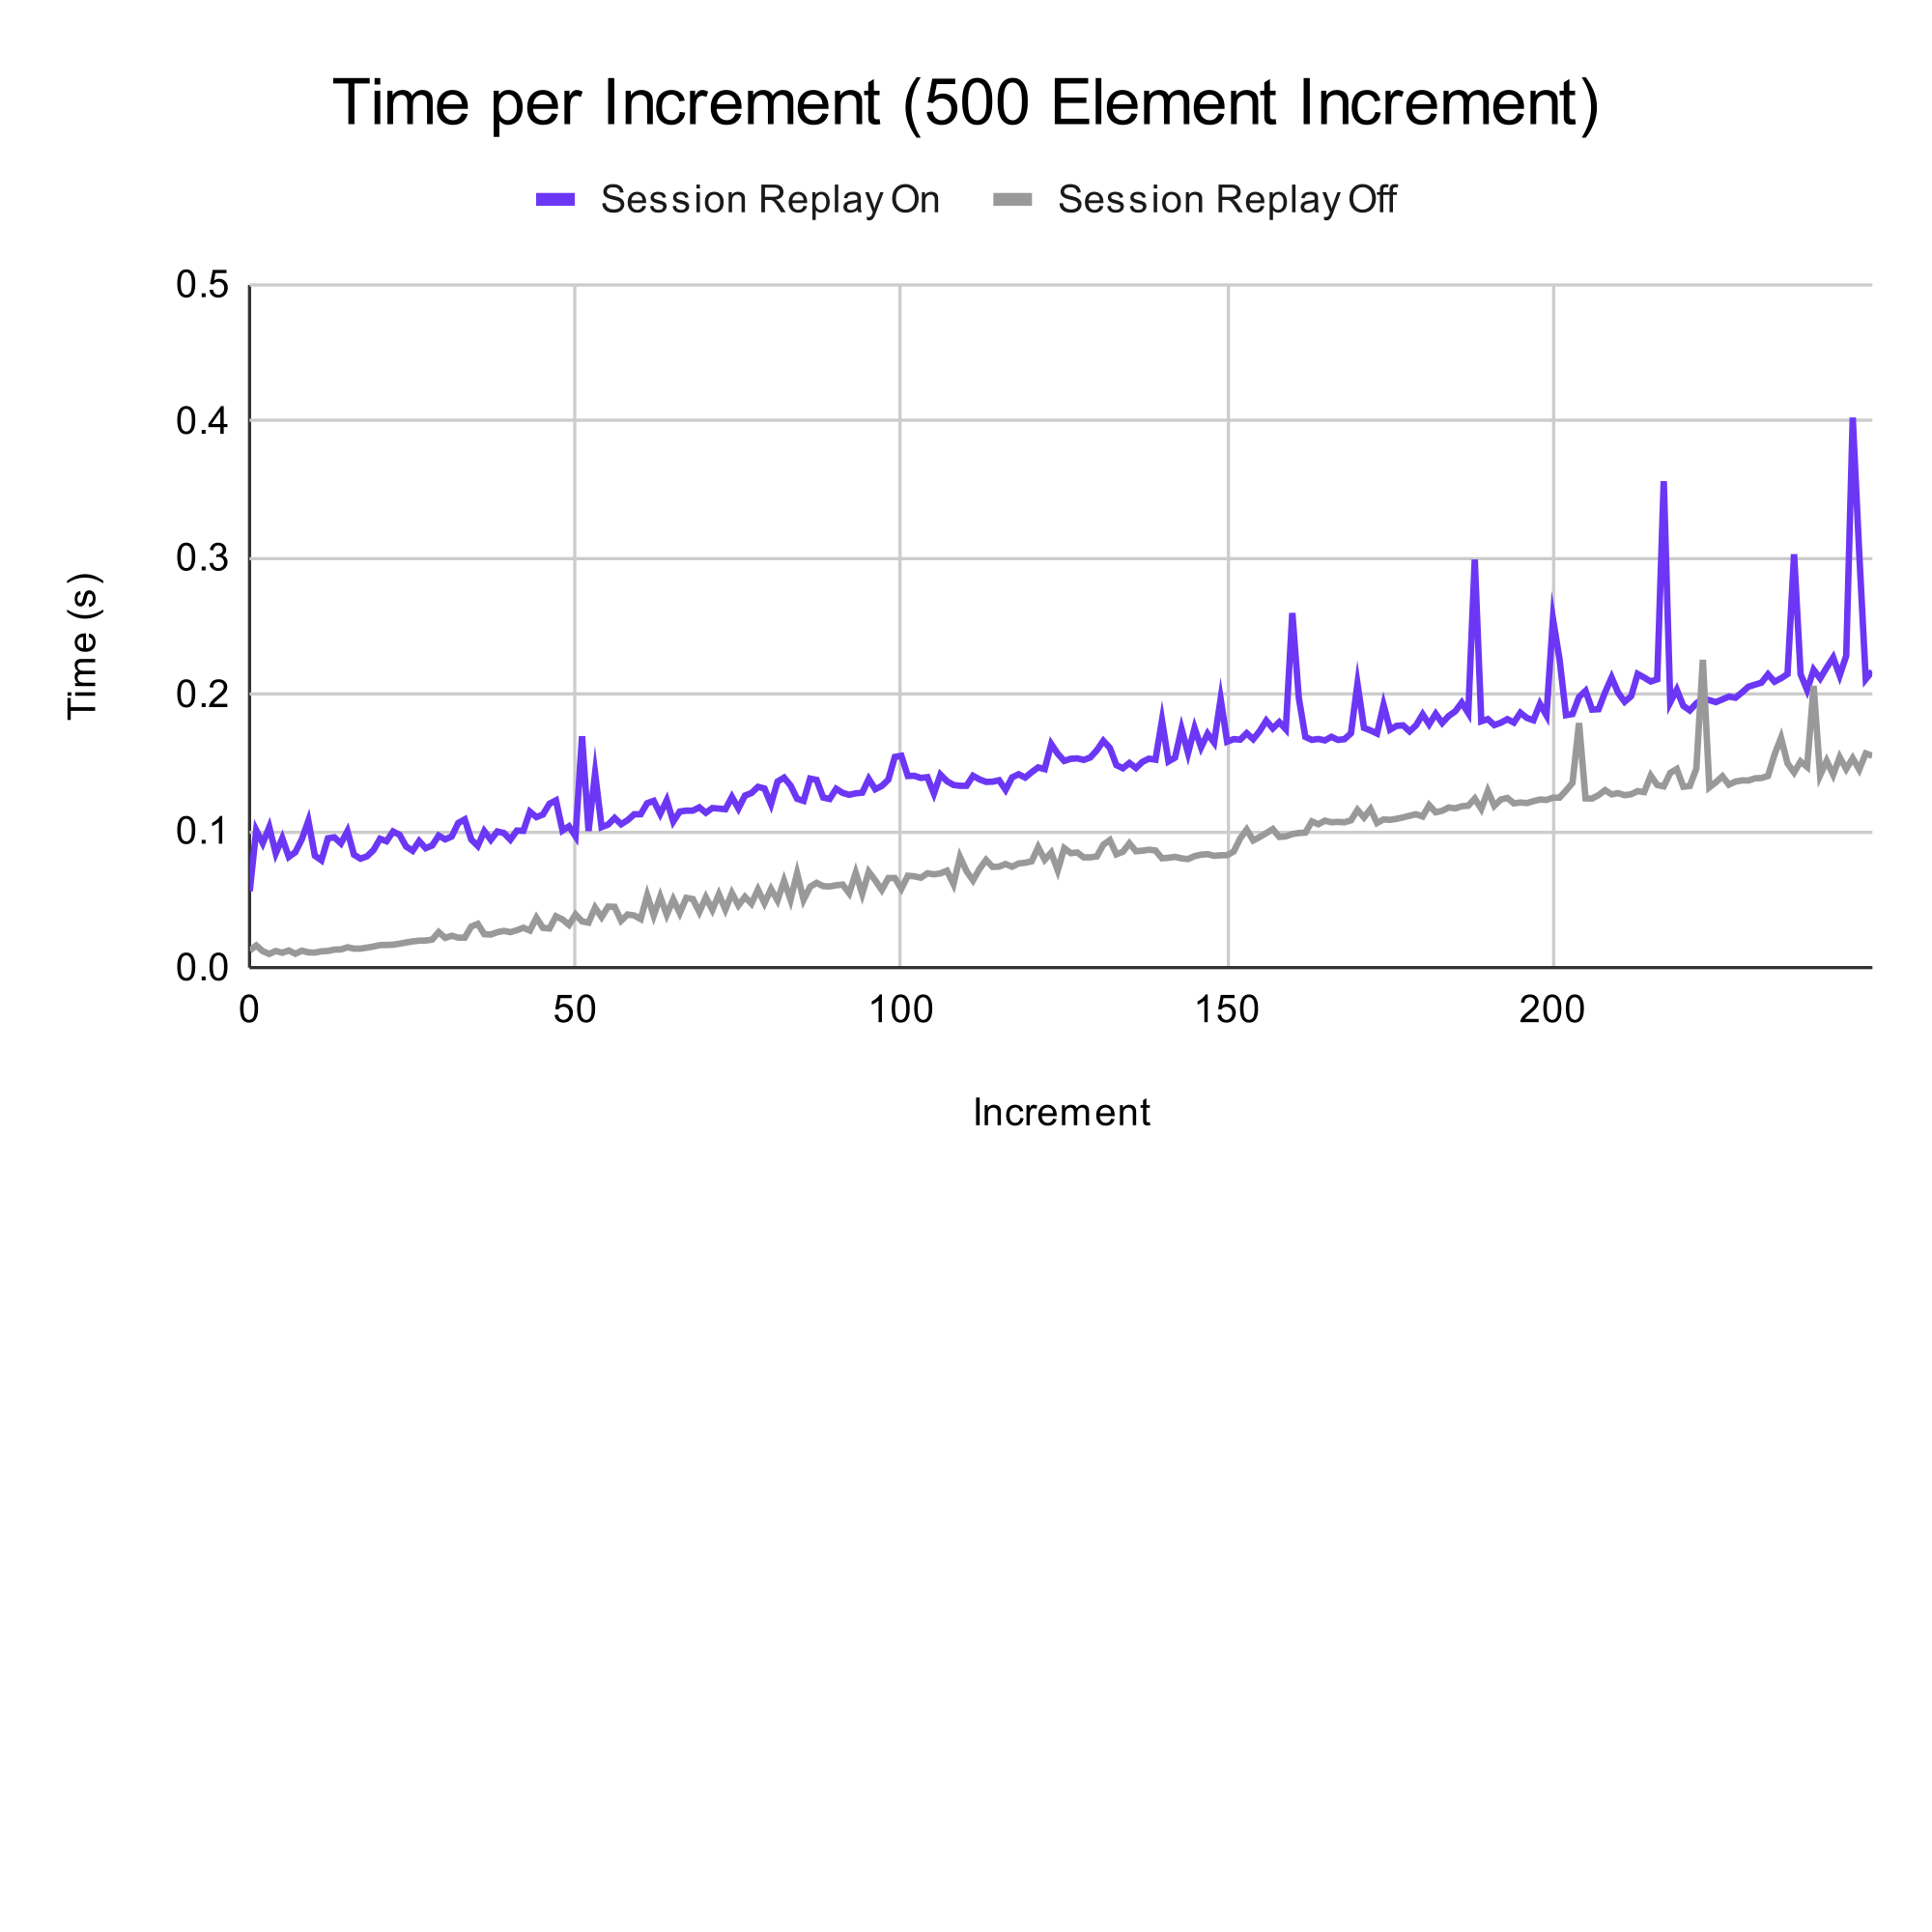
Chart comparing interaction duration with and without session replay for 500-item additions.
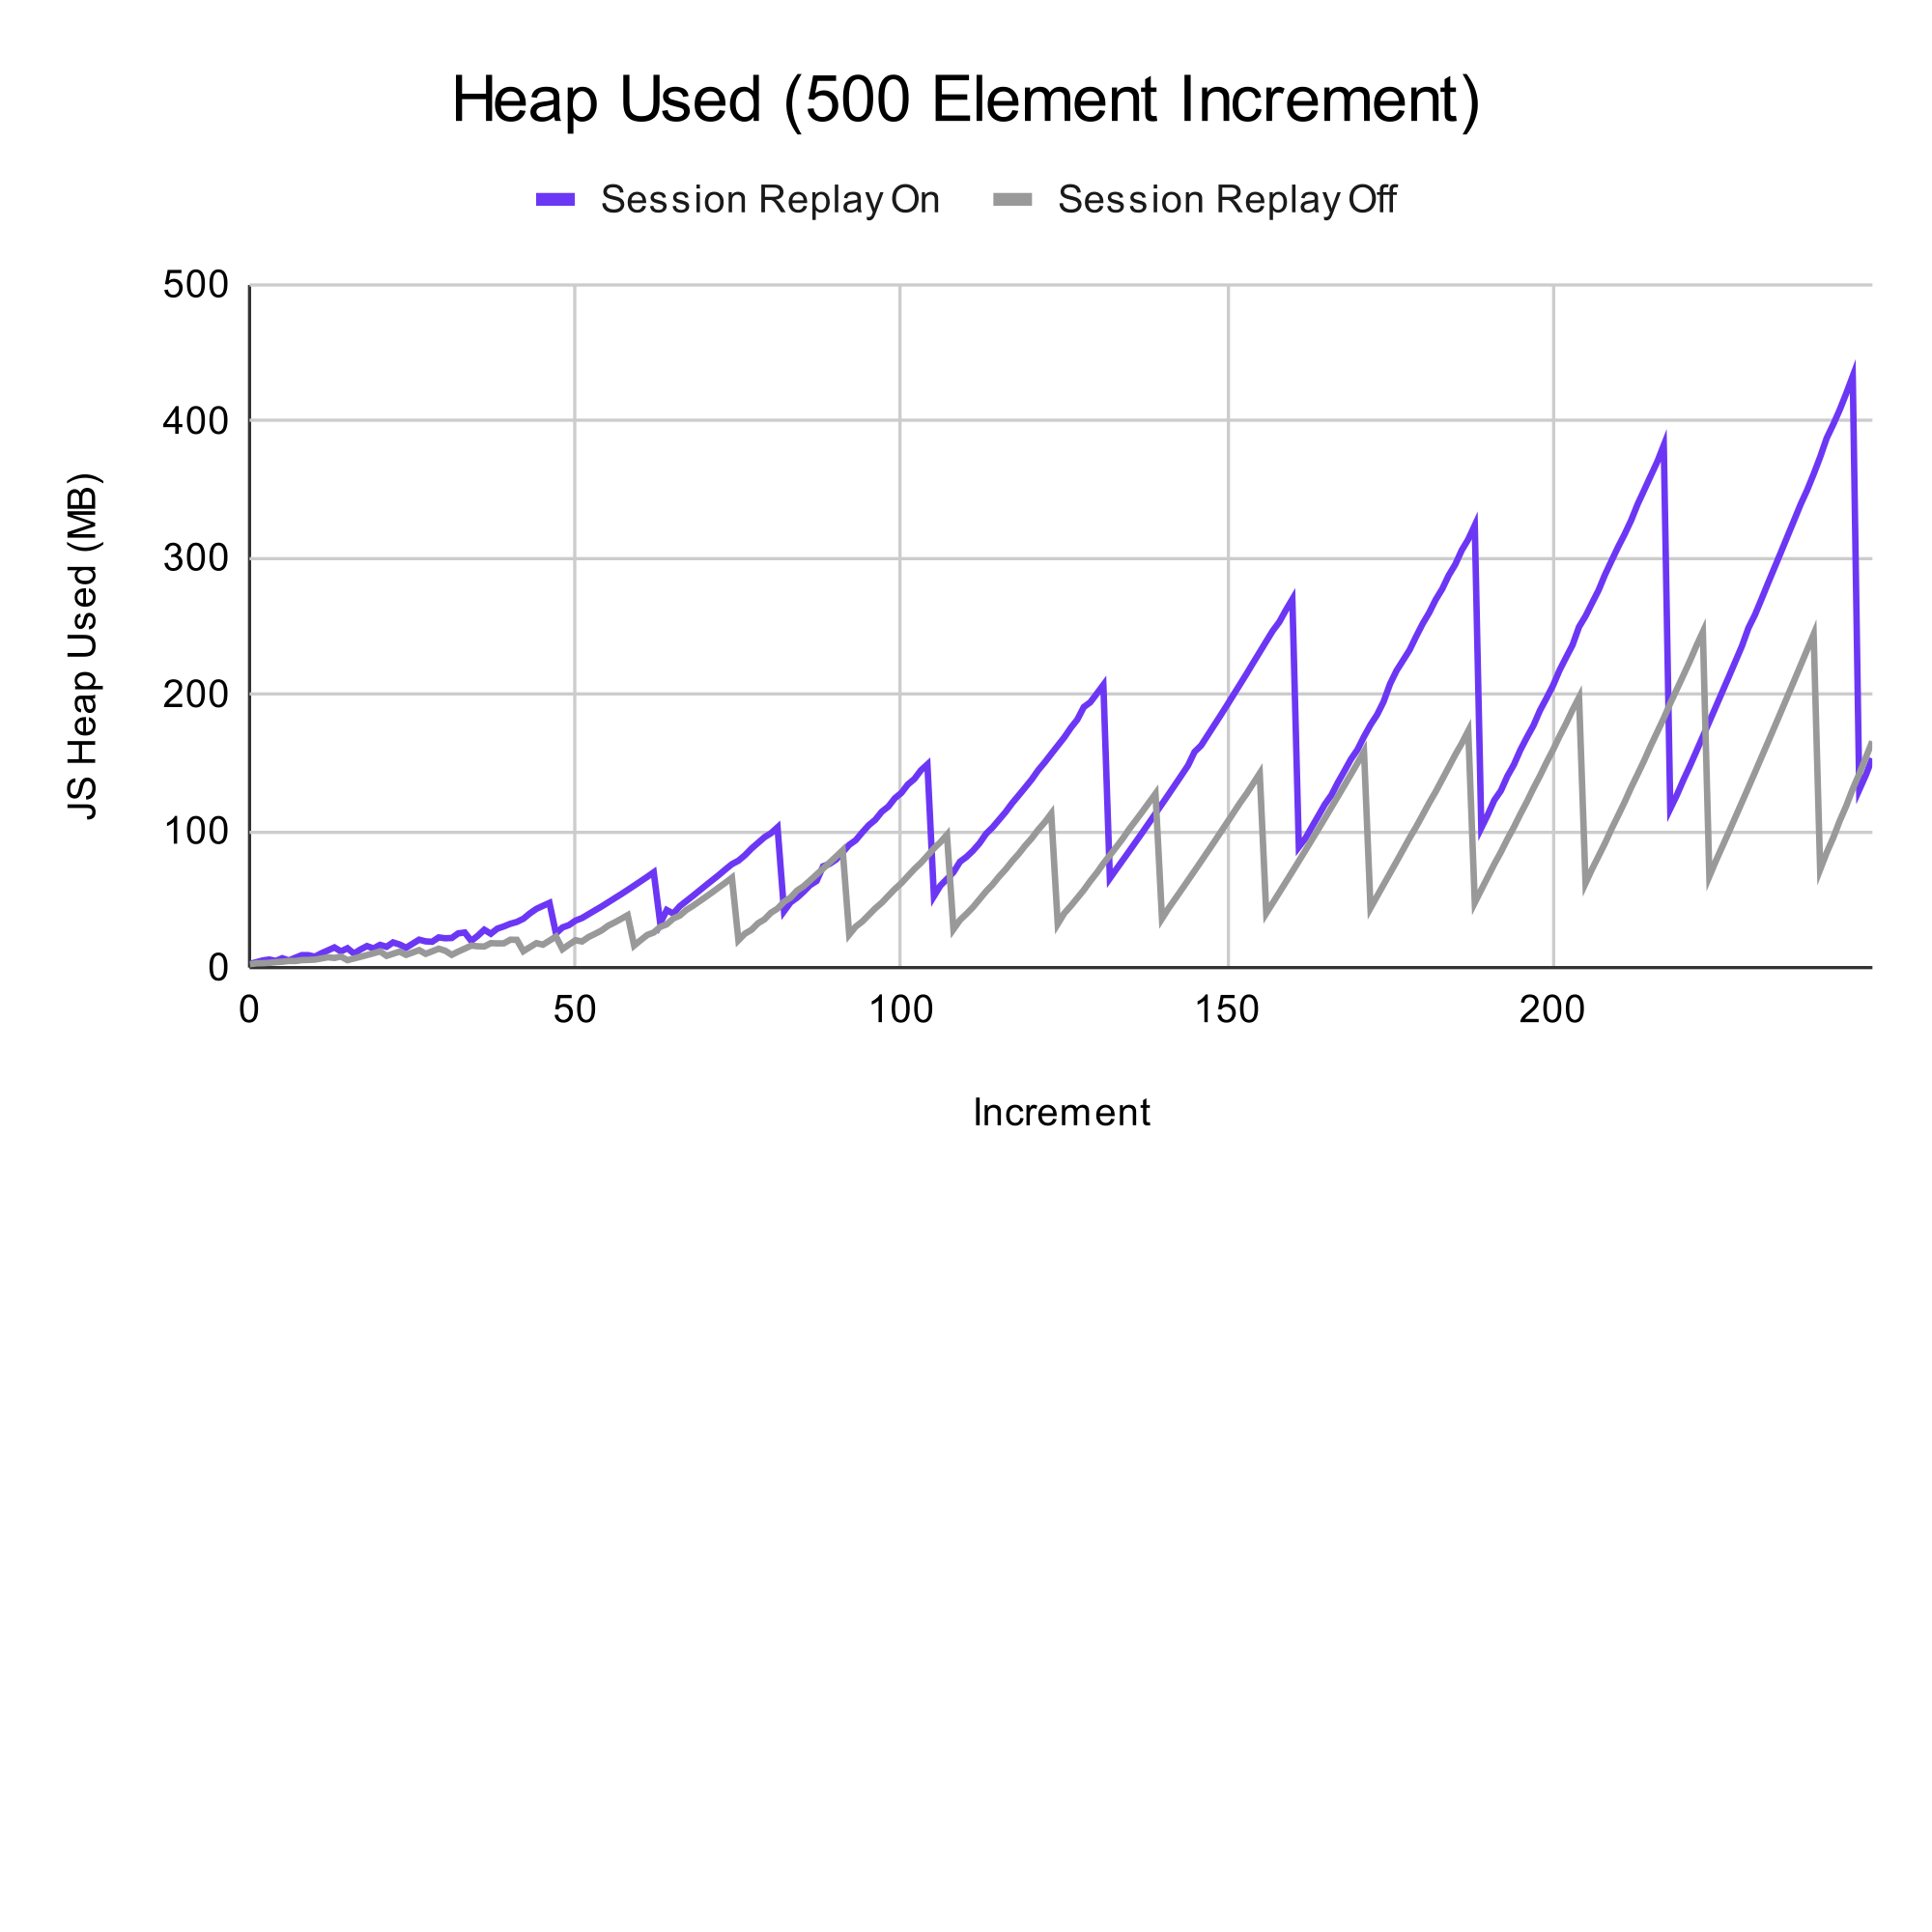
Chart comparing heap memory usage with and without session replay for 500-item additions.
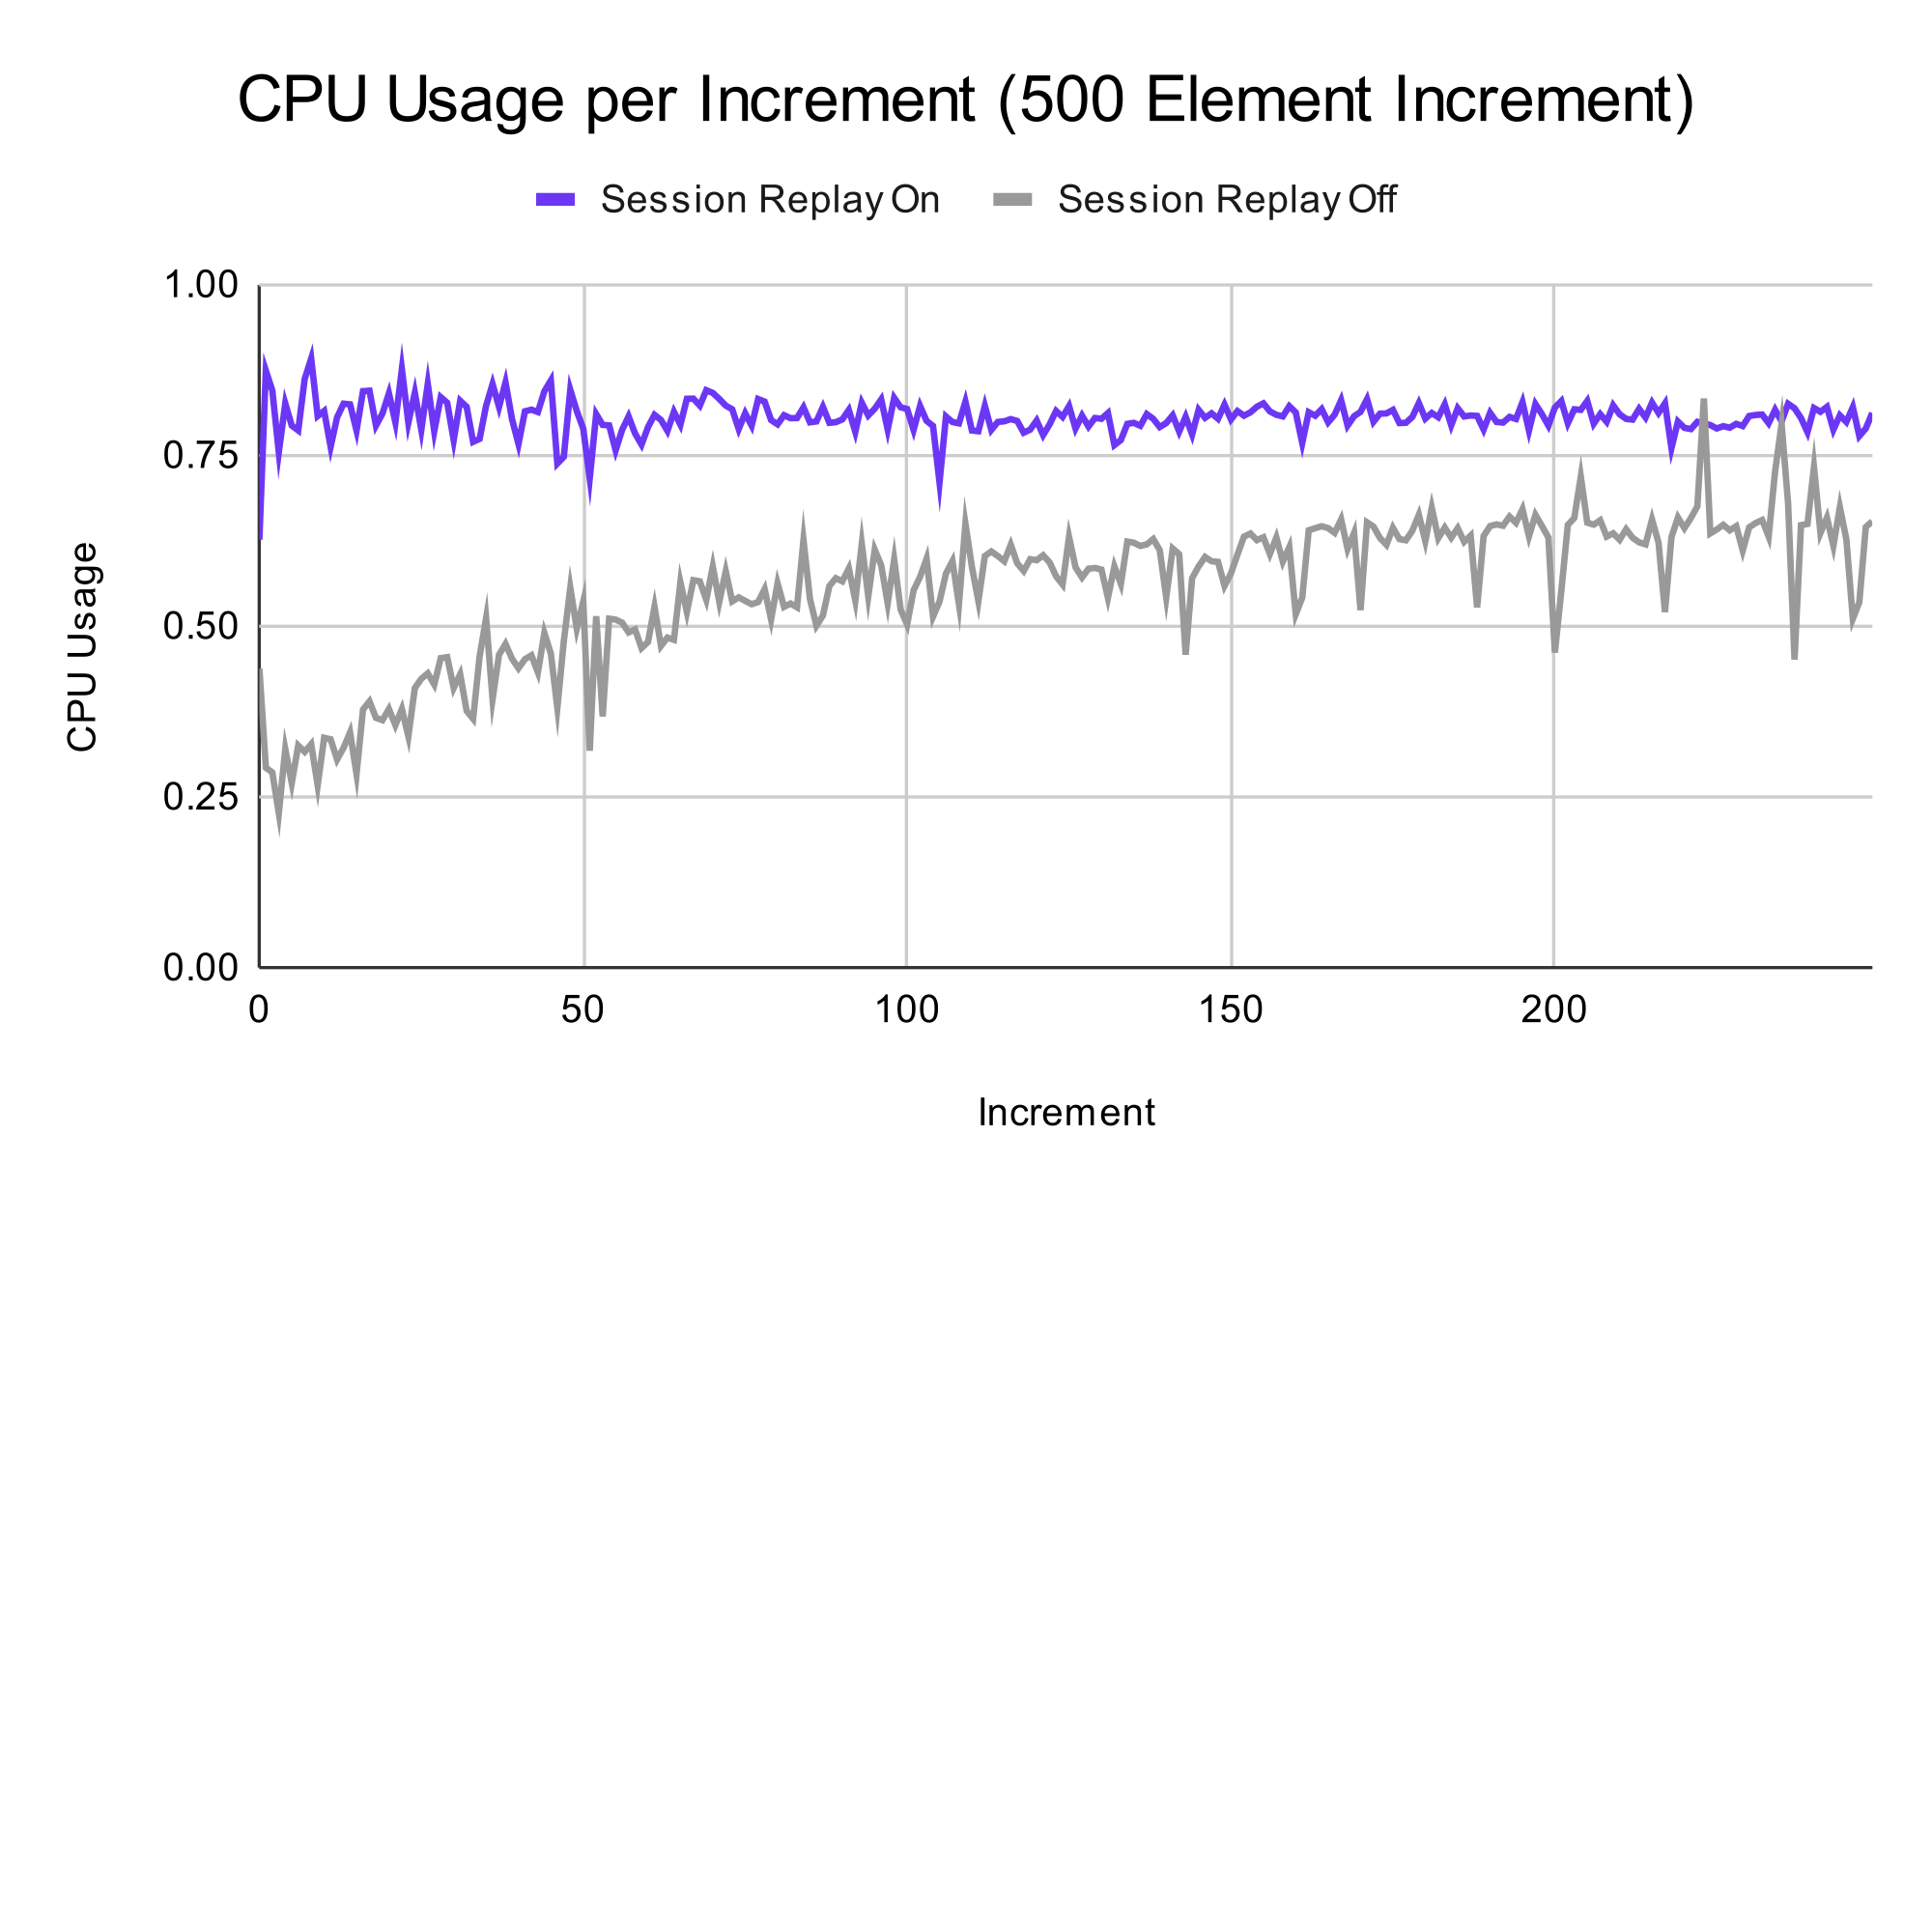
Chart comparing CPU usage with and without session replay for 500-item additions.