Dungeons & Downtimes: XP gained from our adventure
Dungeons & Downtimes: XP gained from our adventure
Published October 16th, 2025

*It was a peaceful Friday night / Saturday morning. Your laptop long tucked away in your bag, and you [probably, hopefully] tucked away in bed. It is currently 3 AM local time - yes, even for you folks on the East Coast, somehow.
Your phone starts ringing. Will you actually wake up? Roll for initiative.*
TL;DR: Play this with your team! Discover gaps as you role-play through the scenario, and then have a follow-up session to address questions in-depth.
- Double-check your Pagerduty setup
- Go through how to debug issues
- Have fun!
Rolling dice
For most of us on the Metrics team, this was the first time we were on-call after hours at LaunchDarkly. Some of us are frontend engineers and haven’t debugged backend issues before, and some of us are backend engineers that haven’t debugged frontend issues before. So to prepare ourselves, we role-played a mock incident in the style of Dungeons and Dragons tabletop.

The players
Primary On-Call
- Anthony
- Hakan
- Zakk * See below for the twist
Secondary On-Call
- Baslyos
- Liz
Incident Manager:
- Tiffany
Dungeon Master:
- Will
Playing the Game
The scenario starts off with everyone sleeping…
It was a peaceful Friday night / Saturday morning. Your laptop long tucked away in your bag, and you [probably, hopefully] tucked away in bed. It is currently 3 AM local time - yes, even for you folks on the east coast, somehow.
Your phone starts ringing. Will you actually wake up? Roll for initiative.
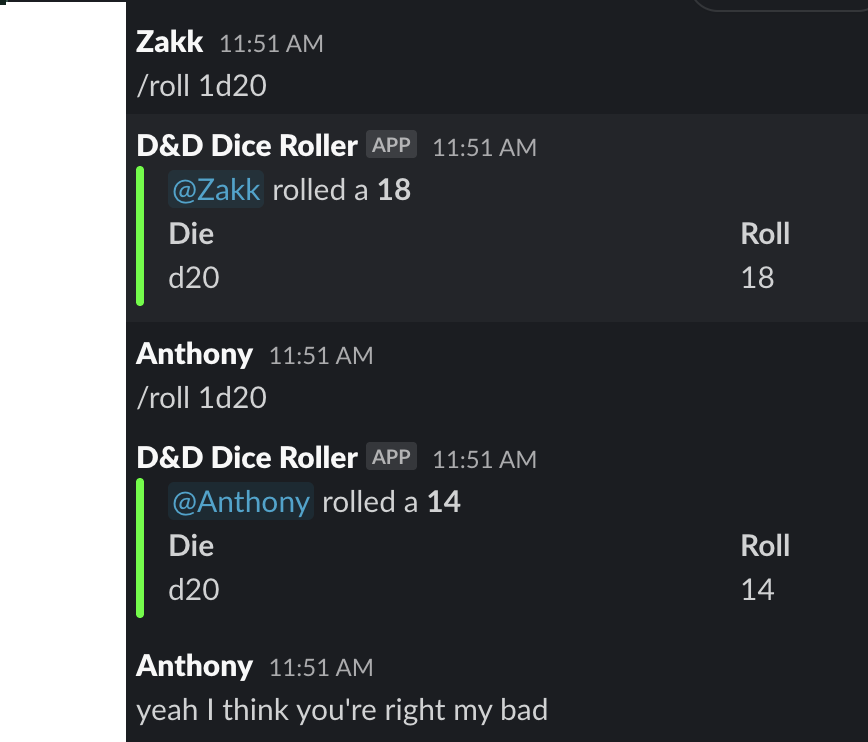
As primary on-call, Anthony, Hakan, and Zakk rolled a 20-sided dice (d20) to see if they passed a perception check - if they actually woke up and noticed their phone ringing.

Because they passed the check, I asked them to put their phones on Do-Not-Disturb mode, and actually paged them to double check that everyone had PagerDuty set up correctly:
Evil stirs in the night…
While Anthony and Hakan were debugging, Zakk had other plans.
For you see, he did not share the same goals as the others.
Unlike the others, Zakk, you’re already awake, sitting in the darkness when your phone lights up. As you look up in the mirror, you see a devilish reflection grinning back at you. You hear a voice like your own:
“This is your chance to shine. Sabotage the others, be the hero, and take the glory of saving Metrics for yourself. Or better yet, watch the world burn.”
Do you resist the dark urge or do you embrace it?
(Spoiler alert: he wholeheartedly embraced the darkness and became the antagonist)
Zakk‘s first order of business was to impose a consequence on the team: GitHub is down and there’s a chance it won’t actually load.
Investigating…
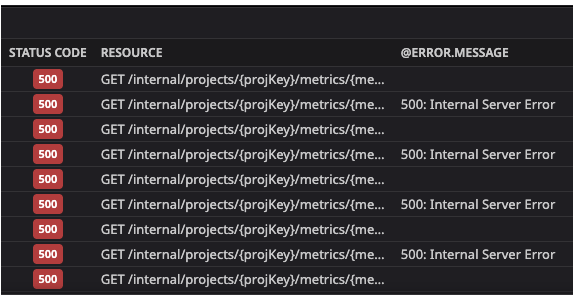
Anthony looks at the alert message:
Triggered: success rate SLO Burn Rate Alert. For the 7-day target, burn rates of 14.65 and 37.04 were measured for the past 4h (long window) and 20m (short window), respectively. Burn Rate has exceeded for metrics success rate & requests were 5xx in last 4h. Error budget rate has exceeded 5% of the 7-day error budget which will lead to violation of success rate SLO. Notified @slack-ops-metrics
And noted this follow-up item:
He then looked for a Metrics dashboard, and discovered that there are multiple unrelated ones!

Anthony and Hakan took turns going through the traces:
And discovered an error message:
"Failed to query Athena"
Anthony then wanted to check up on Athena, but was met with a screen that suggested we didn’t have even have Athena access:

Hakan then checked our Airflow DAGs, and found that the DAGs were fine.
Deception
Zakk attempts to throw everyone off the scene and mislead everyone into looking at recent deploys instead of investigating the error message further.
And we fell victim to his silver tongue!
With that, the heroes turned their attention to looking at recent deploys… before realizing they needed to find out which repository / service to look at. Something to follow up on. 😄
The Cavalry Arrives
The secondary on-call is paged! Liz successfully wakes up and responds to the page, but Baslyos unfortunately rolls too low (3/20), and continues peacefully sleeping away. 🛌💤
Learning Datadog: Trace Explorer
And it was indeed one specific customer that was unable to load metric event activity!
Declare an incident?
Role-playing as characters in the scenario, the team debated whether to declare an incident. Zakk pointed out our policy is to declare an incident if there is any doubt, so we declared an incident.
Tiffany arrives as incident manager:
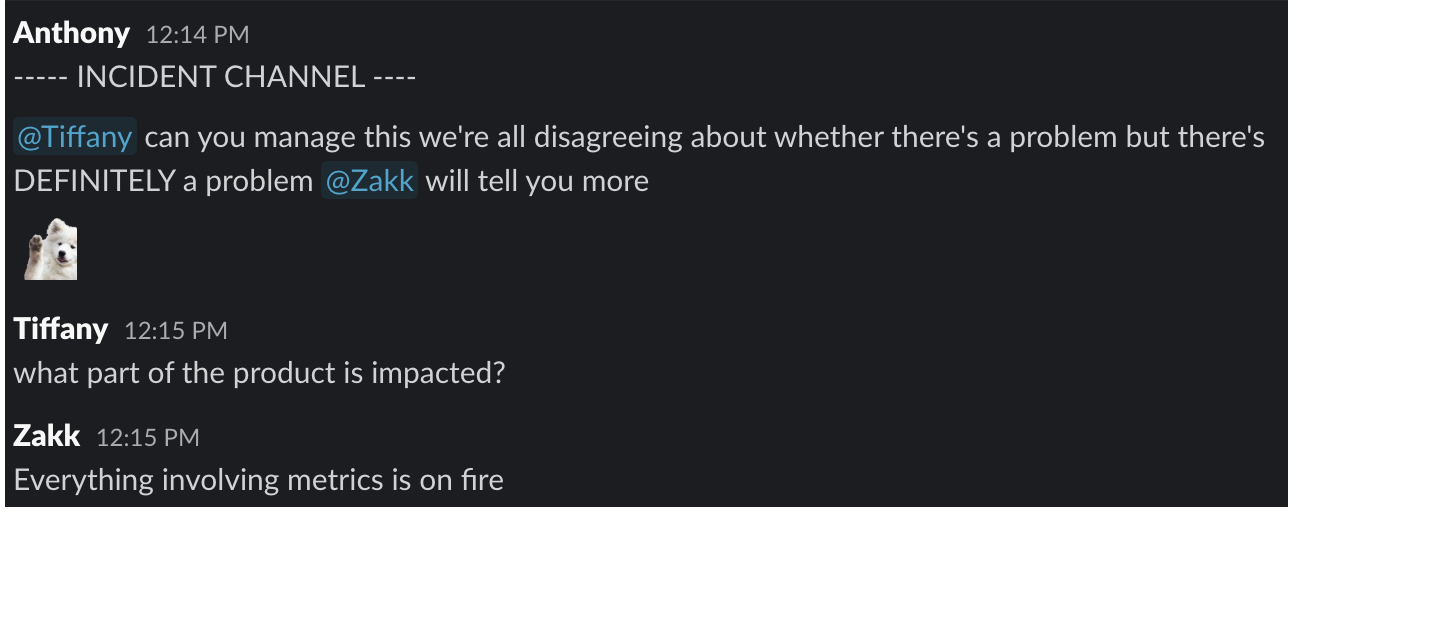
The team discussed the severity and the next steps, and the incident ends.
Fin.
Following Up
We found that going through the Dungeons and Downtimes scenario was great for discovering issues, gaps, and questions, so Liz suggested a follow-up session where we dive in-depth on those specific questions.
Recommendations
I hope you enjoyed reading this lengthy post about our adventures in Dungeons and Downtimes! We encourage you to run similar scenarios for your teams, and to follow up on any questions unearthed. The scenario had branched off in a different direction than what I originally prepared for (which is actually awesome - that makes it more interesting!).
Thank You
This session would not have gone as smoothly or as fun without the players:
-
Anthony and Hakan for discovering all the gaps and calling them out.
-
Baslyos for explaining our process and for showing us what happens if we decline a page.
-
Liz for teaching us how to page people, how to debug an issue using trace explorer, and pushing for a follow-up session to address questions in-depth.
-
Tiffany for the valuable feedback throughout the process, recording questions and screenshots, the Slack emoji, and encouraging people to share their screen while debugging.
-
Zakk for being a creative and entertaining villain. You gave us the most laughs!