Flag audiences
Flag audiences is available to customers on select plans
Flag audiences is only available to customers on select plans and work with both regular flag rollouts and guarded rollouts. To learn more, read about our pricing. To upgrade your plan, contact Sales.
This topic explains how to use flag audiences to understand who evaluated a flag, which variation they received, and what occurred during those evaluations, based on sessions and observability data.
LaunchDarkly automatically generates flag audiences based on incoming evaluation data. You do not need to configure or create audiences for a flag.
This capability helps teams answer important questions during releases, such as who evaluated a flag, which variation they received, and what they experienced around the evaluation. It reduces the need to cross-reference logs, traces, or history across multiple tools and provides clearer visibility during investigations.
The Audience tab combines context information, session replays, and observability data to give teams a clear view of rollout activity and impact. It helps teams:
- Detect performance issues faster by linking flag activity to errors, traces, and latency
- Reduce investigation time by connecting evaluation data with observability insights
- Verify that rollouts target the expected audiences
- Review flag behavior after release to confirm performance and document results
You can access flag audiences from the Audience tab for any flag. This tab displays the contexts that evaluated the flag, the variations they received, and related session and observability data. From this tab, you can identify who was affected by a change, confirm rollout targeting, and understand evaluation behavior without switching between tools.
View audiences and sessions
Use flag audiences to explore who evaluated a flag and how those evaluations changed over time. This information helps you confirm that rollouts target the right contexts, verify which variations users received, and identify patterns in evaluation activity.
Open the Audience tab
Follow these steps to open the Audience tab and review evaluation details:
- In the left sidebar, click Code. The CodeControl menu appears.
- Click Flags.
- Select the flag.
- Select the flag’s Audience tab.
- Select the environment you want to view from the environment selector.
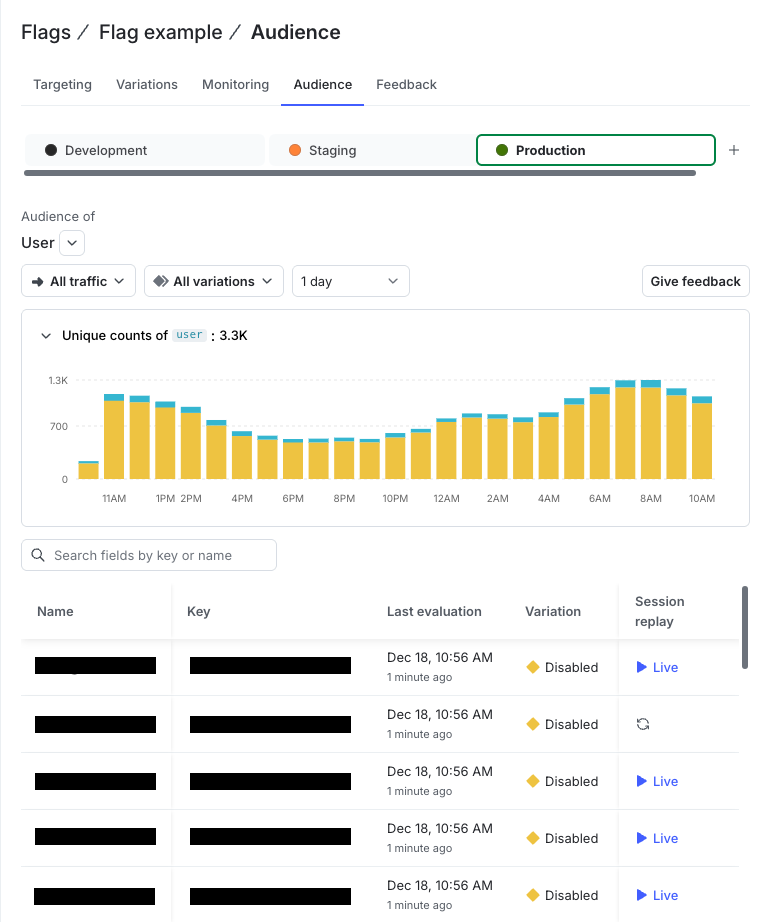
Understand the audience table
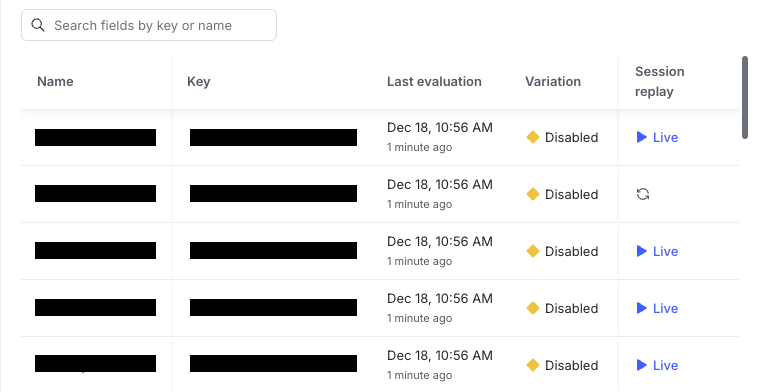
The audience table lists the contexts that evaluated the flag within the selected time range. Each row displays key evaluation details for a single context, including:
- Context name or key
- Date and time of last evaluation
- Variation served
- Session replay link
The audience table provides a traceable record of who evaluated the flag and what occurred during those evaluations. By default, the table shows evaluations from the last seven days. Data is retained for 30 days.
The audience table displays up to 250 contexts at a time. If more than 250 contexts are available, add or adjust filters to narrow your results.
View audiences during a guarded release
When a flag is part of a guarded release, the Audience tab includes a selector that lets you filter evaluations by rollout stage. Guarded release filters help you focus on evaluations that occurred during a specific rollout.
Selecting a guarded release updates the audience table and chart to show only the contexts that evaluated the flag during that release. The selected rollout is added as a URL parameter so refreshing the page preserves your selection. The variation list updates to show only the variations observed during that release.
The audience table displays a separate row for each context and variation pair recorded during the rollout. When metric data is available, the table adds a dynamic column for each metric associated with the release.
If context attributes include a name, firstName and lastName, or email, the name appears in its own column. Clicking a key opens a dialog with all available attributes for that context.
A flag may have multiple guarded releases. If a flag includes many releases, the selector provides a search field to help you find a specific release.
If no evaluations are available for the selected rollout, the audience table and chart appear empty with guidance to adjust or clear the rollout filter.
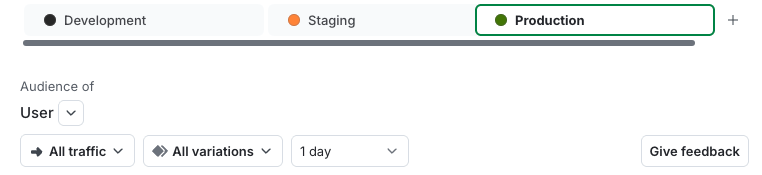
Adjust the displayed data
Use the controls at the top of the Audience tab to modify what data appears in the audience table and chart. You can:
- Change environments or select a context kind from the dropdown menu.
- Search for contexts by name or key.
- View all variations or select a specific variation.
- Choose a date range using either presets or a custom range.
- Click Show chart to display a chart of unique values for a context kind across specific dates. Click Hide chart to close it.
The Audience tab includes a chart that summarizes evaluation activity over time. You can update the chart by adjusting the audience, variation, or date range filters, or by selecting a guarded release.
If no data is available for the chosen time range, LaunchDarkly disables the search field and variation selector until data becomes available.
Refine your view
You can refine or expand your view of audience data in several ways:
- Filter by variation to identify which contexts received it.
- Sort supported columns by clicking the column header.
- Use search to find contexts by context key, variation value, or context attributes.
- Open context details to review attributes such as
name,email, ordevicetype. - Click a name to open a dialog showing all available attributes for that context.
Charts update dynamically when you apply filters or specify particular contexts within a context kind.
View session data
When an observability SDK is installed, LaunchDarkly adds a session replay link beside each context. A session replay shows what a user or context experienced in your application at the time of evaluation, including actions that occurred before and after the evaluation event.
To learn more, read Session replay.
The replay opens in the session viewer, allowing you to inspect what happened at the time of evaluation.
Each context shows only the most recent session. LaunchDarkly links this session data to the corresponding context and retains it for 30 days.
When viewing audiences during a guarded release, session replay links appear when session data is available for that evaluation.
Data and availability
LaunchDarkly stores audience and session data for a limited time to ensure performance and accuracy. The following details describe how this data is retained and displayed:
- LaunchDarkly retains audience and session data for 30 days.
- The audience table displays the most recent 1,000 evaluations per flag and up to 250 contexts at a time. If more than 250 contexts are available, apply filters to limit the results.
- Flag audiences include only evaluations sent from supported client-side SDK versions.
- The observability SDK enables session replays and traces.
Troubleshooting
Use the following information to troubleshoot common issues with flag audiences and sessions:
- The audience table is empty: Verify that your client-side SDK is active and the flag has received evaluations in the last 48 hours.
- Only one context kind appears: Confirm that your application sends multiple context kinds. The selector hides when a flag receives only one kind.
- Session links are missing: Verify that the observability SDK is installed and sending session data.
- Health checks show mismatched context kinds: Confirm that the rollout’s Target by value matches the context kind used in evaluations.