
Traces
This topic explains how to use the observability Traces page to view OpenTelemetry trace data stored in LaunchDarkly.
An OpenTelemetry trace is a record of activity for a request that your application processes. Traces show how a given request flows through different services or components. Each trace consists of multiple spans, where each span represents a single operation or step taken to process a request. Spans include attributes such as a span name, duration, and related context.
The Traces page helps you filter available trace spans by querying the span attributes you choose. It provides a main chart to help you aggregate and visualize the individual spans returned by your query.
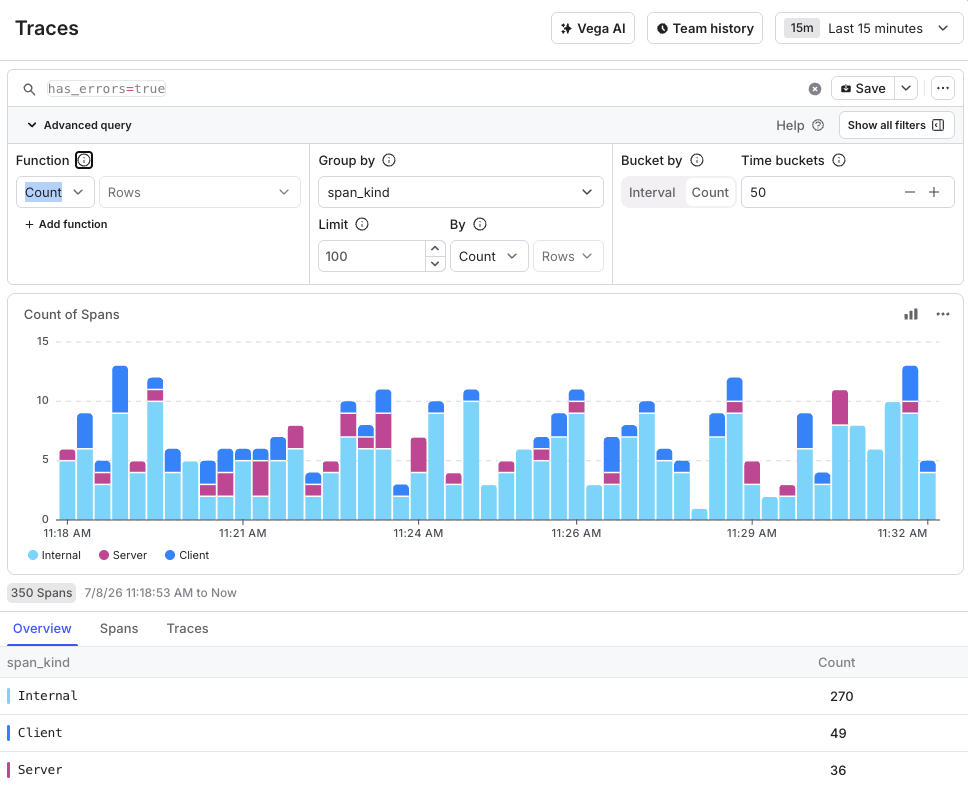
Select tabs at the bottom of the Traces page to display raw data for the results of your query:
- Overview shows the grouped aggregation values associated with the chart display.
- Spans shows one row for each span in your query result.
- Traces shows one row for each trace that contains spans from your query result.
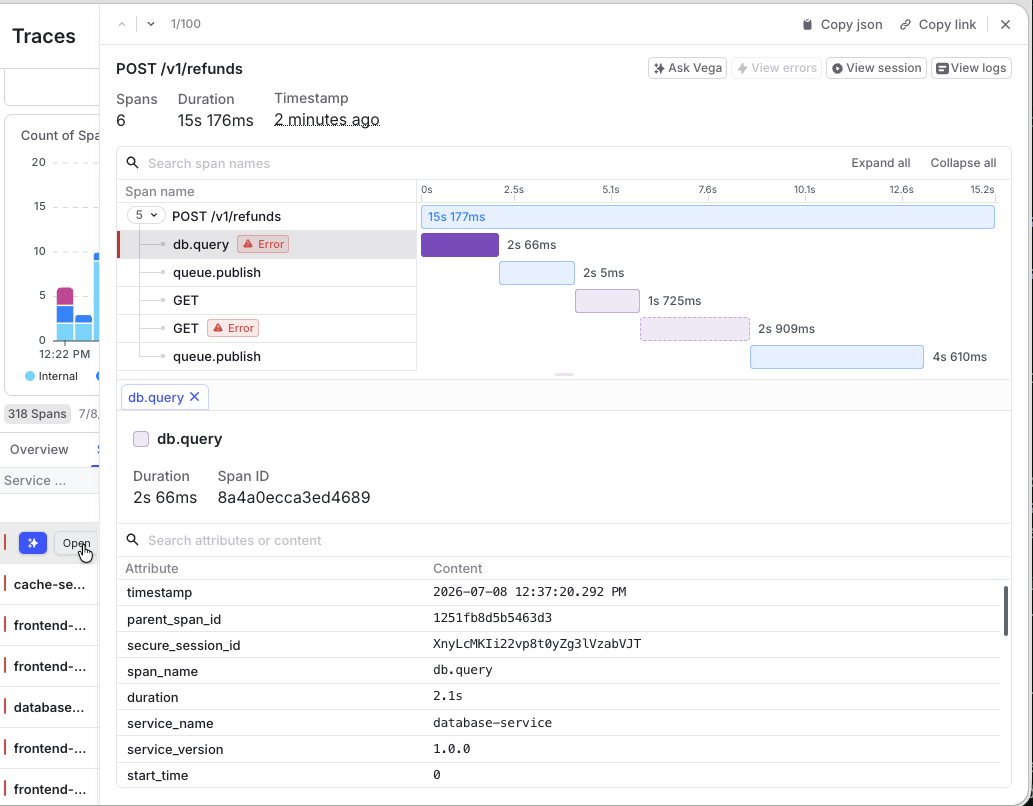
In the Spans or Traces tab, hover over an entry in the first column to view options for displaying details about the selected row. Select Open to view full trace details associated with the span or trace, or select the Vega icon to add the span or trace to a Vega prompt.
Get started
To instrument your application to capture traces, read the documentation on Observability SDKs. The functionality is available through plugins to the LaunchDarkly JavaScript SDK.
To ingest OpenTelemetry traces from other source, read Observability integrations and configure your application to use the LaunchDarkly observability endpoints.
To view available traces, open the Telemetry section and navigate to the Traces list.
Search
To learn more about the search specification for the Traces view, read Search specification.
When you search on the Traces view, the following behaviors apply by default:
- The default search key is
span_name. For example, if you enter an expression without a key, such assearch-term, then LaunchDarkly automatically expands that tospan_name=*search-term*.
Search attributes
By default, the observability SDK plugin automatically injects the following attributes to provide additional help with searching for traces: