Experimentation
This topic explains the concepts and value of the LaunchDarkly Experimentation feature. Experiments let you measure the effect of features on end users by tracking metrics your team cares about.
About Experimentation
Experimentation lets you validate the impact of features you roll out to your app or infrastructure. You can measure things like page views, clicks, load time, infrastructure costs, and more.
By connecting metrics you create to flags or AgentControl configs in your LaunchDarkly environment, you can measure the changes in your customer’s behavior based on the different variations your application serves. This helps you make more informed decisions, so the features your development team ships align with your business objectives.
You can also run experiments using data from an external warehouse, like Snowflake. To learn about different kinds of experiments, read Experiment metric types. To learn about Experimentation use cases, read Example experiments.
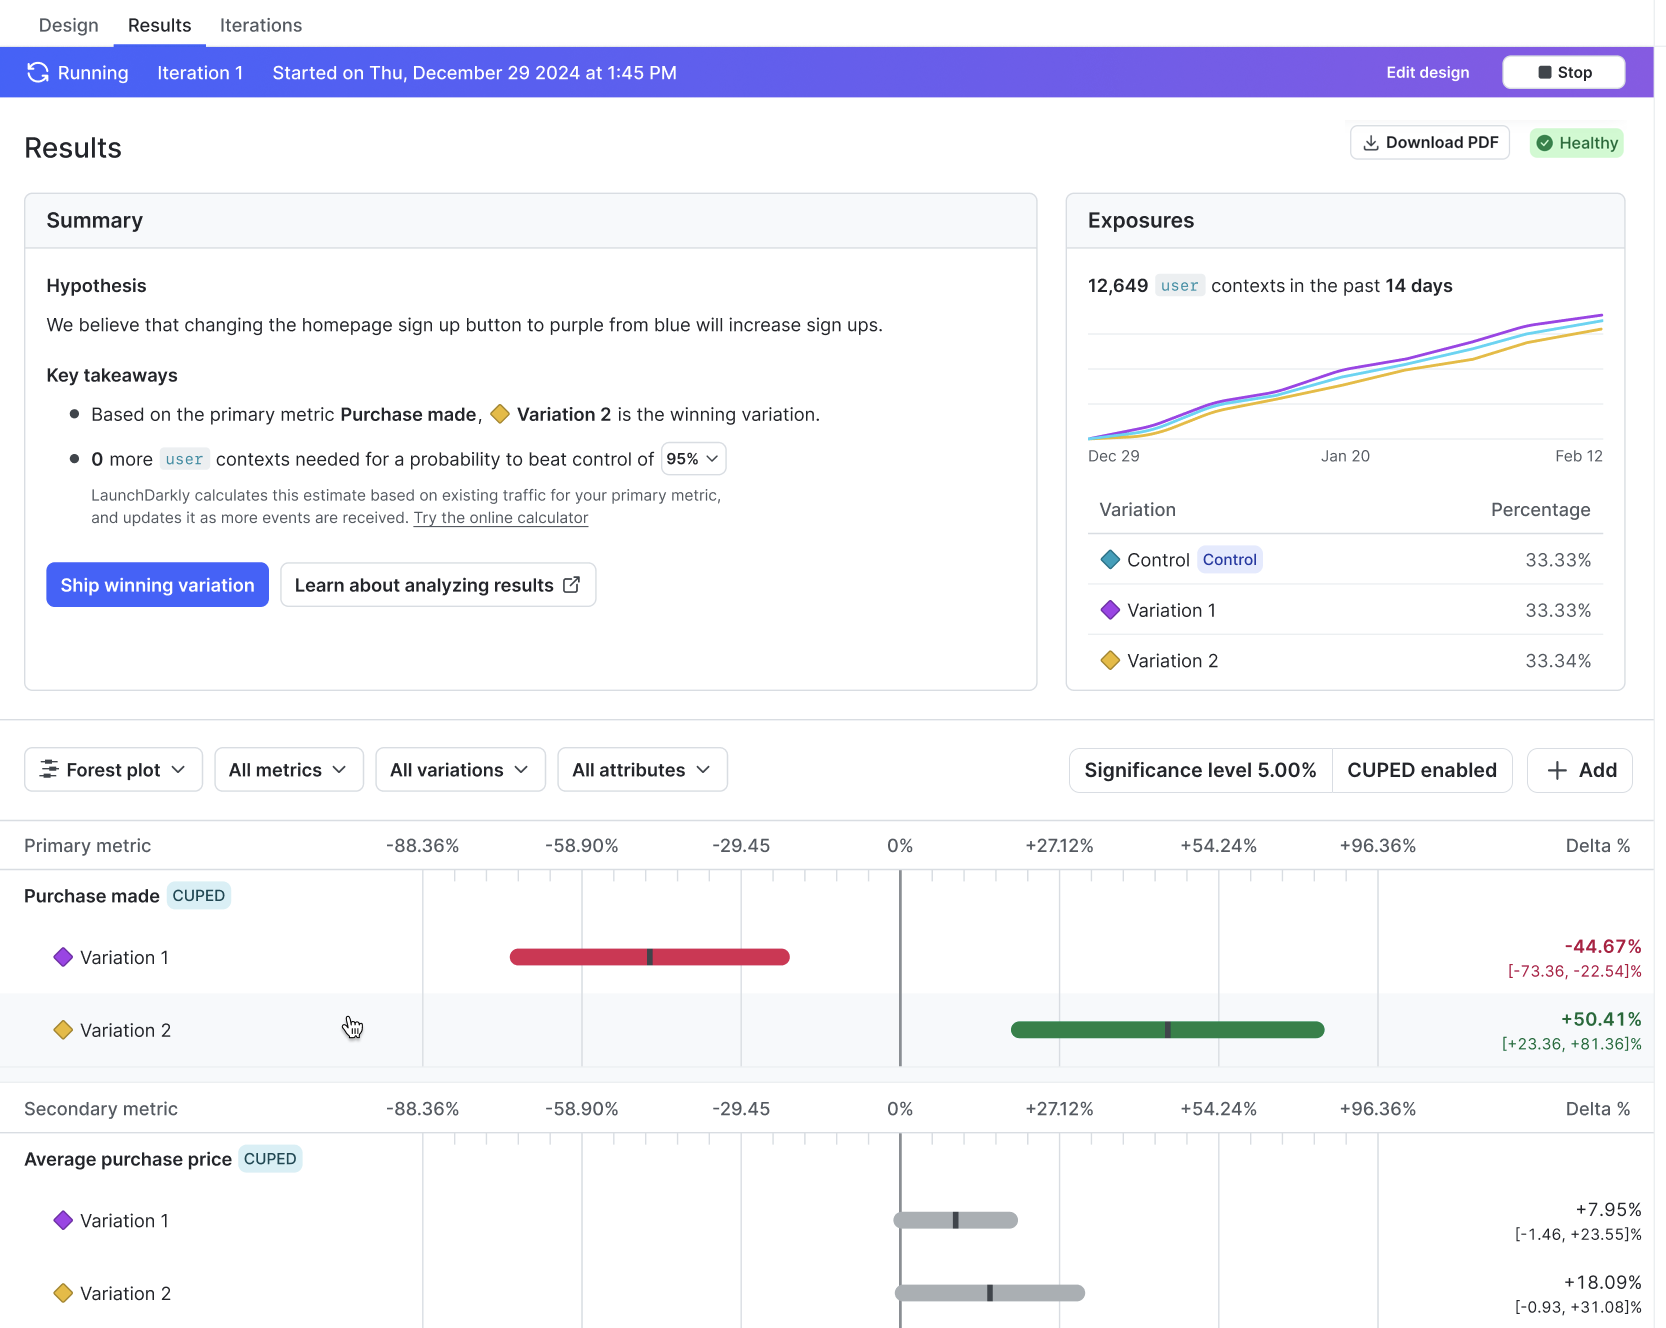
Here is an example of an experiment’s Results tab:
Experimentation use cases
We designed Experimentation to be accessible to a variety of roles within your organization. For example, product managers can use experiments to measure the value of the features they ship, designers can test multiple variations of UI and UX components, and DevOps engineers can test the efficacy and performance of their infrastructure changes.
If an experiment tells you a feature has positive impact, you can roll that feature out to your entire user base to maximize its value. Alternatively, if you don’t like the results you’re getting from a feature, you can toggle the flag’s targeting off and minimize its impact on your user base.
Some of the things you can do with Experimentation include:
- Compare multiple variations of one experience (A/B/n testing): Assign contexts to two or more flag or AgentControl config variations and measure which variation performs best on the metrics you attach to the experiment.
- Validate instrumentation with A/A testing: Run an experiment where every variation is behaviorally the same, so you can confirm that traffic splits as expected and that your metrics are stable before you run a true A/B test.
- Start and stop experiments at any time: You have immediate control over which variations your customers receive.
- Interpret uncertainty in the results: Depending on your statistical methodology, LaunchDarkly surfaces frequentist confidence intervals or Bayesian credible intervals so you can see how much evidence supports each variation, not just the raw metric values.
- Use targeting to limit who is included in an experiment: Combine experiments with segments or other targeting rules so you test with a representative slice of customers, internal users only, or a specific market.
- Measure impact across your stack: Attach metrics to flags evaluated in mobile and web clients, application servers, microservices, or other components so you can connect user-facing changes to latency, errors, cost, or backend throughput.
- Run experiments on warehouse-backed metrics: Use metrics computed from data in a supported external warehouse, such as Snowflake.
- Use multi-armed bandits for dynamic allocation: Unlike a standard A/B test with fixed traffic splits, a multi-armed bandit continuously shifts more traffic toward better-performing variations while still exploring weaker ones.
- Use warehouse native metrics: You can connect LaunchDarkly to an external warehouse and run experiments using metric events from that warehouse.
Example experiments
You can use experiments to measure a variety of different outcomes. Some example experiments include:
- Onboarding or signup flows: Compare alternate copy, layouts, or step order in a registration funnel to learn which version increases completed sign ups or verified accounts.
- Search, ranking, or recommendations: Swap backends or ranking logic behind a flag, such as different search engines or scoring models, and measure query success, click-through, or downstream conversions.
- Performance and reliability: Ship a change behind a flag and track page load time, error rates, or infrastructure cost metrics to see whether the new path is faster, cheaper, or more stable than the baseline.
- Engagement and conversion: Use click, tap, or custom conversion metrics to see which variation drives more of the actions that matter, from adding to cart to using a new feature.
To learn more, read Designing experiments.
To get started building your own experiment, follow our Quickstart for Experimentation.
You can also use the REST API: Experiments