

service_name attribute in your spans determines each service’s name, and parent-child span relationships indicate which services call each other. Every service that appears in your traces during the selected time range also appears in the services views.
The services views present the same set of services in two different ways:
- Map: An interactive dependency graph. Use this view to understand how your services connect to each other.
- List: A table with request and error volume for each service. Use the list view to quickly compare different services or to find a service by name.
Prerequisites
To use the services views, you need:- Tracing instrumentation configured for your services. To learn more, read Traces.
- Trace data received within the time range you select.
Access the Services views
To access the services views:- Navigate to Observability > Dashboards.
- Select Services from the list of available dashboards.
- Click List or Map.
No data displayedIf the services views appear empty, confirm that you configured tracing instrumentation for your services and that the selected time range includes this trace data. Try expanding the time range if you expect data to be present.
Use the map view
The map view displays your services as nodes and their call relationships as directional edges. When two services call each other, the edge between them is bidirectional.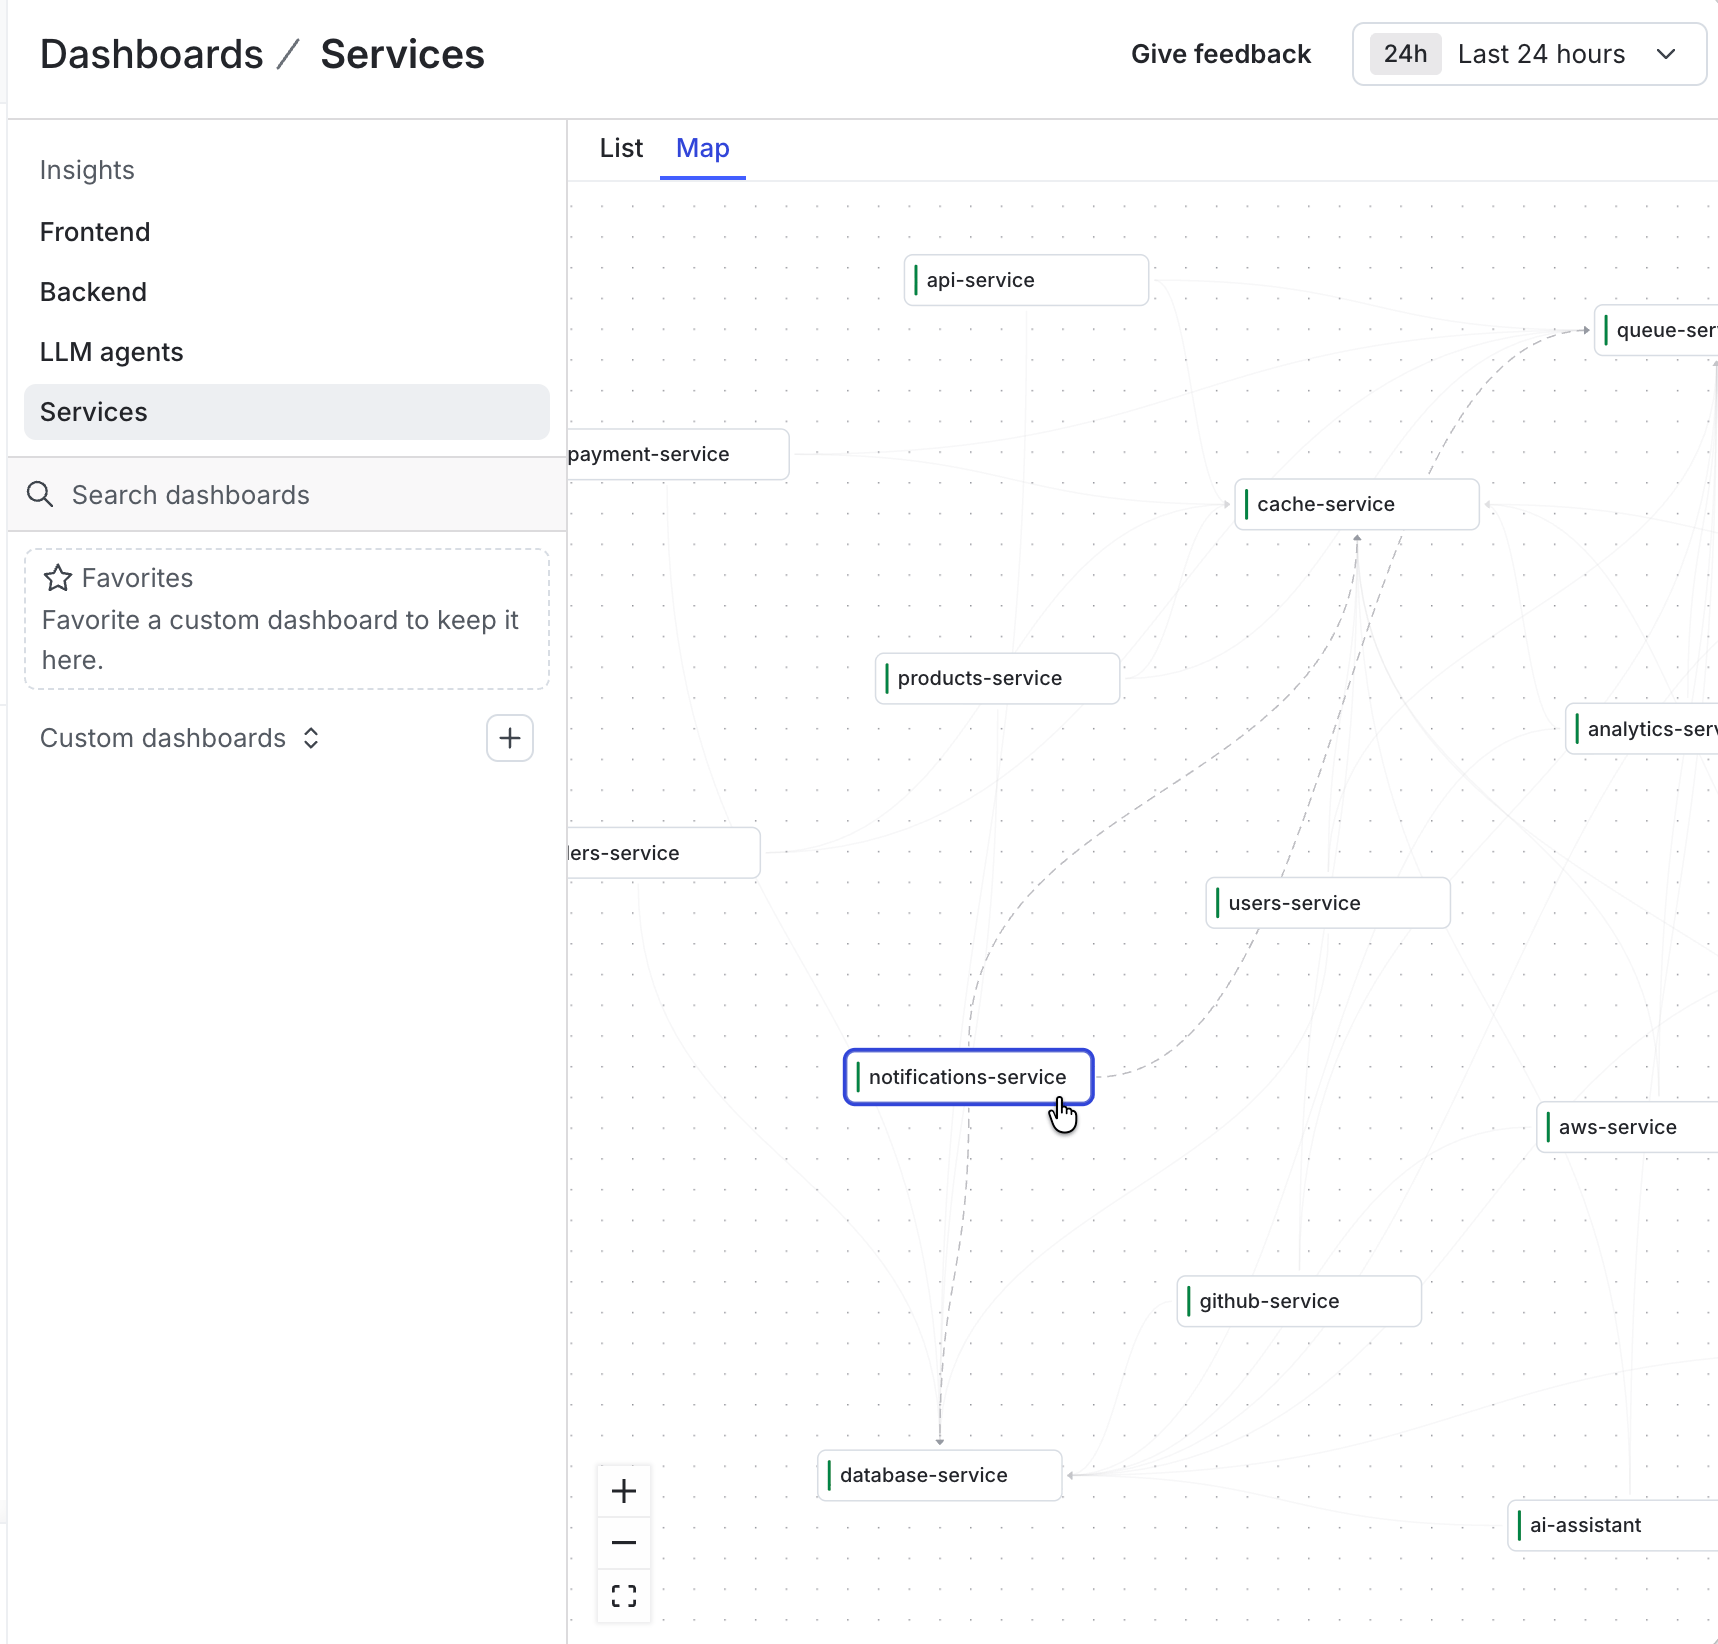
The Services map view.
Use the list view
The list view displays one row per service, with a small graph and a total for the selected time range. LaunchDarkly lists services in alphabetical order by name.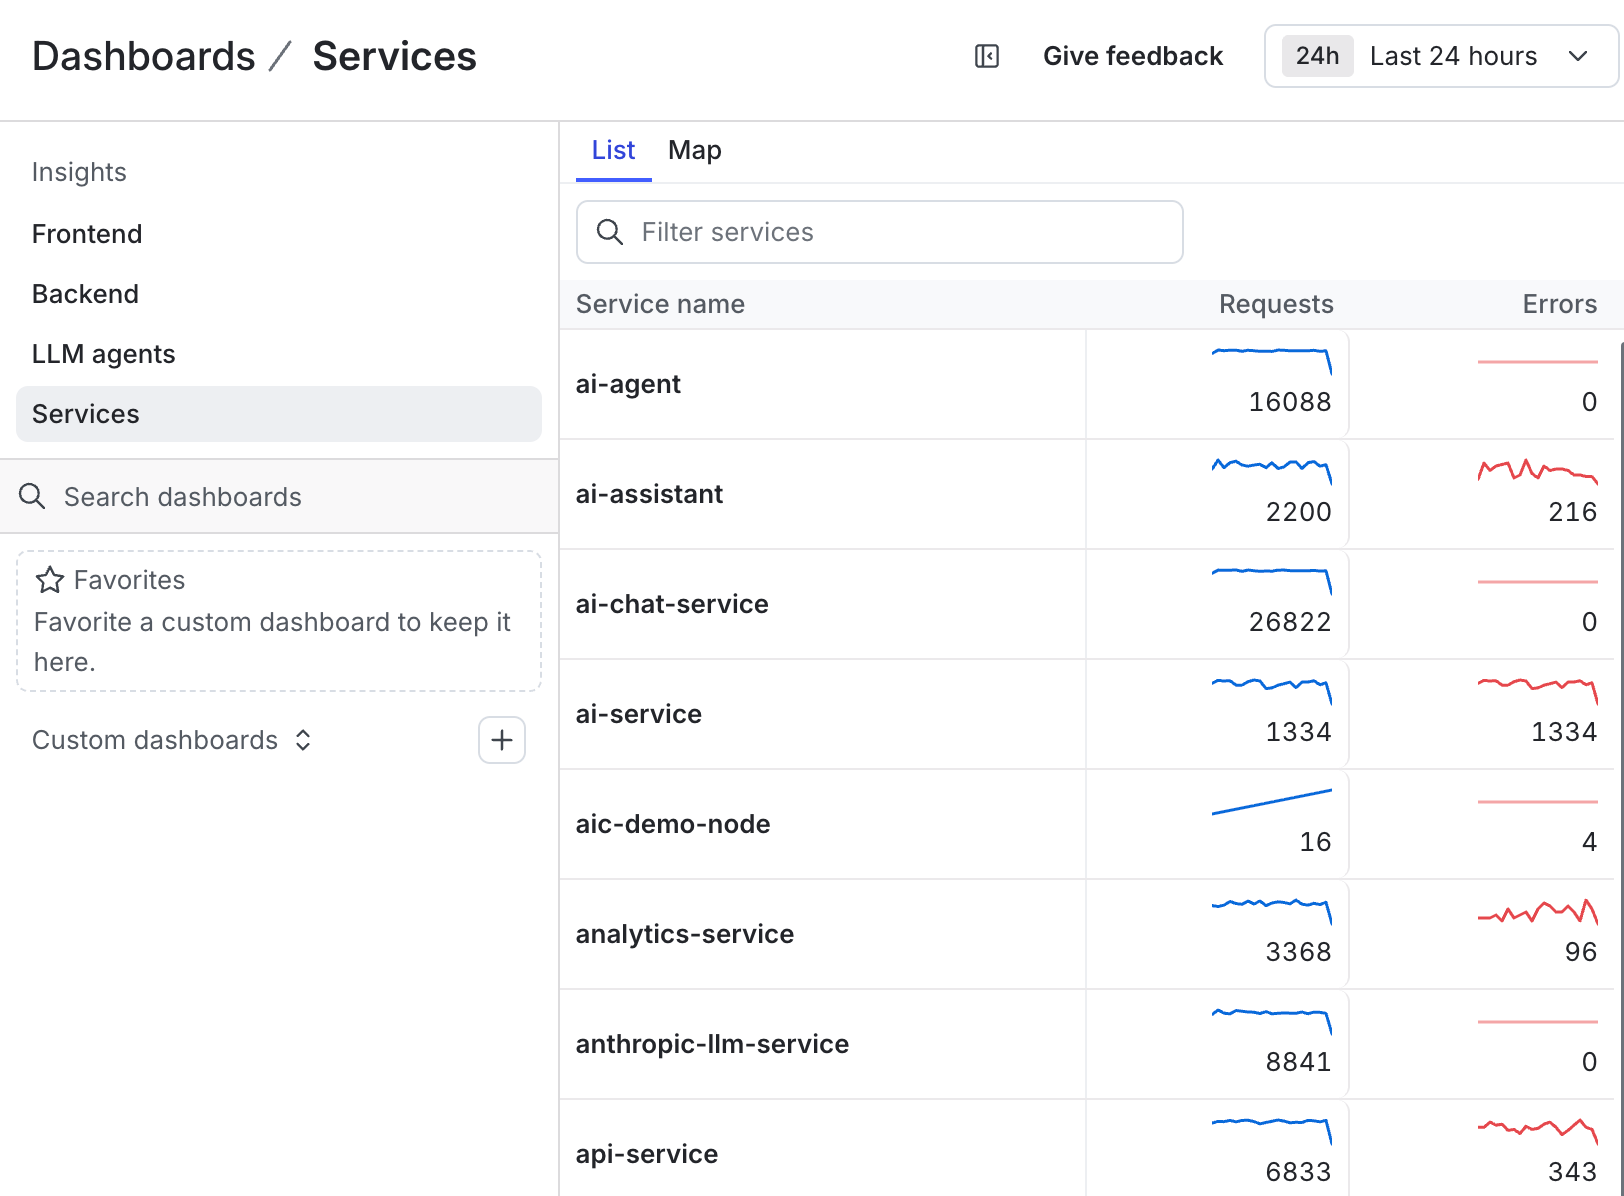
The Services list view.
| Column | Description |
|---|---|
| Service name | The value of the service_name attribute on the service’s spans. |
| Requests | The count of spans recorded for the service during the selected time range. |
| Errors | The count of spans recorded for the service that contain an error during the selected time range. |