

Prerequisites
To calculate a sample size, you need the following:- An experiment that uses a frequentist statistical approach with a fixed horizon. To learn more, read Creating experiments.
- An estimate of the current performance of your primary metric.
- An estimate of how much daily traffic matches your experiment’s targeting rule.
About the sample size calculator
The sample size calculator estimates two things from the inputs you provide:- Sample size: The total number of units across all of your experiment’s variations that you need to detect the effect you care about.
- Duration: How long the experiment needs to run to reach that sample size, based on the traffic you expect.
Sample size calculator fields
The sample size calculator groups its fields into three sections: “Metric,” “Traffic,” and “Statistical settings.” Each section is explained below.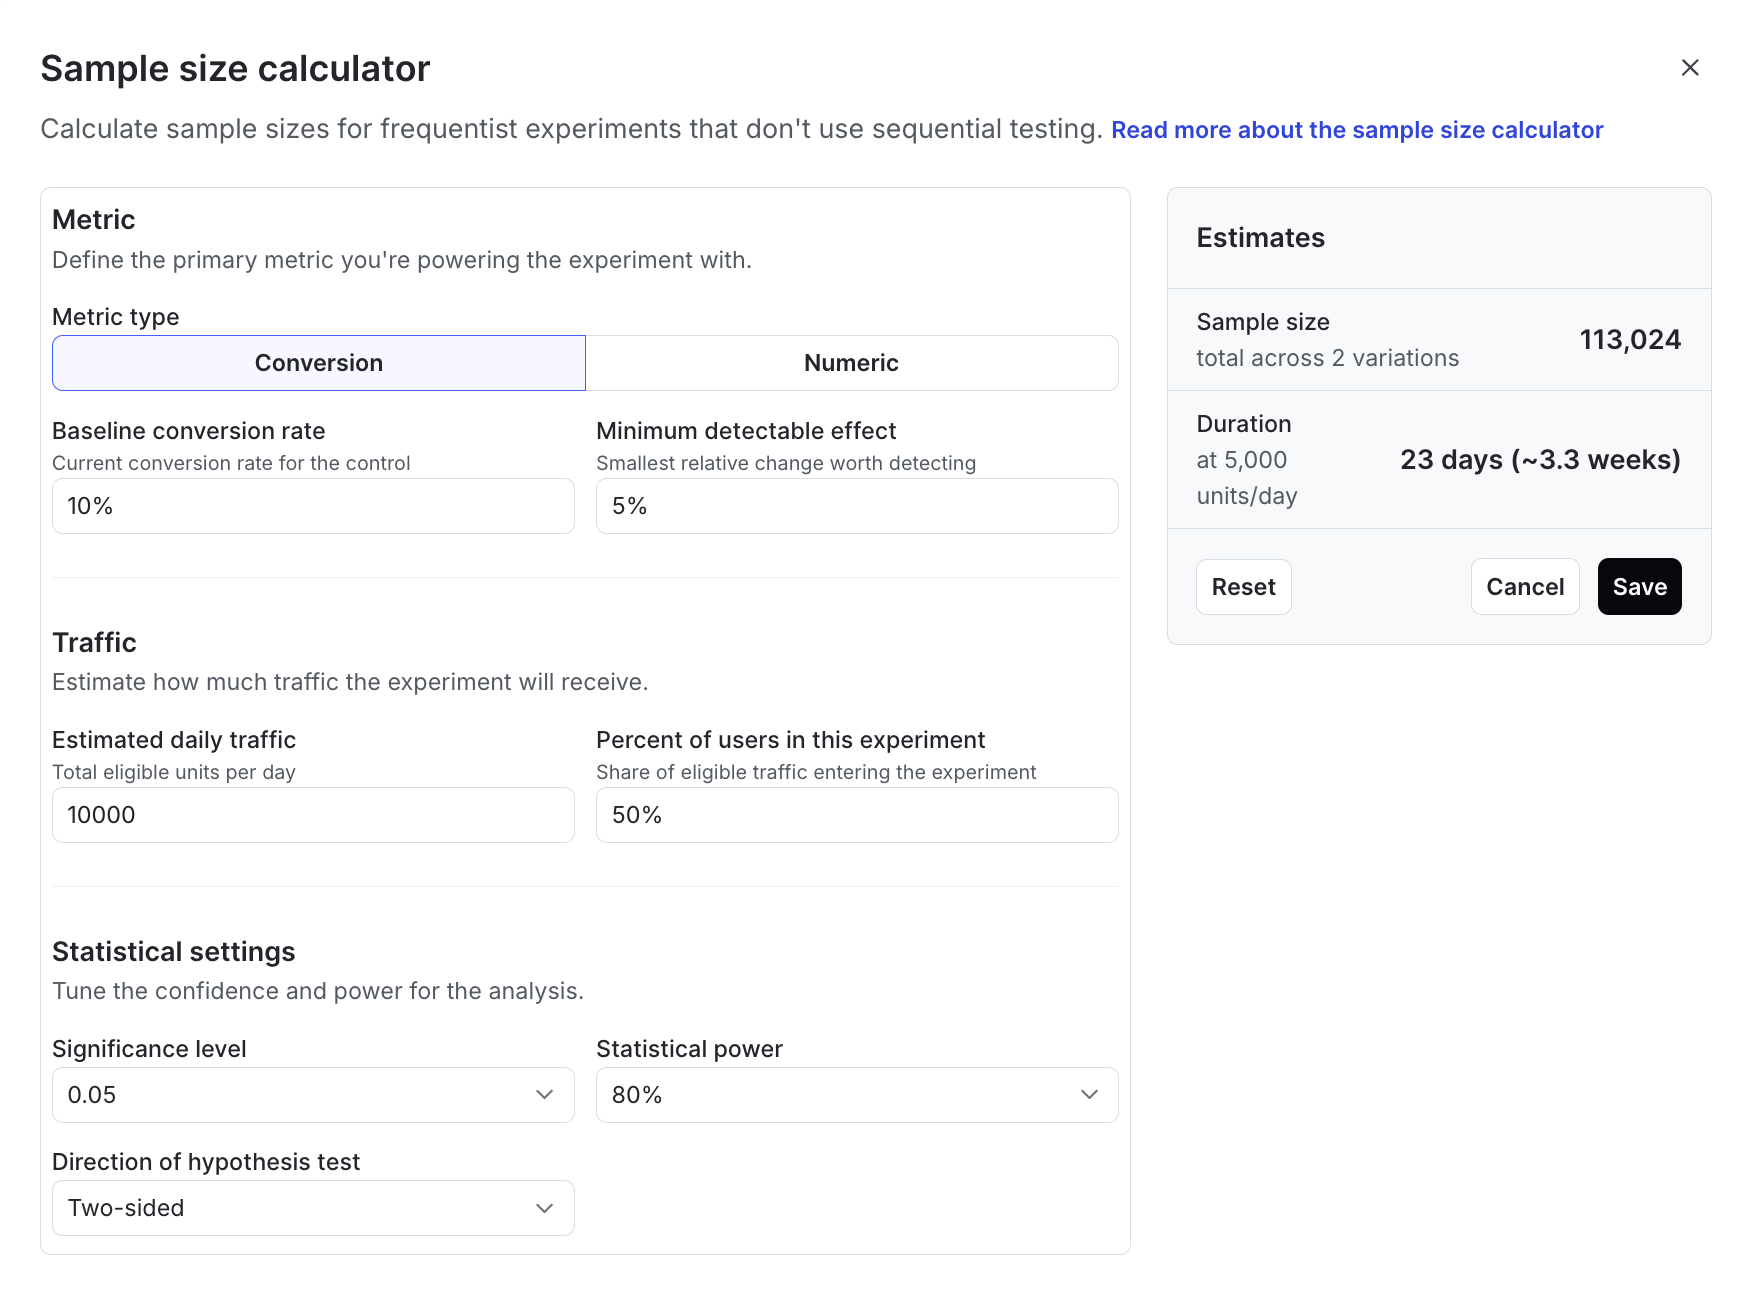
The sample size calculator.
Metric
The “Metric” section defines the primary metric the experiment is tracking. Choose a Metric type of Conversion or Numeric. The baseline fields change to match the metric type you choose. You cannot calculate a sample size for a numeric metric that uses percentile analysis, because the calculator estimates sample sizes for metrics analyzed as means. To learn more about analysis methods, read Custom numeric metrics. For a conversion metric, complete the following field:- Baseline conversion rate: The current conversion rate for the control variation. For example, if 10% of the contexts that encounter your control variation convert today, enter
10%. - Minimum detectable effect: The smallest relative change worth detecting, as a percentage of the baseline. Smaller values require more data, so choose the smallest change that would affect your decision-making.
- Baseline mean: The average metric value for the control variation. For example, if your control variation currently averages an order value of 100, enter
100. - Standard deviation: How much the metric values vary across units. Metrics with larger variance require a larger sample size.
- If you don’t know the standard deviation for your metric, you can estimate it from historical data for the same metric.
- The calculator assumes the treatment variations have the same standard deviation as the control. You provide one standard deviation, and it applies to every variation.
- If your primary metric is a ratio metric, or if the metric’s analysis units differ from the experiment’s randomization units, enter a standard deviation calculated at the randomization unit level. For example, you can use the Delta method to calculate the effective randomization unit-level standard deviation. The calculator returns a sample size in randomization units, so a standard deviation calculated at the analysis unit level returns an estimate that does not reflect the number of units your experiment needs.
- Minimum detectable effect: The smallest relative change worth detecting. Smaller values require substantially more data, so choose the smallest acceptable change.
Minimum detectable effect is relativeThe minimum detectable effect is a relative change. With a baseline conversion rate of 10%, a minimum detectable effect of 5% means a change of half a percentage point to 10.5%, not a change to 15%.The minimum detectable effect is also a size, not a direction. A two-sided test detects a change of that size in either direction, so a 10% baseline with a 5% minimum detectable effect covers a change to 10.5% or to 9.5%. A one-sided test is powered to detect the change only in the direction you chose.
Traffic
The “Traffic” section estimates how much traffic the experiment will receive. LaunchDarkly uses these values to convert the required sample size into a duration. Complete the following fields:- Estimated daily traffic: The total number of eligible units per day. Eligible units are the units that match your experiment’s targeting rule, whether or not they enter the experiment.
- Percent of users in this experiment: The share of eligible traffic that enters the experiment. This should match the audience allocation on your experiment. To learn more, read Allocating experiment audiences.
Statistical settings
The “Statistical settings” section determines the confidence and power for the analysis. Complete the following fields:- Significance level: The configured allowable rate of false positives for an experiment. 95% is the default, which corresponds to a significance level of 0.05. Higher values require a larger sample size.
- Statistical power: The probability that your experiment detects a difference of the size you specified as the minimum detectable effect, if that difference exists. 80% is the standard value. Higher values require a larger sample size.
- Direction of hypothesis test: Choose Two-sided when you are unsure whether the treatment will perform better or worse than the control. Choose One-sided when you are confident about the direction of the difference and only want to test for it in that direction.
Estimates
The “Estimates” panel updates as you change your inputs. It displays:- Sample size: The total number of units required across all of your experiment’s variations.
- Duration: The number of days and weeks needed to reach that sample size, based on the number of units per day your traffic inputs imply.
- Increasing the MDE: This is a change in expectation. You look for larger, more impactful changes while keeping the mathematical integrity of your test intact. The risk is missing a smaller change.
- Increasing traffic allocation: This brings in data faster to shorten the timeline, but it exposes a broader audience to unproven variations, increasing the risk to user experience if a variant performs poorly.
- Lowering the statistical power: This directly increases the risk of missing a winner because the test lacked the power to see it.
- Increasing the significance level: This directly increases the risk of falsely concluding a winner when the difference was only random noise.
Calculate sample sizes
To calculate a sample size:- Navigate to the experiment’s design.
- Scroll to the “Sample size” section.
- Click Attach calculation. The sample size calculator appears.
- Complete the Metric, Traffic, and Statistical settings sections.
- Review the estimated sample size and duration in the “Estimates” panel.
- Click Save.