


When the LaunchDarkly Metrics team first came together, our mission was simple but critical: build the backbone that makes experiments and Guarded Releases run on trusted data. That meant plumbing before polish; infrastructure before interface.
Now, we’ve finally had the chance to turn our attention to the Metrics experience itself.
Over the past few months, we’ve shipped a wave of improvements that make setting up metrics easier and faster. These updates came straight from customer feedback (and plenty of dogfooding)—and they’re already improving how teams work with LaunchDarkly Metrics.
Here’s what’s new:
1. Event Data Preview
No more guessing whether your metric is wired up correctly. We’ve added an inline event data preview to the metric creation flow, so you can see sample data before saving. This lets you know that your metric is receiving events, saving teams the energy and effort they’d otherwise spend debugging before running a guarded rollout or experiment.

2. Updated Metric Connections
Guarded releases are quickly becoming the norm for releasing software, which means a single metric can be connected to hundreds of guarded releases over time. Our old connections table wouldn’t scale well in that scenario, so we’ve rebuilt it as a tabbed experience, organizing connections by Experiments, Guarded Releases, and Metric Groups. This new structure not only scales better; it also integrates neatly with the new Details tab for smoother navigation across related data.
3. Metric Details Tab
Previously, LaunchDarkly users landed on the Impact tab, which was great if the metric was part of an active experiment, but not as useful otherwise. We’ve since introduced a Details surface that shows you key information like configuration, definitions, and connections upfront along with a preview of the event data used to configure the metric. It’s a more consistent landing experience that makes better use of your time.
4. Archiving Metrics
Not every metric deserves to live forever. Until now, teams have been stuck scrolling through long lists of outdated metrics. Archiving changes that; you can now retire old metrics without deleting them, thereby cleaning up your workspace while preserving historical context.
5. Metric Groups UI Refresh
We replaced legacy drag-and-drop components on the Metrics Group page with modern LaunchPad UI components and React hooks, aligning it with the rest of the product. This makes the page easier to use, especially when you’re working with Guardrail Metrics—a recently introduced feature that helps teams track negative outcomes like error rates, latency, or churn.
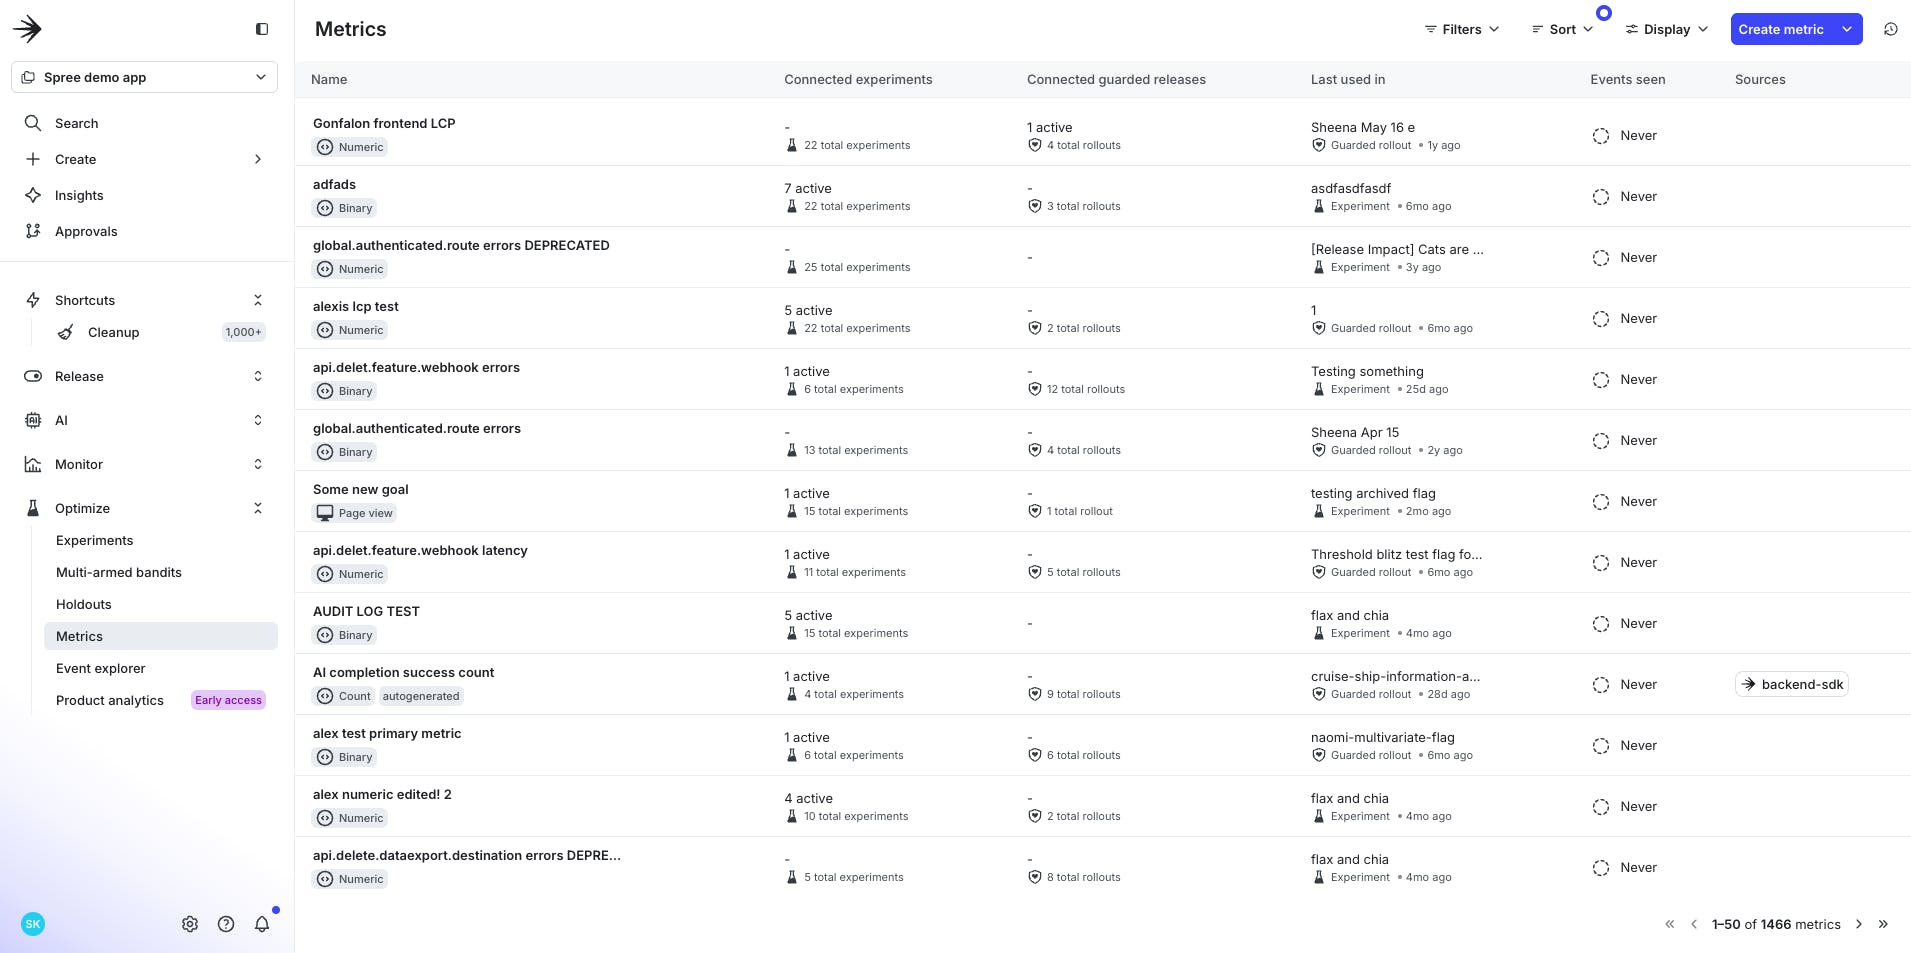
6. Metric List Redesign
The old metric list was a wall of data showing counts of guarded releases and experiments, each using a metric. Combined with filters, sorts, and recency cues, the list is now more signal-rich; you’ll see counts for active experiment connections and guarded releases, which makes it easier to spot which metrics are in play at any moment. When teams know how and where metrics are used, they can better judge a metric’s reliability and relevance before applying it to releases and experiments.
7. A Unified Metric Selection Menu
If you’ve ever tried selecting a metric, you’ve probably noticed that there were five different menus hiding across the product. Each one looked and behaved a little differently. We’ve replaced that with a single, unified selection experience that:
- Surfaces most used and recently added metrics first
- Groups metrics by type (e.g. user-defined, warehouse-native, metric groups)
- Provides inline context like last-seen, tags, and availability
- Works consistently across both Experiments and Guarded Releases
This enables faster selection and fewer second guesses.
Why This Matters
Taken individually, each update might seem small; together, they represent a major step forward in how teams experience Metrics. By investing in our UI and UX, we’re clearing friction from the workflows that matter most: setting up guarded releases, running experiments, and interpreting their impact. This helps us lay the foundation for the next era of Metrics: verified and core metrics, richer trust signals, and smarter defaults that help you make more informed decisions.
We’d love to hear what you think. Tell us how these updates are working for you, and what’s still on your metrics wishlist. Your feedback helps us keep shaping Metrics into a tool that works better for you and your team.
Like what you read?
Get a demo