


In retail and e-commerce, customer journeys rarely follow a straight line. Shoppers bounce between ads, mobile apps, emails, and in-store displays before making a purchase, which makes it harder to know what factors are actually influencing their decisions. With so many potential touchpoints contributing to a single transaction, metrics like page views or clicks only tell part of the story; they don’t reveal what actually drives revenue, loyalty, or long-term growth. To get the full picture, you need insights that connect customer behavior directly to business outcomes.
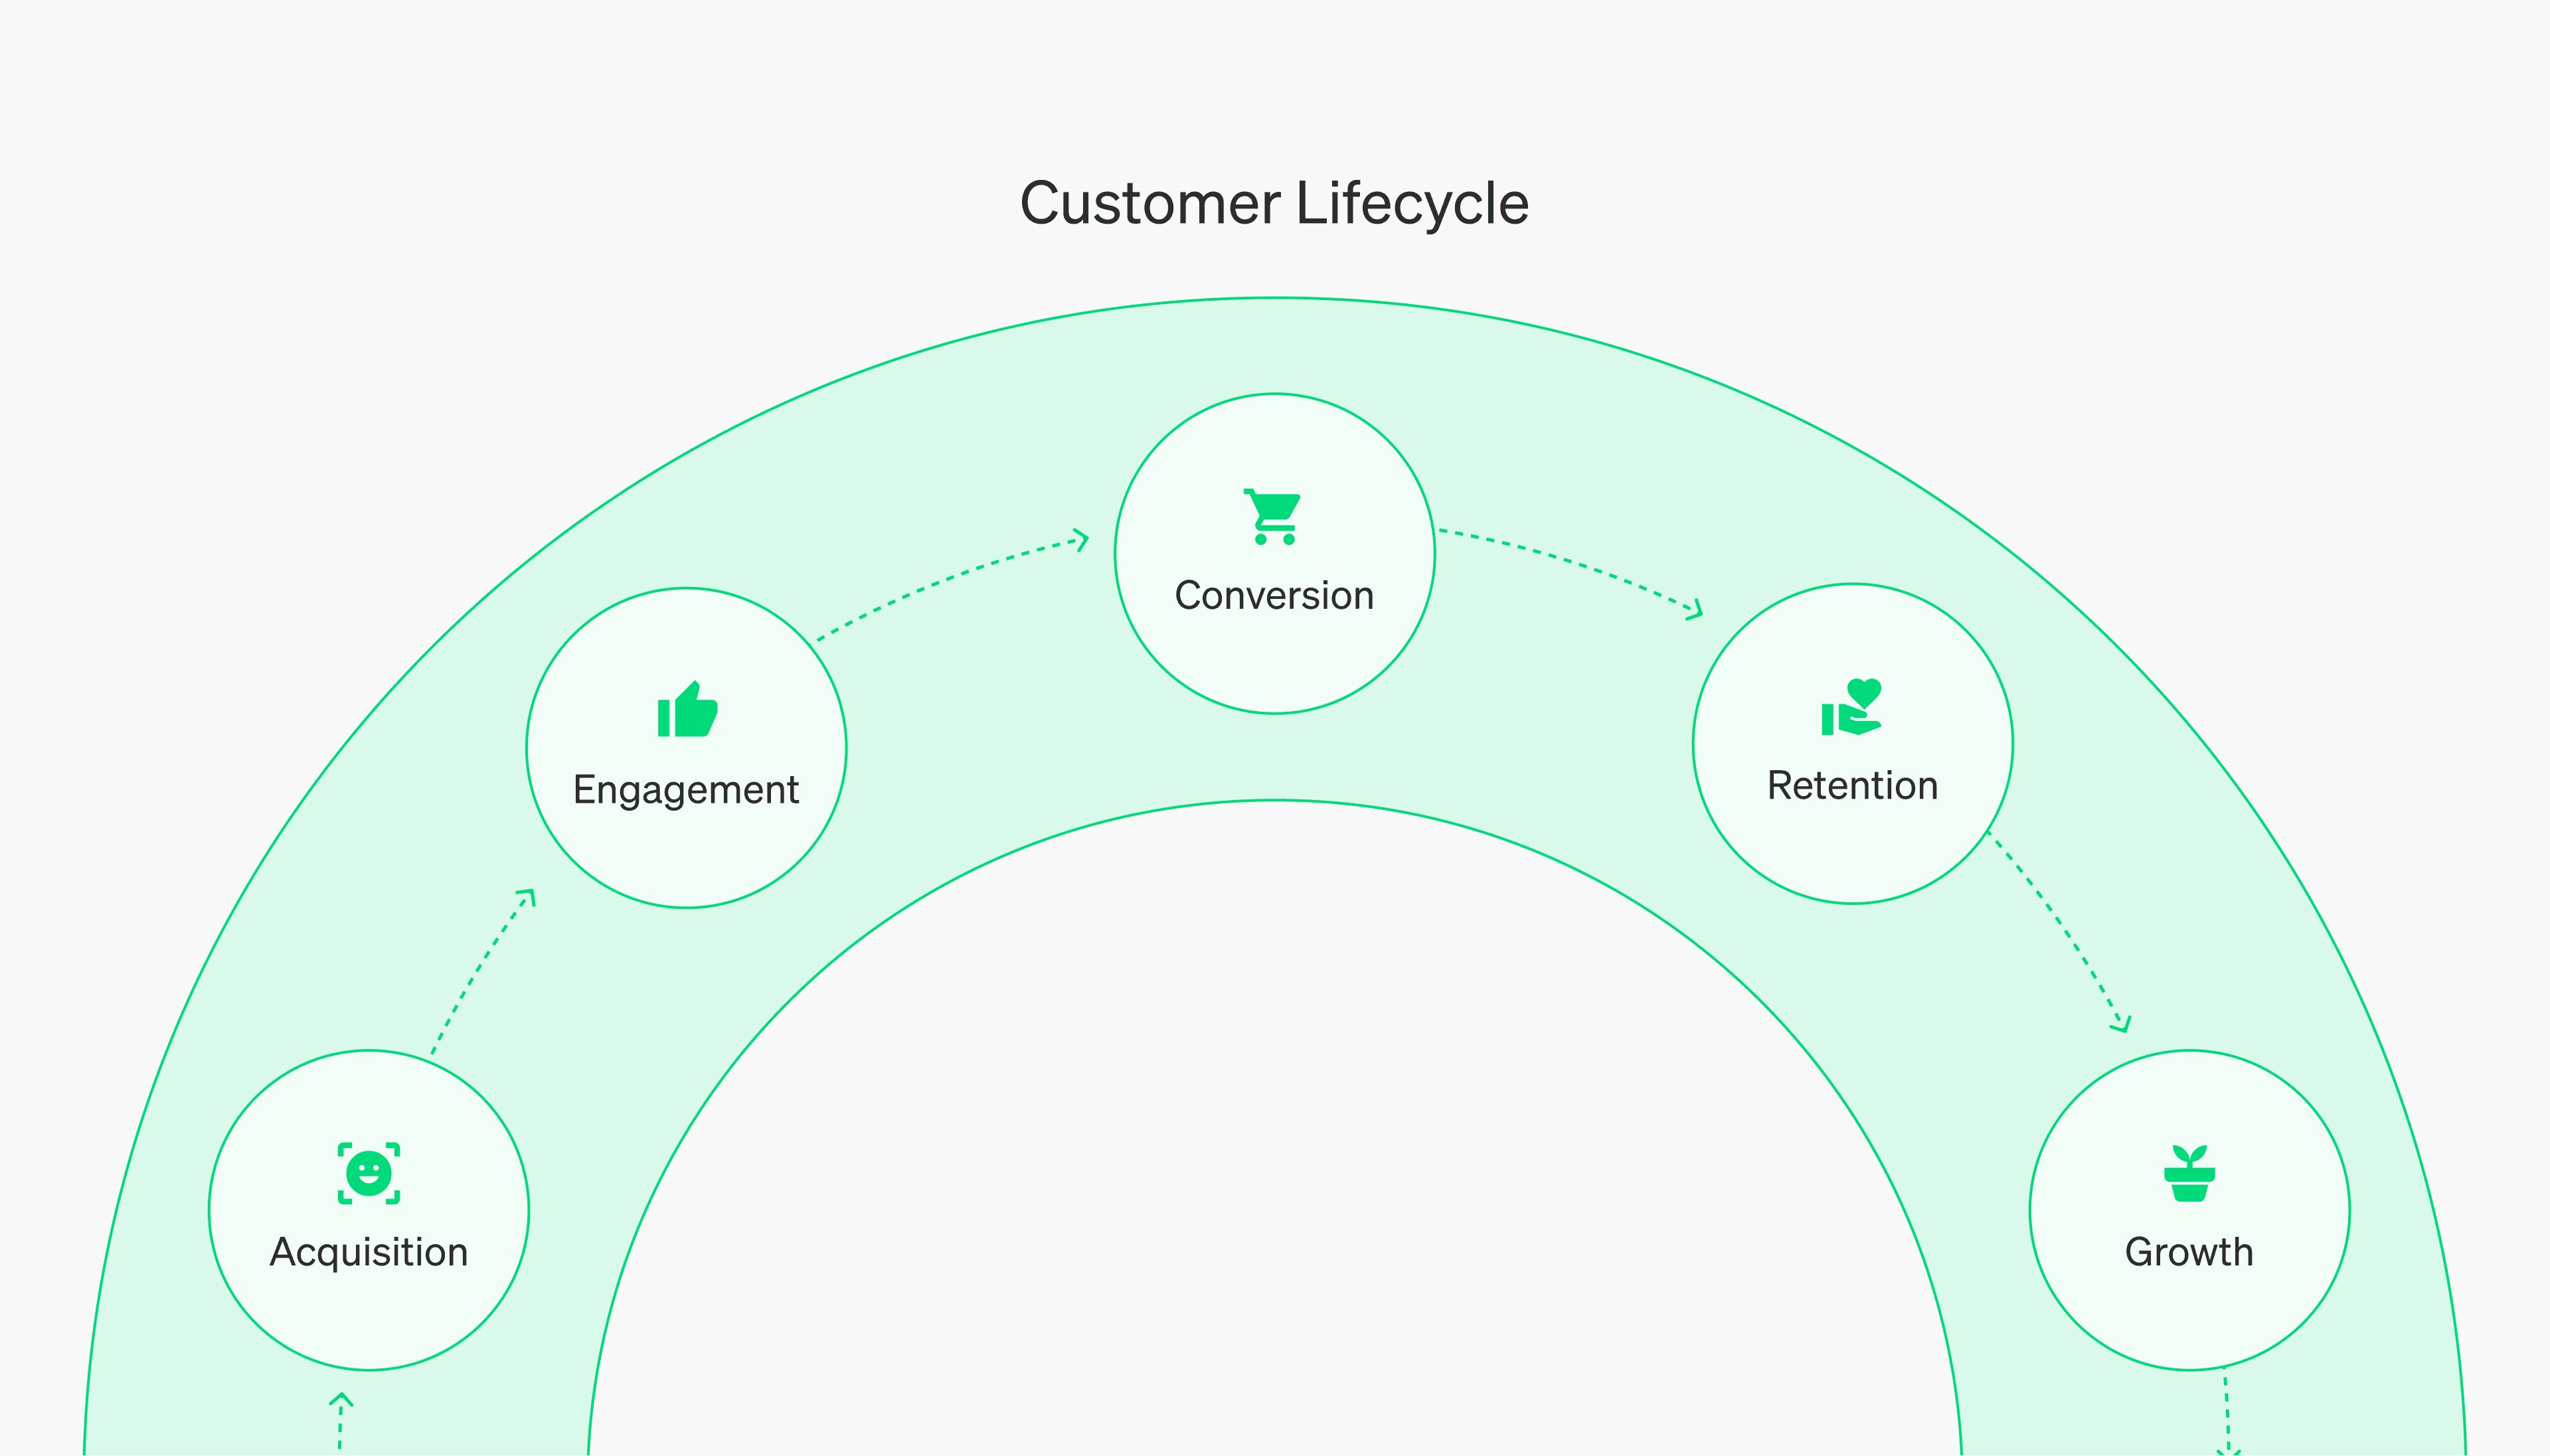
That's where the customer lifecycle comes in. From acquisition to engagement, conversion, retention, and growth, each stage represents an opportunity to measure, learn, and improve. By aligning your product analytics with this lifecycle, you can identify where customers are in their journey, pinpoint where they may be getting stuck, and uncover how small improvements can drive business impact.
Acquisition
The first stage of the customer lifecycle is about attracting new shoppers and understanding what actually leads to purchases. Measuring this stage goes beyond counting visits; the goal is to identify which channels and campaigns bring in customers who are most likely to take meaningful actions.
The metric “traffic source to purchase conversion” shows which channels (search, social, email, affiliates) are bringing in customers who complete a purchase rather than just browsing. For example, a retailer discovered that while Facebook ads drove higher traffic, Instagram visitors converted at nearly three times the rate of Facebook visitors. By shifting budget toward Instagram, they increased efficiency without increasing overall spend.
Another metric is “new user activation rate,” which measures the percentage of first-time visitors who take a meaningful step, such as adding an item to their cart or creating a wishlist. Tracking this metric helps teams see whether acquisition campaigns are simply generating traffic or actually driving engaged customers who are likely to return.
Engagement
After shoppers have landed on your site or app, the next question is how effectively they interact with your products. Engagement metrics help you see whether visitors are exploring deeply enough to find items they want, or if they’re dropping off before reaching the cart.
A key metric here is “session depth,” which looks at how many pages or products a shopper views in a session. If customers are only viewing one or two items before leaving, it could signal that search results or recommendations are not effectively connecting those customers with what they want.
Another valuable metric is the “product discovery funnel,” which tracks how shoppers move from the homepage to category pages, then to product detail pages, and finally to adding items to the cart. For example, if metrics show a high drop-off on product detail pages, the retailer can improve images and add richer customer reviews to reduce friction and keep shoppers moving further into the purchase flow.
Lastly, “repeat visits” indicate how well your store is encouraging return engagement. Customers who return within a week are far more likely to become loyal buyers, which is why many retailers design “welcome back” campaigns to quickly re-engage new visitors.
Conversion
Engagement is important, but it mainly matters if it leads to a purchase. Conversion metrics show where shoppers complete the buying process and where they drop off. These insights help teams pinpoint friction and design smoother checkout experiences.
“Cart abandonment rate” measures how often shoppers add items to their cart but leave without purchasing. High abandonment often signals issues with shipping costs, payment options, or a lack of trust in the checkout process.
“Checkout funnel” tracks drop-off rates across each step, from entering an address to selecting shipping to confirming payment. If metrics indicate that international shoppers frequently abandon their shopping carts during the shipping stage, retailers can provide clearer delivery estimates or localized shipping options to help recover lost sales.
Retailers also benefit from monitoring “promo code usage” to understand how discounts affect conversions. While promotions can drive purchases, they can also reduce average order value. Balancing these outcomes requires careful measurement of both conversion rates and revenue impact.
Retention
Winning a customer once is valuable, but long-term success depends on keeping them coming back. Retention metrics highlight how well you are building loyalty and sustaining relationships beyond the first purchase.
“Repeat purchase rate” tracks the percentage of customers who return to buy again. This is a direct signal of loyalty and the effectiveness of your retention strategies.
“Cohort retention” compares how different groups of customers behave over time. If a retailer sees that customers gained during holiday sales churn faster than those acquired at other times, a loyalty program or targeted follow-up campaign can help close that gap.
For subscription-based businesses, “churn rate” is also essential. It measures the number of customers who cancel or fail to renew, highlighting areas where improvements in onboarding, pricing, or customer experience can reduce attrition.
Growth
Retention creates a strong foundation, but growth comes from increasing the value of each customer relationship. Growth metrics show how well you are expanding customer spend and maximizing lifetime value.
“Customer lifetime value (CLV)” estimates the total revenue a business can expect from a single customer over time. Segmenting CLV by acquisition channel can reveal which campaigns attract customers who provide the greatest long-term return.
Teams can also measure “upsell and cross-sell rates,” which track how often customers add recommended items or upgrade to higher-value products. If a retailer introduces “shop the look” bundles and sees order values rise, it is a clear sign of effective growth through cross-sell.
Finally, “revenue per visitor (RPV)” provides a blended view of how much value each site or app visit generates. Tracking RPV over time helps teams understand whether improvements in acquisition, engagement, and retention are translating into measurable business impact.
Measuring and improving with LaunchDarkly
Tracking metrics is important, but the ability to act on them is what makes them powerful. LaunchDarkly brings product analytics and experimentation together so retail and e-commerce teams can both measure and improve at every stage of the customer lifecycle.
- Unify feature delivery and measurement. LaunchDarkly connects new feature rollouts directly to analytics. Teams can see in real time how a change to checkout, product recommendations, or payment options affects conversion and revenue.
- Experiment across the lifecycle. Whether testing new ad campaigns at acquisition, redesigning product detail pages for engagement, or adjusting loyalty programs for retention, LaunchDarkly makes it easy to run experiments and tie results to metrics that matter.
- Leverage warehouse-native experimentation and analytics. LaunchDarkly integrates directly with your data warehouse so you can measure product metrics like conversion, repeat purchase rate, and lifetime value alongside your existing business data. This approach gives teams a single source of truth, enables holistic analysis across behavioral and financial metrics, and helps ensure that sensitive data stays secure while still powering deep insights.
LaunchDarkly enables retail and e-commerce leaders to do more than track the customer lifecycle. Applying data provided through specific metrics helps users to safely test new ideas, measure their impact, and double down on what works. Sign up for a product demo today.
Like what you read?
Get a demo