
Example metrics
This guide provides examples of metrics you can use with LaunchDarkly features such as Experimentation and guarded rollouts.
Metrics measure audience behaviors in your app or product and how those behaviors are affected by different flag variations. You can use metrics to track all kinds of things, from how often end users access a URL to how long that URL takes to load a page. How you set up a metric varies depending on what you want to measure. The examples included in this guide will help you understand how to configure metrics to meet your business needs.
To learn more about creating metrics, read Creating metrics.
Examples: average purchase price per user
This section includes the configuration options for common custom numeric metrics related to average purchase price per user. For all of the examples in this section, the randomization unit is “user.”
Average purchase price per user: only users who made a purchase
Expand Average purchase price per user: only users who made a purchase
You can use this custom numeric metric to learn the average amount of money spent by users who made a purchase.
The metric configuration options include:
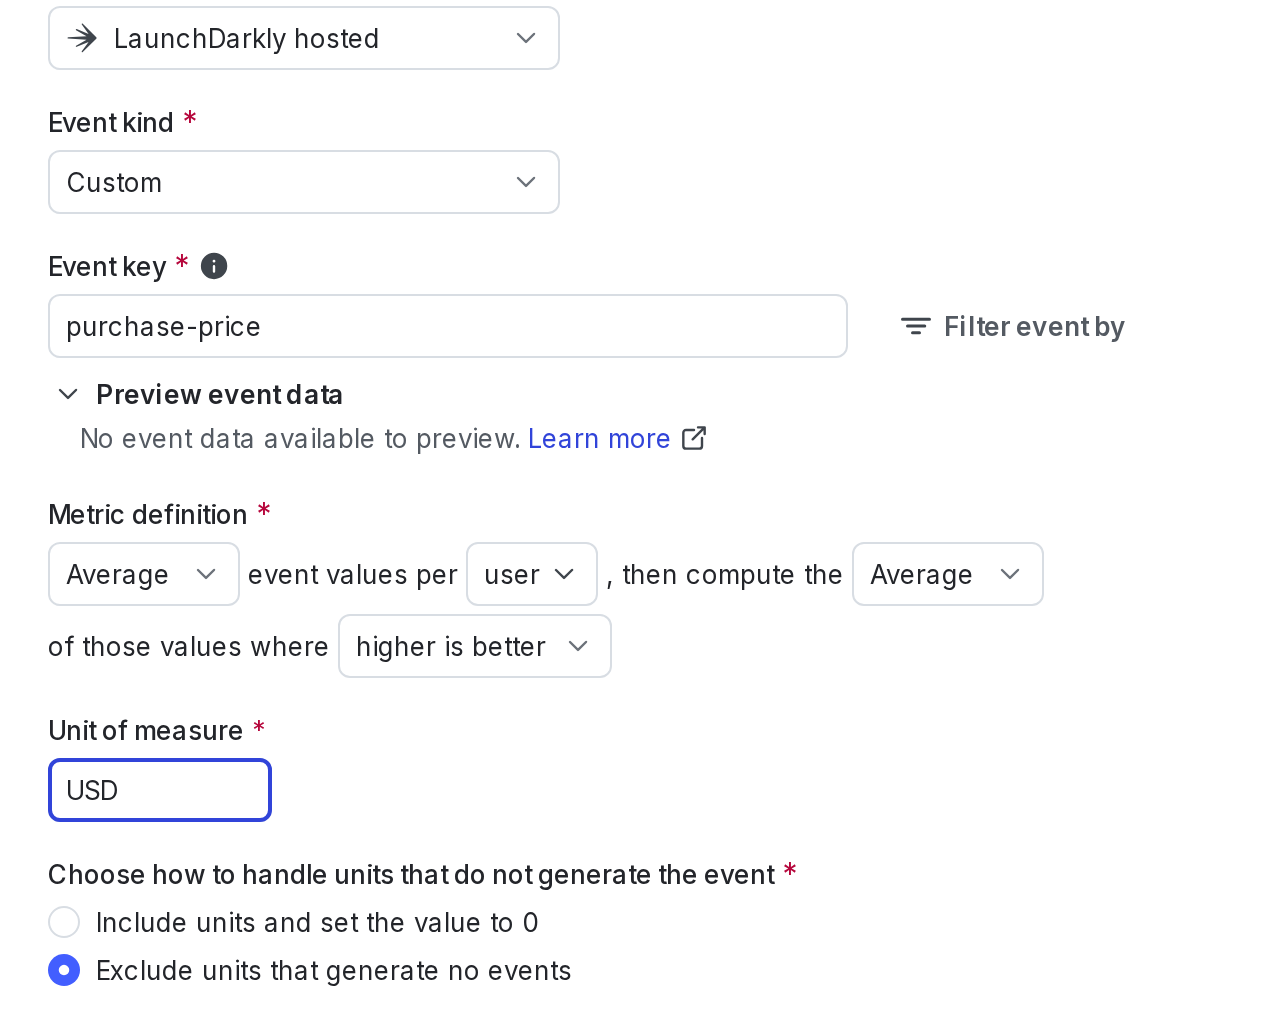
Event kind: Custom
Definition: Average event values per user, then compute the Average of those values where Higher is better
Units without events: Excluded
Here is what the metric setup looks like:
Here is an example of how the metric calculates its results:
This means that buyers spend an average of $9.
Average purchase price per user: all users
Expand Average purchase price per user: all users
You can use this custom numeric metric to learn the average amount of money spent by all users, whether or not they made a purchase.
The metric configuration options include:
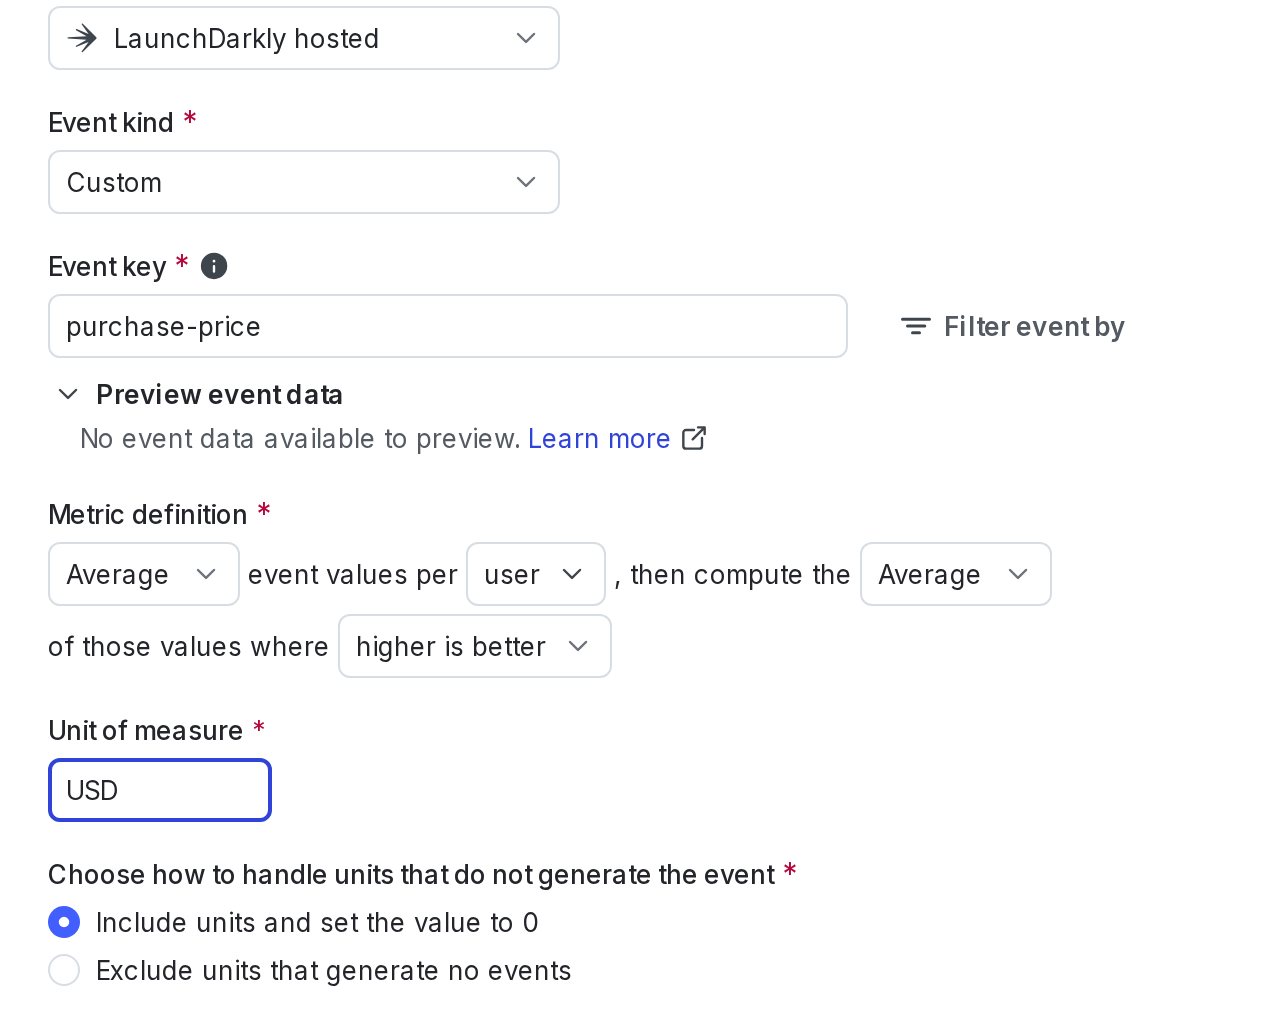
Event kind: Custom
Definition: Average event values per user, then compute the Average of those values where Higher is better
Units without events: Include units and set the value to 0
Here is what the metric setup looks like:
Here is an example of how the metric calculates its results:
This means that all users, including buyers and non-buyers, spend an average of $6.75.
Example: percentile purchase price per user
This section includes the configuration options for a custom numeric metric related to percentile purchase price per user. For the example in this section, the randomization unit is “user.”
Expand Percentile purchase price per user
You can use percentile analysis with frequentist experiments that use sequential testing.
You cannot use percentile analysis with Bayesian experiments or with frequentist experiments that don’t use sequential testing.
In this example, you are only interested in learning about your typical spenders and want to exclude the few customers who spend significantly more than most and skew your data upward. This metric calculates the amount of money that 90% of your customer base spends less than.
This custom numeric metric only includes users who made a purchase. When using a percentile analysis method, LaunchDarkly automatically excludes units without events.
The metric configuration options include:
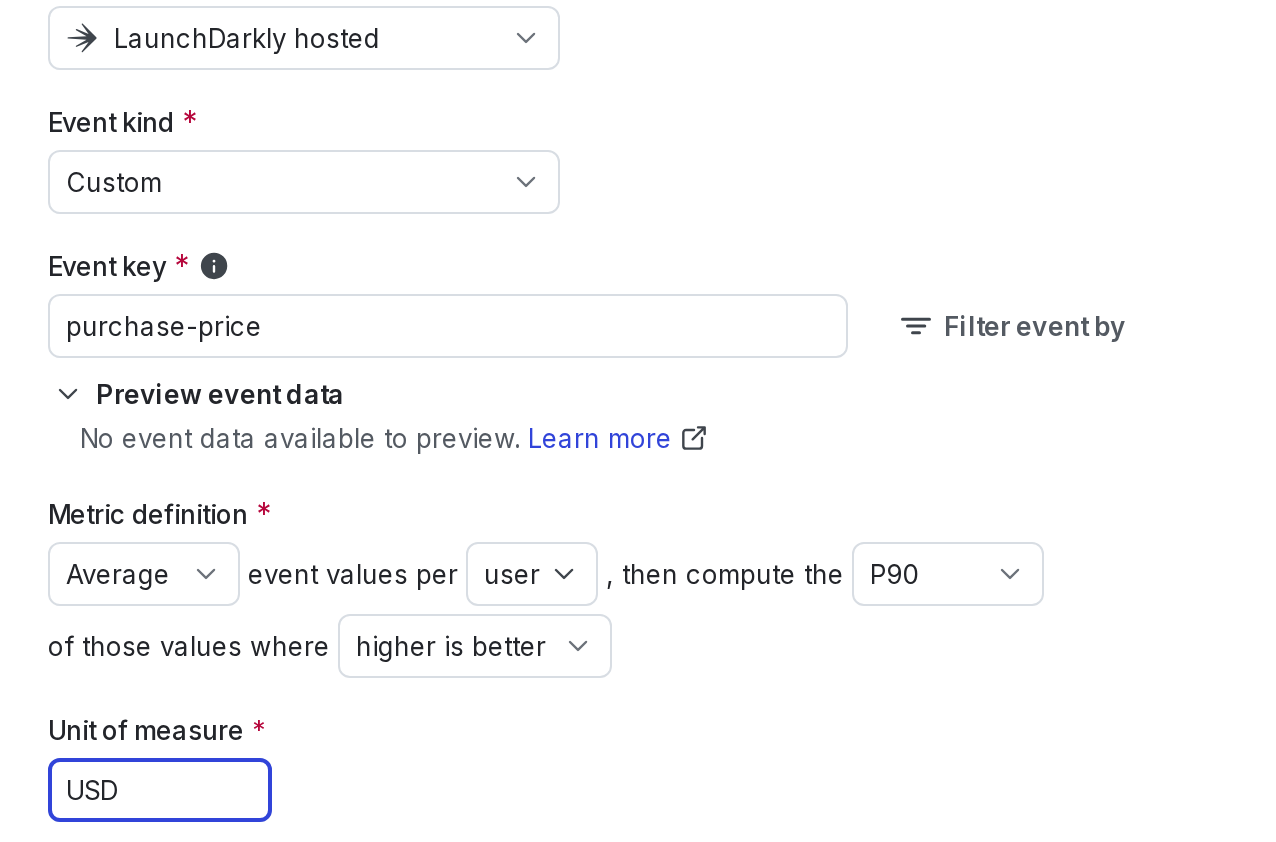
Event kind: Custom
Definition: Average event values per user, then compute the P90 of those values where Higher is better
Here is what the metric setup looks like:
Here is an example of how the metric calculates its results:
This means that 90% of all users that make a purchase spend less than $85.
Examples: average revenue per user
This section includes the configuration options for common custom numeric metrics related to average revenue per user. For all of the examples in this section, the randomization unit is “user.”
Average revenue per user: only users who generated revenue
Expand Average revenue per user: only users who generated revenue
This custom numeric metric sums purchase amounts per user who bought something, instead of calculating average amounts per purchase. This lets you find out about the purchasing behavior of users as a whole, ignoring whether the money they spent was all at once or spread between multiple purchases.
The metric configuration options include:
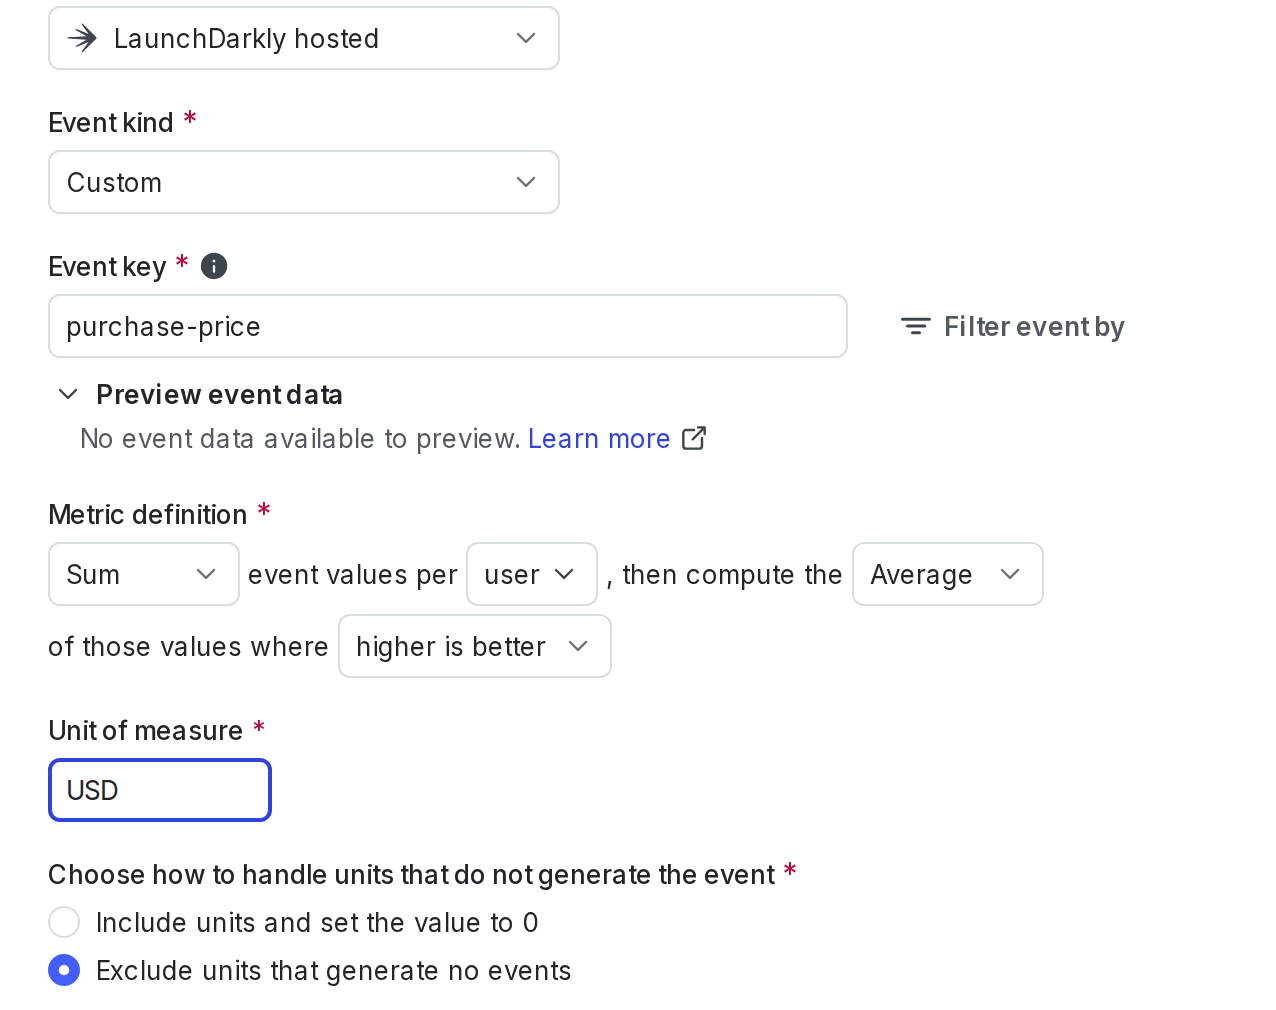
Event kind: Custom
Definition: Sum event values per user, then compute the Average of those values where Higher is better
Units without events: Excluded
Here is what the metric setup looks like:
Here is an example of how the metric calculates its results:
Average revenue per user: all users
Expand Average revenue per user: all users
This custom numeric metric sums purchase amounts per user, instead of calculating average amounts per purchase. This lets you find out about the purchasing behavior of users as a whole, ignoring whether the money they spent was all at once or spread between multiple purchases. This includes users who didn’t purchase anything.
The metric configuration options include:
Event kind: Custom
Definition: Sum event values per user, then compute the Average of those values where Higher is better
Units without events: Include units and set the value to 0
Here is what the metric setup looks like:
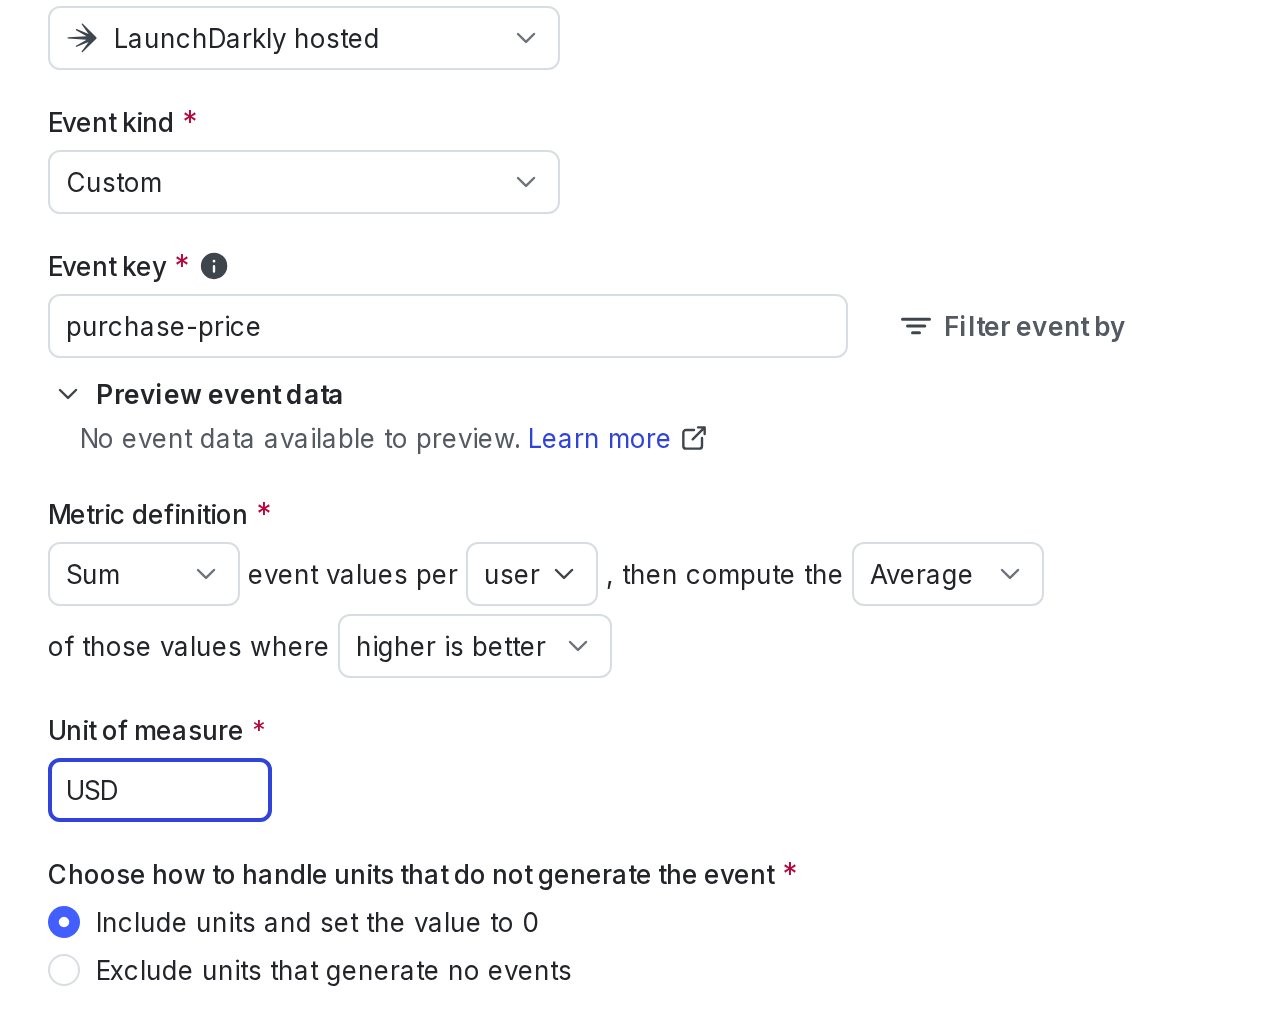
Here is an example of how the metric calculates its results:
Example: average number of purchases
This section includes the configuration options for common custom conversion binary metrics related to average number of purchases. For the example in this section, the randomization unit is “user.”
Average number of purchases: per user who purchased
Expand Average number of purchases: per user who purchased
You can use this custom conversion binary metric to learn the average number of purchases for users who made a purchase.
The metric configuration options include:
Event kind: Custom
Definition: Count events per user, then compute the Average of those values where Higher is better
Here is what the metric setup looks like:
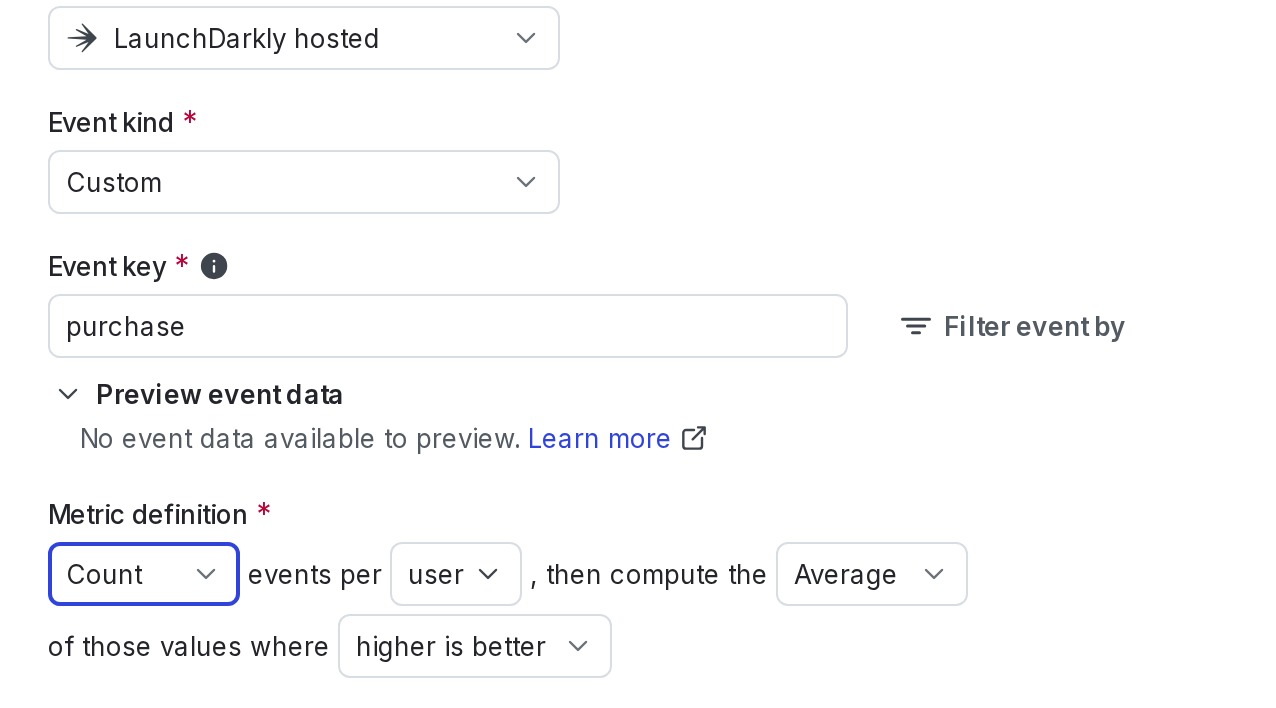
Here is an example of how the metric calculates its results:
Example: latency
This section includes the configuration options for common custom numeric metrics related to latency time. For the example in this section, the randomization unit is “request.”
Latency excluding the slowest 1% of results
Expand Latency excluding the slowest 1% of results
You can use percentile analysis with frequentist experiments that use sequential testing.
You cannot use percentile analysis with Bayesian experiments or with frequentist experiments that don’t use sequential testing.
This custom numeric metric calculates latency, excluding the slowest 1% of requests that may skew the data. When using a percentile analysis method, LaunchDarkly automatically excludes units without events.
The metric configuration options include:
Event kind: Custom
Definition: Average event values per user, then compute the P99 of those values where Higher is better
Here is what the metric setup looks like:
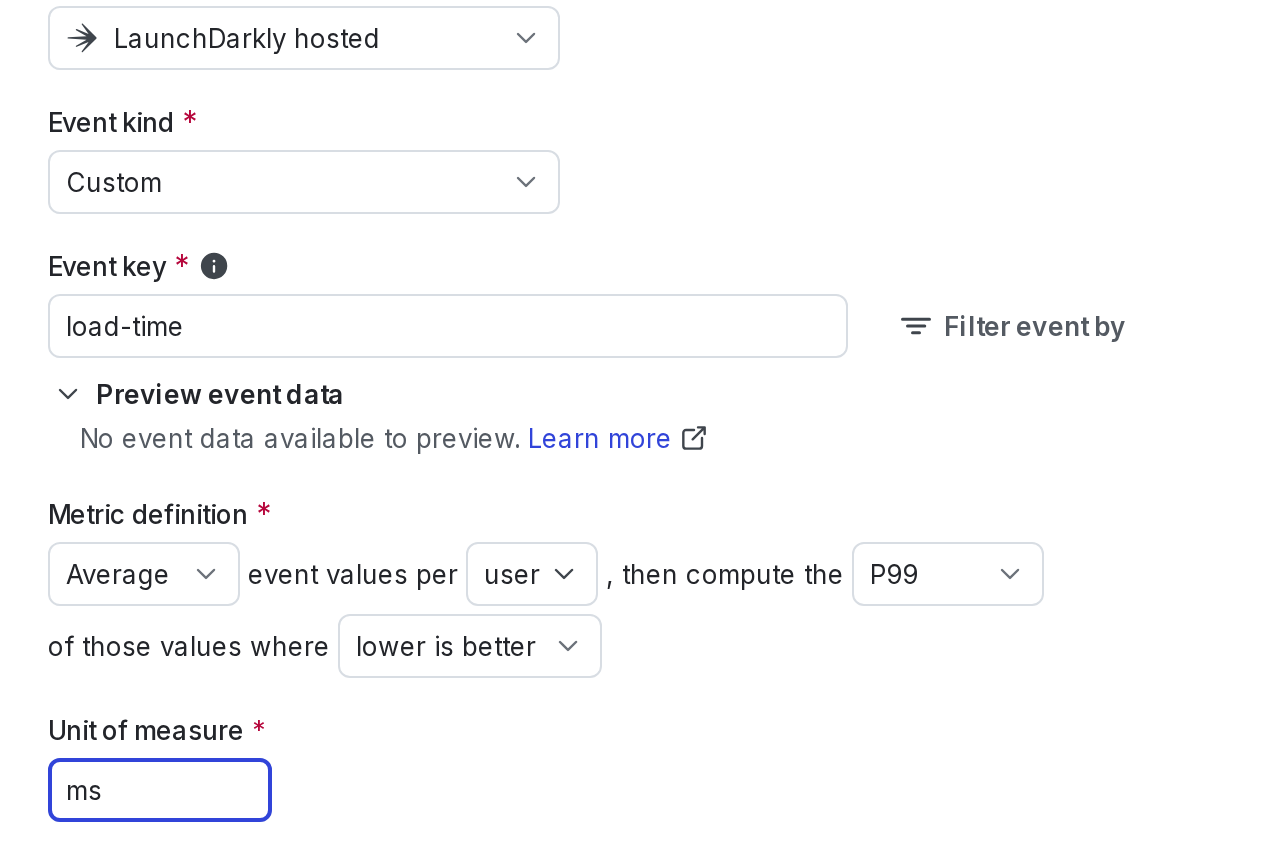
Here is an example of how the metric calculates its results:
This means that 99% of requests, on average, have a latency of less than 70ms.
Conclusion
The guide explained how to set up metrics to help answer common questions about your app’s revenue and latency performance. For more examples of experiments you can run, read Example experiments.
Your 14-day trial begins as soon as you sign up. Get started in minutes using the in-app Quickstart. You’ll discover how easy it is to release, monitor, and optimize your software.
Want to try it out? Start a trial.