Analyzing experiments
Overview
This topic explains how to interpret an experiment’s results and apply its findings to your product.
Experiment results data
The data an experiment has collected is represented in its Results tab. The Results tab provides information about each variation’s performance in the experiment, how it compares to the other variations, and which variations are likely to be best or beat the control out of all the tested options. Understanding how to read this tab can help you make informed decisions about when to edit, stop, or choose a winning variation for your experiments.
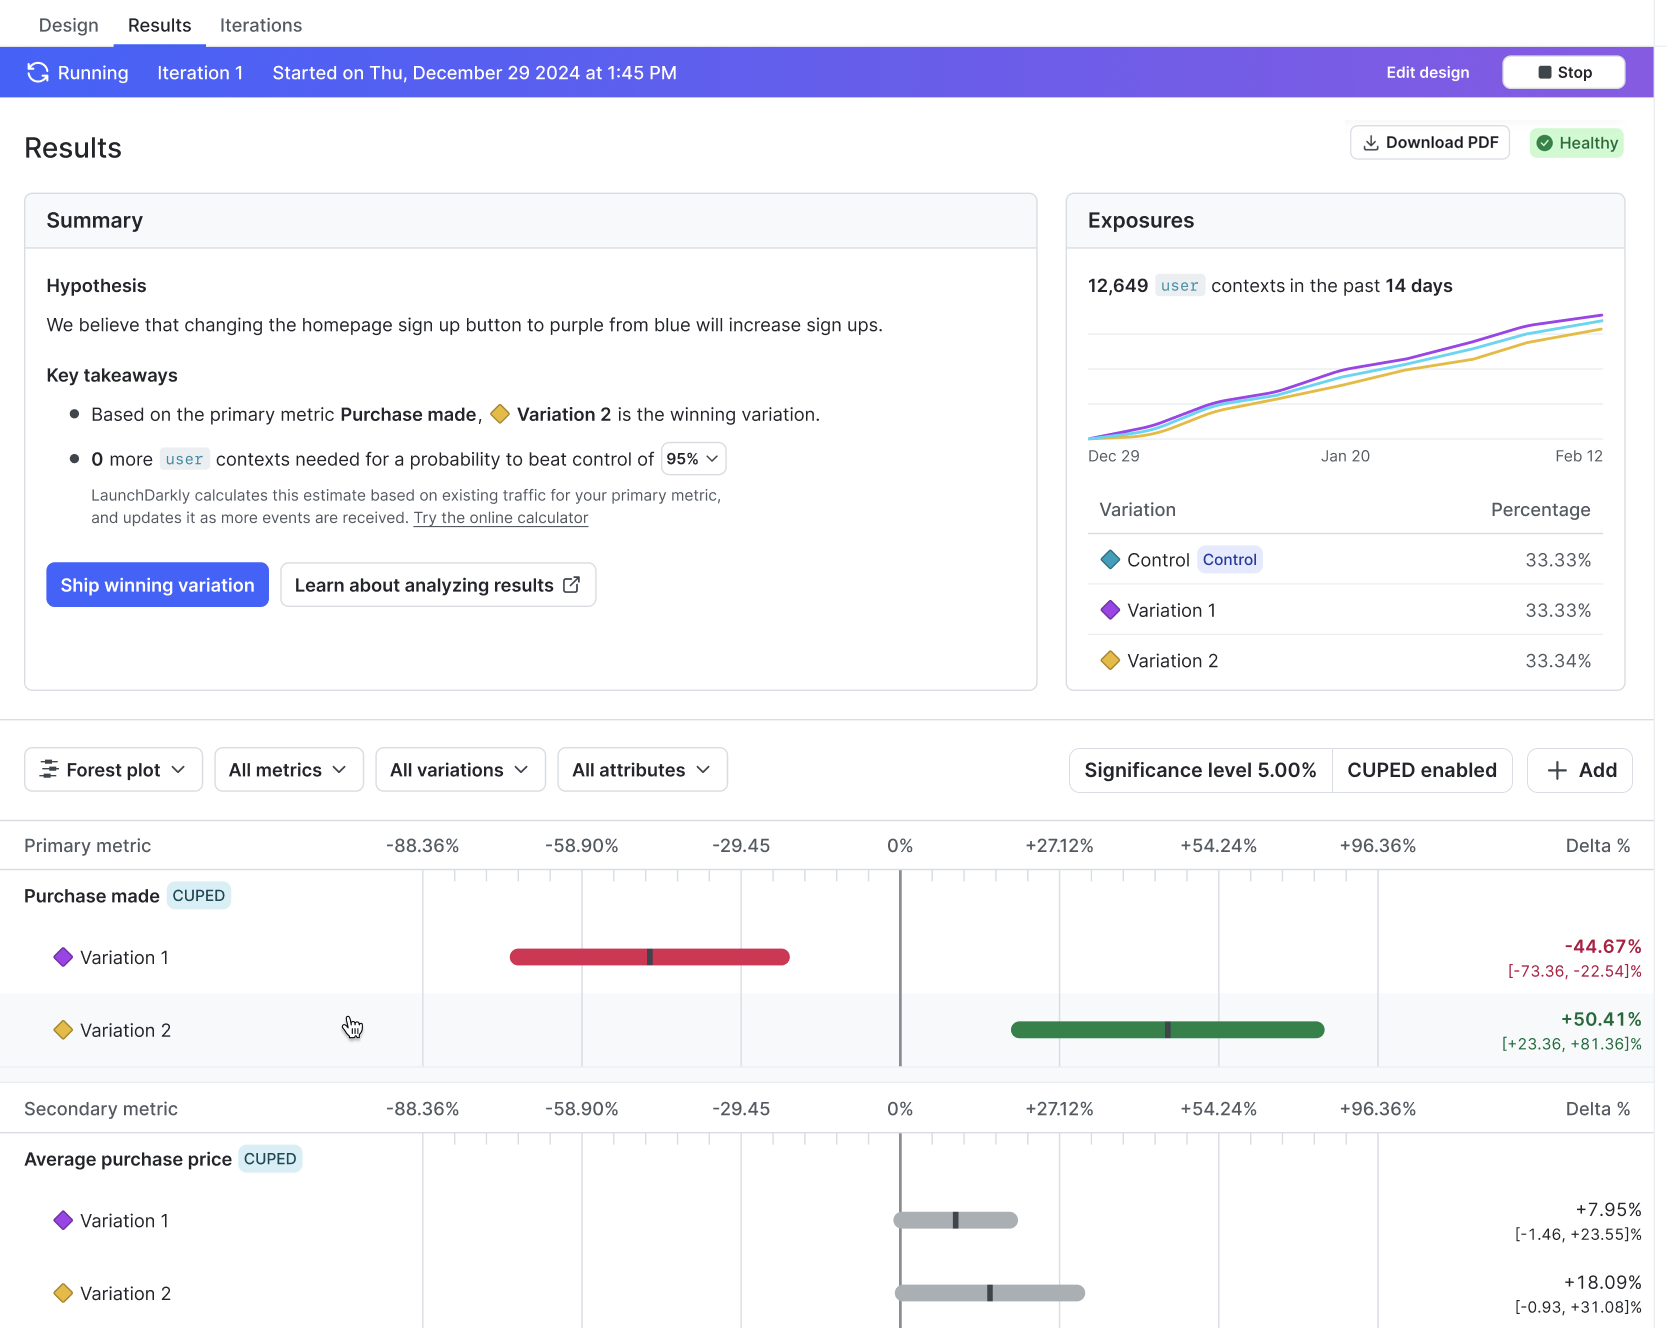
Here is an example Results tab for an experiment:

Summary
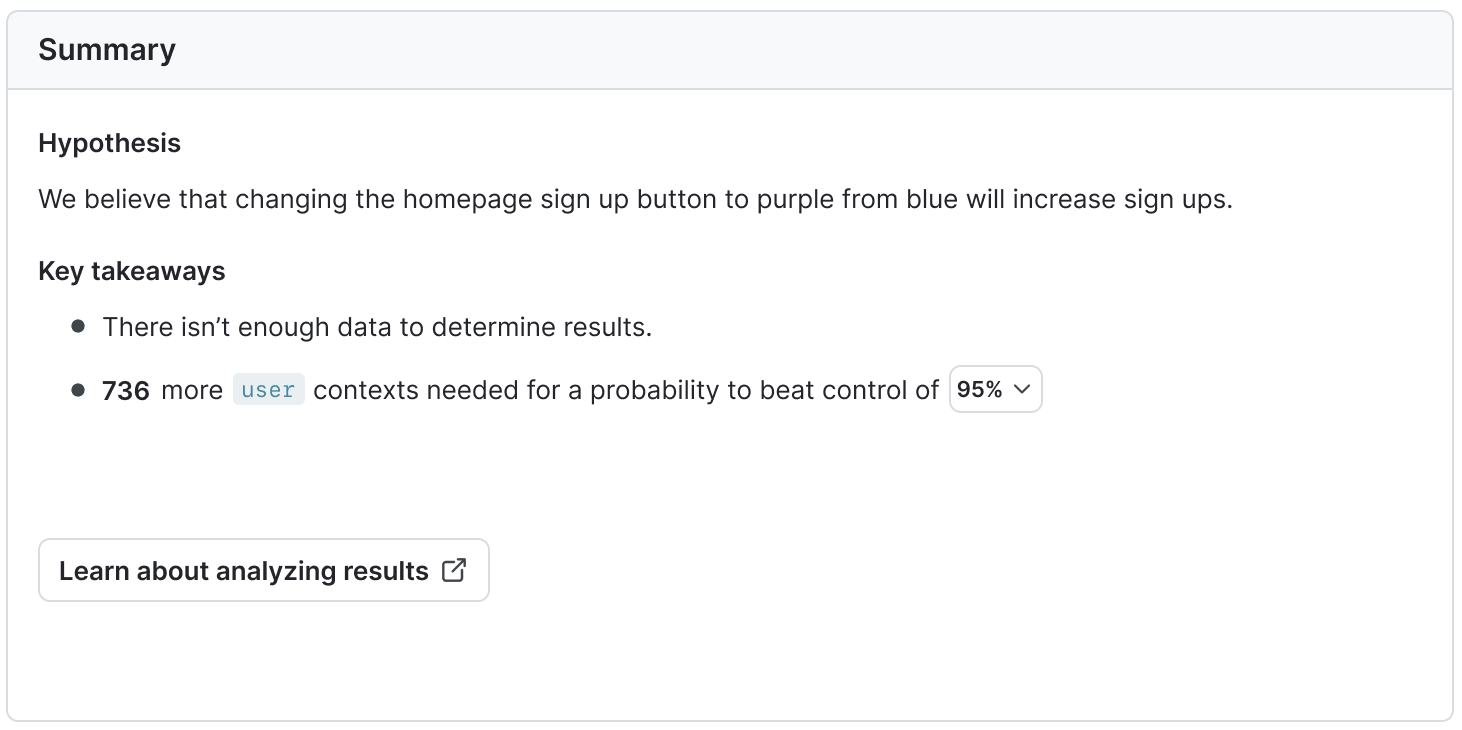
The “Summary” section displays the experiment’s hypothesis and key takeaways, including whether or not you have enough data to determine a winning variation for the experiment.
Bayesian experiments
For Bayesian experiments, the summary includes a sample size estimator that gives an estimate of how much more traffic needs to encounter your experiment before reaching your chosen probability to be best. To learn more, read Sample sizes for Bayesian experiments.

Exposures
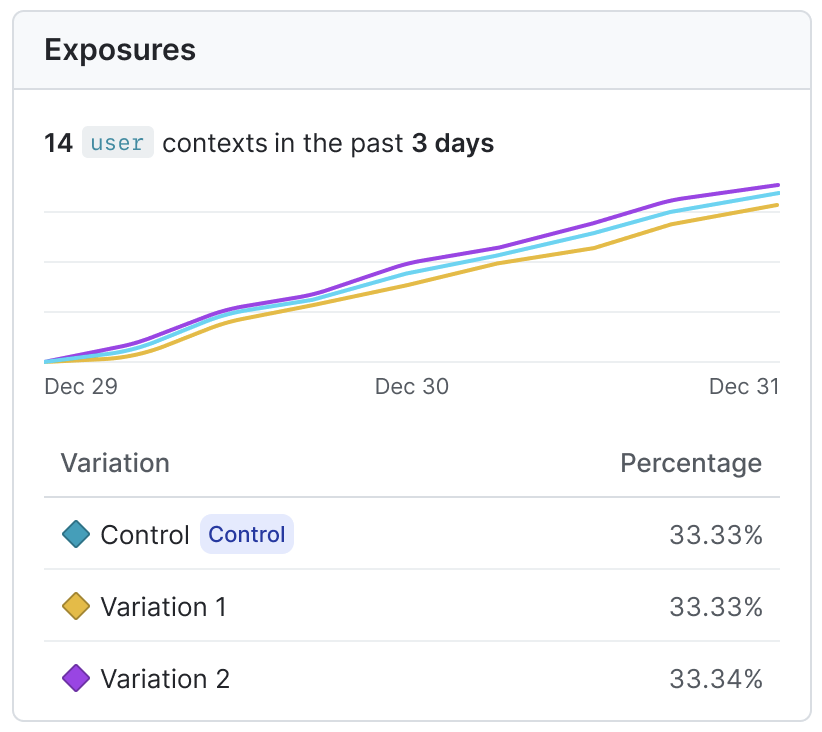
The “Exposures” section displays the percentage of contexts exposed to each variation over time. To learn more, read Experiment sample size and run time.

Statistics information
The following statistics information displays above the results tables:
- Significance level (frequentist experiments only): The range of values within which, if you repeated the experiment many times, would contain the true value of the relative difference between the treatment and the control. To learn more, read Frequentist experiment results.
- Threshold (Bayesian experiments only): The threshold represents how confident you want to be in an experiment’s results before making a decision. The threshold determines the width of your credible intervals, and when LaunchDarkly declares a variation the winning variation. when You select your desired threshold when you create an experiment. To learn more, read Bayesian experiment results.
- SRM: Specifies if LaunchDarkly has detected a sample ratio mismatch (SRM). SRMs indicate that there may be an issue with the implementation of your JavaScript-based SDKs. To learn more, read Sample ratio mismatch.
- CUPED: Specifies if LaunchDarkly has enabled covariate adjustment (CUPED) for this experiment. CUPED increases measurement precision in experiment results. To learn more, read Covariate adjustment and CUPED methodology.
- MCC (frequentist experiments only): Specifies if you have multiple comparisons correction (MCC) enabled to help reduce false positives in your experiment.
- To toggle off MCC on a running or completed experiment, click on the pencil icon above the “Exposures” section and uncheck the Multiple comparisons correction checkbox.
- Sequential testing: (Frequentist experiments only) Whether or not you have enabled sequential testing to allow you to act on the results at any time.

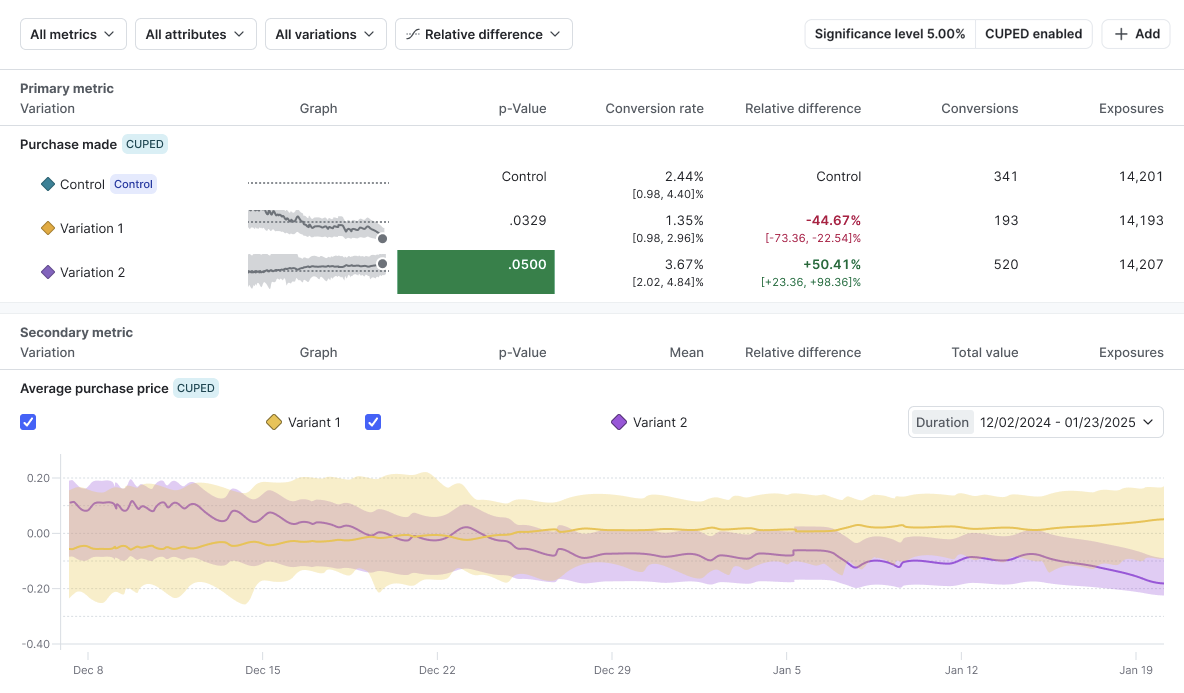
Results table
An experiment’s results table displays each variation’s performance in the experiment. You can choose to view the results by forest plot, arm averages, probability density, or relative difference.
To learn more, read Bayesian experiment results and Frequentist experiment results.

Further analyzing results
You can further analyze your results using Data Export or by implementing qualitative user feedback.
Data Export
If you’re using Data Export, you can further analyze your experiment data using third-party tools. To learn more, read Data Export.
Qualitative user feedback
Experimentation provides useful quantitative feedback, but you may be interested in gathering qualitative feedback as well. To do this, you can configure your application to send user feedback to LaunchDarkly. To learn how, read Collecting user feedback.