


For the previous article, please see: Building a Culture of Experimentation: Don't Penalize Measurement
One of the most exciting things about getting an experimentation program up and running is that it’s one place in business where moves in KPIs have a direct tie-in to business value.
Of course, I’ve been in many business meetings over the course of my career where a chart or dashboard is put on screen that shows that this new feature added some extremely high revenue numbers, to great applause and back-patting around the table.
On the side of the meeting, in some Slack or Teams chat, there are likely data people frantically asking where/how someone arrived at that number, trying to make sure it wasn’t their data that had just been so spuriously correlated to revenue.
Those are the places I like to try and ask questions – probably to the annoyance of the backpatters – how we arrived at the value quantification on screen, and how we were sure to control for the million outside factors at play when our feature hit the market.
Did we forget to factor in the increase in marketing spend that happened just before the rollout? Did we roll our feature out as a part of a massive product release, where hundreds of new features were all being introduced to the customer at once? How can I confidently state that it was MY feature that caused all of this new money to come flowing in? What about the others?
Experimentation enables you to be much more confident that the results you’re seeing can be causally attributed to the new tactic that you released. An experiment creates robust new data about how users reacted to your product with, and without, your new feature, and by capturing data about:
- which user interacted with our new feature
- which user did not
- what did the user do after they interacted with our feature?
Thanks to that group of folks who didn’t get the opportunity to interact with your new feature (that is, the control group), you’ll soon be making more confident decisions — because with a little help from statistics and the law of large numbers, you can control for the other things that might muddy the waters.
How do you do that? Randomly.
By making sure that the only thing differentiating whether or not a customer gets to interact with your feature is just the flip of the proverbial coin, you’re removing all of those “but what about customers that…” questions.
In experimentation, we lean on the Law of Large Numbers, which says:
As the number of identically distributed, randomly generated variables increases, their sample mean (average) approaches their theoretical mean.
In other words, large enough populations can start to look alike across all the fiddly bits when they’re randomly assigned into groups.
So how does this help with value quantification and ROI?
One of the more powerful things in an experiment is that — if you understand your business — it can give you actionable information on your ROI. You have direct data that tells you how your control and treatment(s) actually performed in the market, and this becomes a very compelling story when you can start to tie in the value driven by your initiative.
There are a few different flavors of experiment value quantification that I like to use as a quick way to communicate the impact of an experiment, and they can be really straightforward to calculate.
For a “winning” experiment
(number of users exposed to the treatment) * (incremental value of a user on your target KPI) = Value created by the experiment
For a “losing” experiment
(number of users exposed to the control) * (incremental loss of a user on your target KPI) = Risk avoided by the experiment
Null result - ie. you could not confidently detect differences between control and treatment
(number of hours typically spent chasing through large amounts of data to find some additional fact that will help you “force” the treatment to look like it won) * (Data Analysts hourly salary) = Cost of productivity lost
As an example, let’s say we’re testing a hypothesis:
“We believe if we display a banner ad at the top of our page to draw attention to our brand new product line, we will drive purchases and increase our average total checkout price. We’ll measure it via average customer checkout price.” Pretty simple.
We run an experiment to test the results and collect the data; a simple 50% / 50% experiment for our 24 million customers. We run the experiment for a week, and we know we won't see every single customer over the course of that week, but we know that we tend to serve 500k users per week in our application. That means 250k users will see our existing experience (control group) and 250k users will see our new one (treatment group).
Let’s say, for ease of calculation, that over the course of our experiment we find that the treatment customer (those who saw our banner ad) spent an average of $10 more in comparison to our control customer (those who did not see our banner ad).
“Winning” experiment (treatment outperforms the control):
- 250,000 users in control: 50,000 users purchased at an average of $30
- 250,000 users in treatment: 50,000 users purchased at an average of $40
- 50,000(treatment) purchases * $10 = $500,000 – incremental value driven by treatment
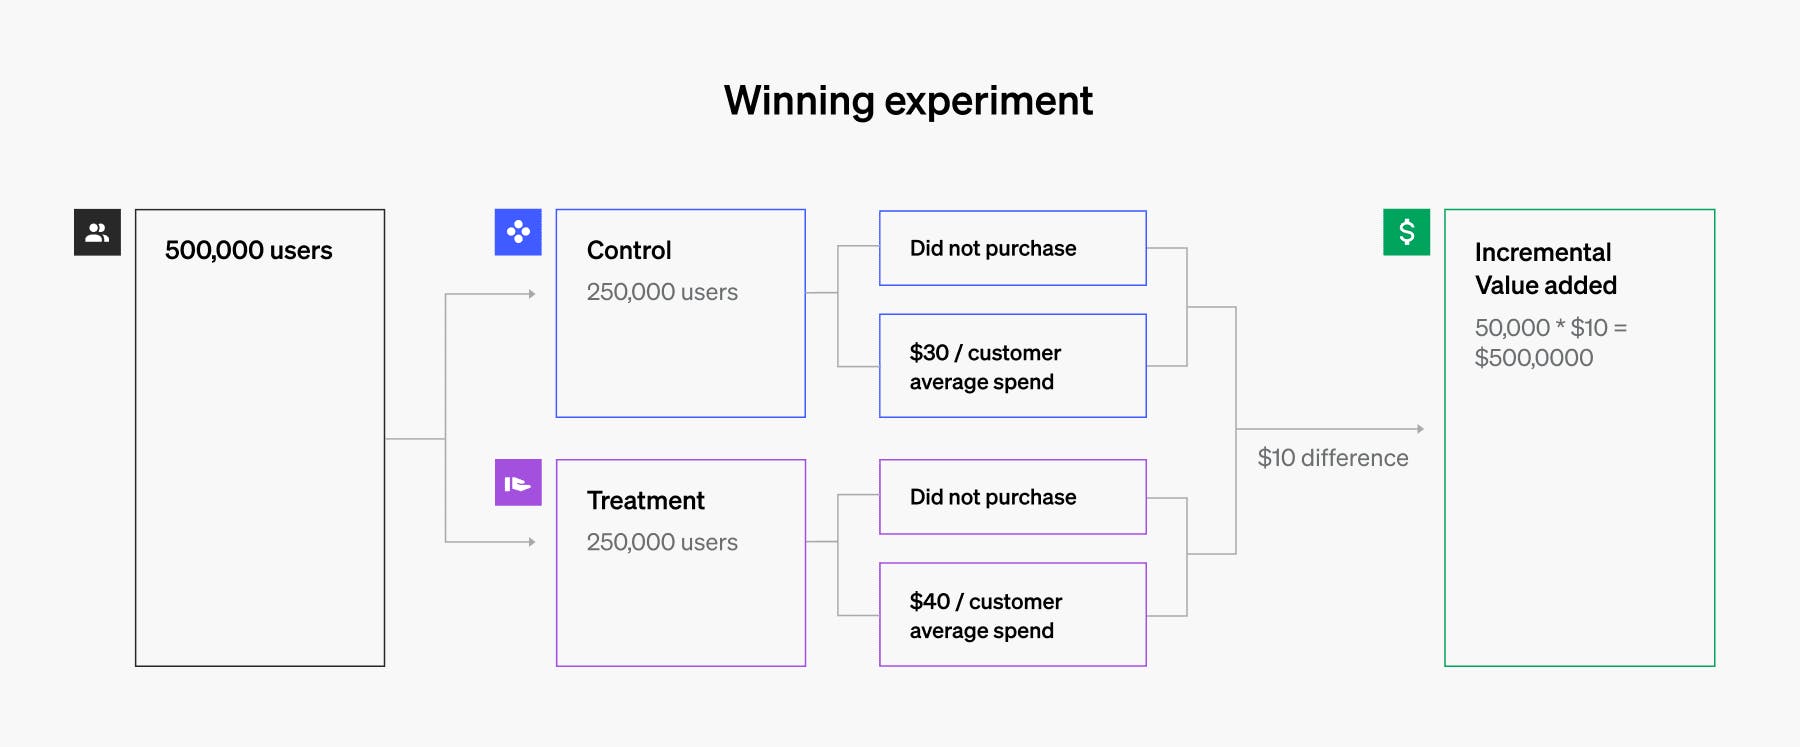
Winning experiment example
However, let’s say that over the course of our experiment we find that the control customer (those who did not saw our banner ad) spent an average of $10 more in comparison to our treatment customer (those who did our banner ad).
“Losing” experiment (control outperforms treatment):
- 250,000 users in control: 50,000 users purchased at an average of $40
- 250,000 users in treatment: 50,000 users purchased at an average of $30
- 50,000(control) purchases * $10 = $500,000 – saved by having 50% in our control
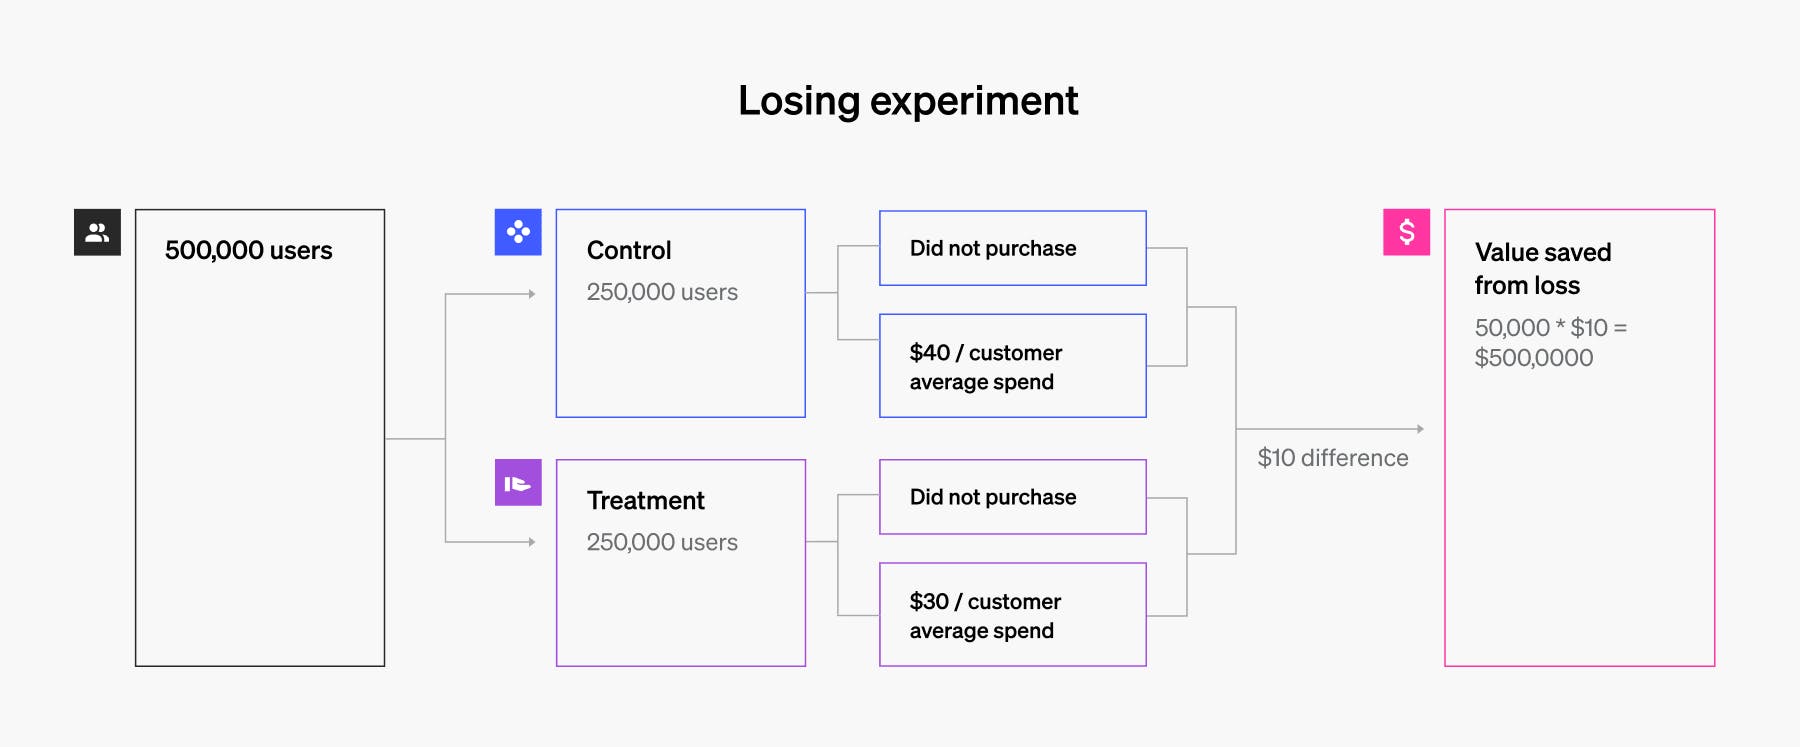
Losing experiment example
And finally, let’s say that over the course of our experiment we find that the control customer (those who did not saw our banner ad) spent on average the exact same to our treatment customer (those who did our banner ad). Or we didn’t reach enough confidence in our measurement - ie. a null result.
“Null result” experiment (control and treatment not significantly different):
- 250,000 users in control: 50,000 users purchased at an average of $40
- 250,000 users in treatment: 50,000 users purchased at an average of $40
- 1 data analyst 80h hourly salary) + (productivity lost toward new features) = Costly
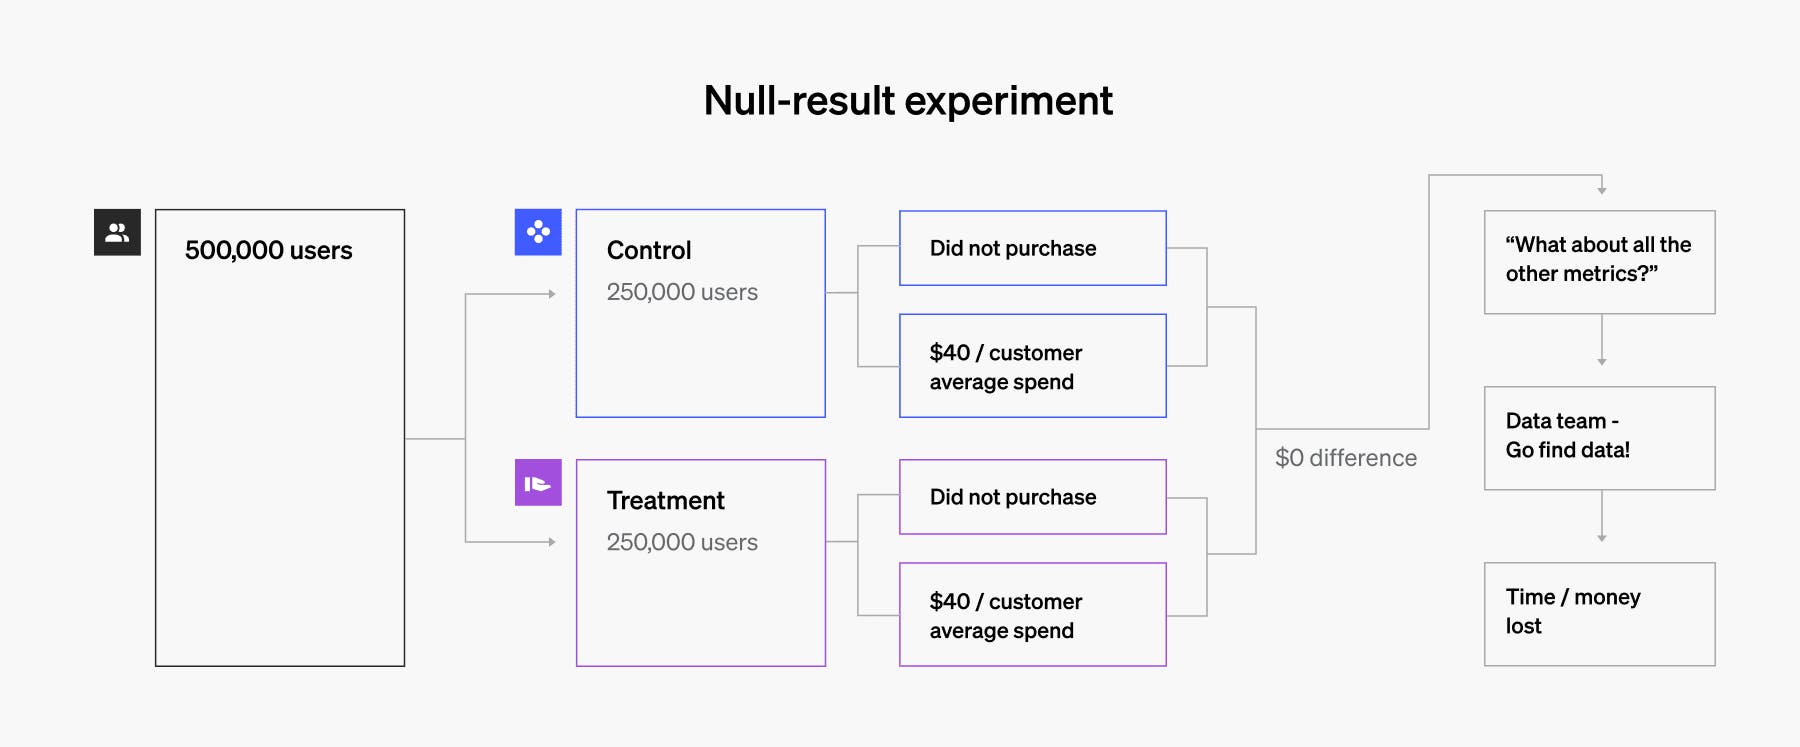
Null experiment example
And if you have a good idea on your annual volume, you can easily annualize the number to get a much better estimate of what the impact of this feature will add over the next year.
How can it be this easy?
Well, for a winning experiment, you have already exposed a percentage of your audience to your new feature, and have measured actual value added to your bottom line by this new feature.
For a losing experiment, by controlling your release, a percentage of your users still interacted with the better performing (control) feature, so you have actually reduced your losses by keeping them in the control group.
But here’s the magic:
Because you ran an experiment, you can numerically show how much risk you helped avoid by not releasing the feature to your full audience!
If you had just rolled out the new feature without an experiment, 100% of your audience would have been exposed to the new feature (which you and you can calculate the loss that you saved by not releasing the feature!
I’ll admit: the null-result calculation is harder to quantify unless you have been doing some really great data tracking on your own time. But the concept should resonate to anyone who has spent hours analyzing a before/after measurement looking for some sort of signal that the feature worked.
In my experience, businesses are typically convinced that their ideas are all winners. But, if they don’t have clear data (generated via experiment), they will tend to send people to hunt for the data to justify their success, which can take a long time and tie up valuable data resources..
I love digging into data to understand what happened, but that shouldn’t be done under the guise of trying to provide accurate results. It should identify other hypotheses to test things that didn’t exactly line up with your expectations. These investigations often lead to new features!
When you can start to get very real dollars attached to your experiments, you can really do things like:
- Prioritize features to align with what customers are actually looking for
- Get very real ROI numbers attached to your product delivery
Now, in the example I gave above, I used both a large impact ($10 dollars is a large jump in cart price) and a large volume of users (500,000 users) and I did so to make the math both easy, and of course, impactful.
But quite a few experiments are run against smaller volumes, and have a much smaller impact. That doesn’t mean the learning is less valuable! And you are still measuring real impact. You are capitalizing on working treatments, and you have strong evidence to prove that you are moving in the right direction. Plus small gains add up over time.
Not every experiment is a home run, but a lot of value can still be added by an experimentation program.
Like what you read?
Get a demo