

Restricted to Snowflake native metricsYou can create count distinct metrics only from Snowflake native metric data sources. This metric type is not available for metrics created from LaunchDarkly hosted events, page viewed conversion metrics, clicked or tapped conversion metrics, or metrics created from traces. To learn more, read Metric event sources.
About event-level percentile metrics
An event-level percentile metric is a simple metric that computes a percentile, such as the 99th percentile (P99), of the values of every metric event that units generate during an experiment. Each event counts on its own. LaunchDarkly does not group a unit’s events into a single value first. To create one, choose Percentile of event values from the Aggregate as menu when you create a simple warehouse native metric. Event-level percentile is an aggregation option, like Sum or Count distinct, not a separate metric structure.Prerequisites
To create an event-level percentile metric, you need:- A configured Snowflake warehouse integration and a metric data source. To learn more, read Metric data sources.
- A data source that provides a numeric value for each event, such as a latency in milliseconds. To learn more, read Event value mapping.
- You cannot add an event-level percentile metric to an experiment that includes a metric that uses per-user percentile analysis. Per-user percentile analysis requires sequential testing, and event-level percentiles do not support it.
- You cannot use event-level percentile metrics in Bayesian experiments, multi-armed bandits, or guarded rollouts.
- You cannot use event-level percentile metrics in funnel metric groups, because funnel metric groups require the average analysis method.
- You cannot configure winsorization for an event-level percentile metric. LaunchDarkly clears any winsorization options you configured when you change an existing metric’s aggregation to Percentile of event values.
- You cannot choose how to handle units that do not generate events. Event-level percentile metrics always exclude units that generate no events.
- You cannot choose a different analysis unit for the metric in an experiment. Event-level percentile metrics always group events by the experiment’s randomization unit when they compute confidence intervals.
- Experiments do not apply CUPED to event-level percentile metrics.
Example use
Use an event-level percentile metric when you want to improve the experience of each event, and each unit can generate many events. For example, you can use event-level percentile metrics to measure:- The P99 latency of every API request, when each user makes many requests.
- The P95 response time of every search.
- The median load time of every page view.
| User | Search latencies (milliseconds) | Average latency per user (milliseconds) |
|---|---|---|
| User A | 100, 120, 900 | 373 |
| User B | 200 | 200 |
| User C | 80, 90, 95, 110, 3000 | 675 |
- An event-level P50 is 110 milliseconds, the median of all nine searches.
- With percentile analysis of each user’s average latency, the P50 is 373 milliseconds, the median of the three per-user averages.
How LaunchDarkly computes event-level percentile metrics
LaunchDarkly computes the percentile of each variation’s events to compare the performance of flag variations during an experiment. Events from the same unit tend to resemble each other. For example, a user with a slow network connection usually has many slow searches. If each event were treated as an independent observation, confidence intervals would be too narrow, and experiments would report more false positives than the significance level allows. Instead, LaunchDarkly uses the Delta Method as described in Applying the Delta Method in Metric Analytics: A Practical Guide with Novel Ideas to compute confidence intervals that account for how many events each unit generates and for the correlation among a unit’s events. As a result, collecting more events from the same units narrows the confidence interval less than adding new units does. Event-level percentile metrics use fixed-horizon frequentist analysis. Plan the experiment’s duration before you start it, and analyze the results at the end of that duration. Checking results repeatedly and stopping as soon as a result is statistically significant increases the chance of a false positive. To learn more, read Fixed-horizon versus sequential. Event-level percentiles differ from how LaunchDarkly performs percentile analysis on other numeric metrics:- Percentile analysis first aggregates each unit’s events into one value, such as the unit’s average or sum. It then computes the percentile of those per-unit values. It measures a percentile across units, such as the P99 of each user’s average search latency.
- An event-level percentile computes the percentile of all events, without aggregating them by unit first. It measures a percentile across events, such as the P99 of all searches.
Example metric in SQL
Some customers find it helpful to think about LaunchDarkly metric calculations in terms of SQL statements. The following examples compare an event-level P99 with the P99 of per-user averages from percentile analysis. Example table and column names represent the metric components:search_eventsis a warehouse table that stores the metric events on which the metric is defined. In this example, it records an event each time a user performs a search.latency_msis the numeric value column of the data source. In this example, it records how long each search took, in milliseconds.user_idis a table column that represents the context for the experiment’s randomization unit. The event-level percentile does not group by it. This example uses the “user” context kind, but a metric can use other context kinds, such as “account,” “session,” or “device.”PERCENTILE_CONT(0.99)computes the 99th percentile. The event-level example computes it over every row insearch_events. The percentile analysis example computes it over one average per user.
Metric definition
When you configure the metric definition for an event-level percentile metric, you select Percentile of event values as the aggregation type. You then choose the percentile level and the success criteria. The completed definition reads as a sentence:Compute theEvent-level percentile metric definition options include:<percentile level>of all event values.<Success criteria>.
- Percentile level:
- P50, P75, P90, P95, or P99: These options represent the 50th through the 99th percentile. P50, the median, is the default.
- Custom: Choose this option to enter a different percentile, as a whole number from 1 to 99.
- Success criteria:
- lower is better: This is the default. Choose this option for metrics measuring negative things like latency or load time.
- higher is better: Choose this option for metrics measuring positive things like throughput.
Create event-level percentile metrics
To create an event-level percentile metric:- Click Measurement > Metrics in the left sidebar.
- Click Create metric. The “Create metric” dialog appears.
- Click Simple in the “Select metric structure” section. The “Select metric structure” section appears only if you have configured warehouse native Experimentation and a Snowflake warehouse data source.
- Choose Warehouse native (Snowflake) from the “Define metric using” menu.
- Choose an existing data source from the Metric data source menu. To learn more, read Metric data sources.
- (Optional) Enter the Event key to use for the metric. Leave the field blank to include every event from the data source in the metric.
- (Optional) Add filters in the “Filter by event properties” field to include only some events in the metric. To learn more, read Filtering custom metric events.
- Choose Percentile of event values from the Aggregate as menu. The “Metric definition” section populates using default values.
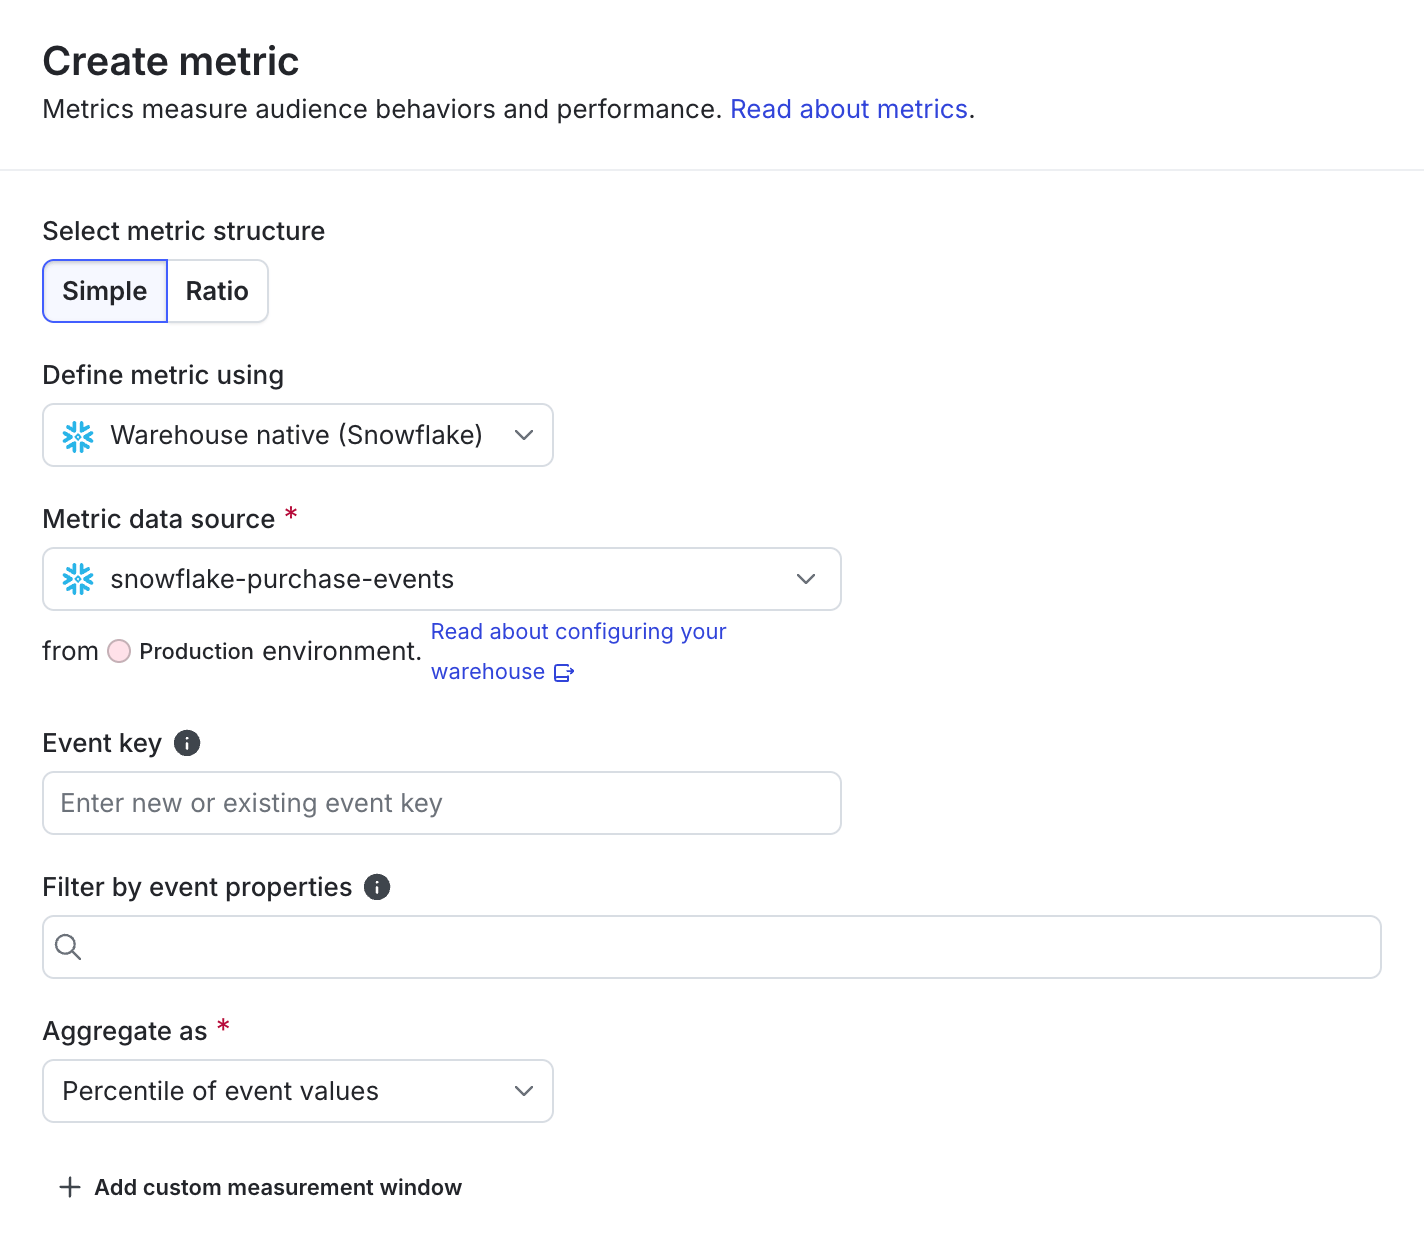
The 'Create metric' dialog with 'Percentile of event values' chosen from the 'Aggregate as' menu.
- (Optional) Click + Add custom measurement window to configure a metric measurement window.
- Confirm or choose the Numeric value column. LaunchDarkly reads this column from each row in the data source to get each event’s numeric value, such as
latency_ms. When the data source maps an event value column, this field displays that column by default. Otherwise, choose the column to use for providing the value. - Click P50, P75, P90, P95, P99, or Custom in the “Percentile level” field. If you click Custom, enter a whole number from 1 to 99.
- Choose lower is better or higher is better from the Success criteria menu.
- (Optional) Enter a Unit of measure, such as
ms. - Enter a Metric name.
- (Optional) Add a Description.
- (Optional) Add any Tags.
- (Optional) Update the Maintainer.
- Click Create.

You can also use the REST API: Create metric