Find 'root cause' in log data to prevent future incidents
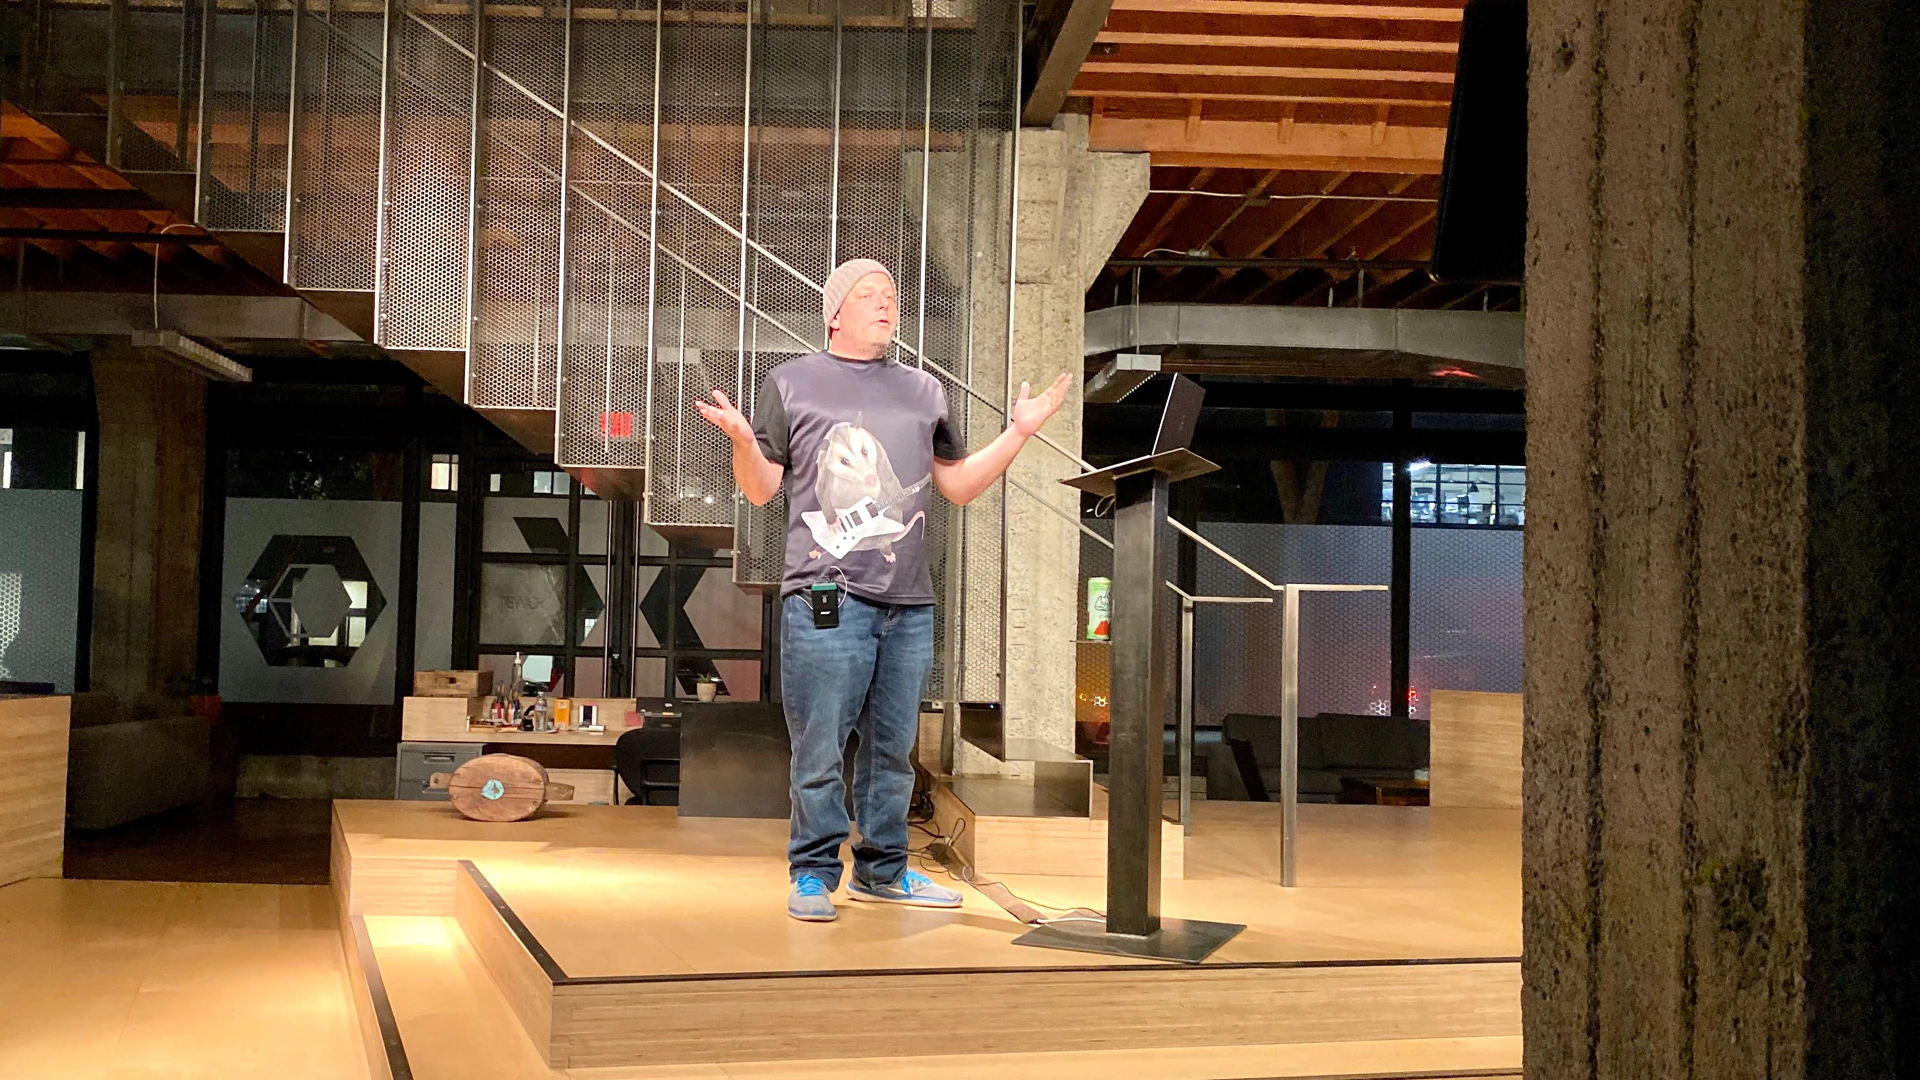
At the November Test in Production Meetup in San Francisco, Larry Lancaster, Founder and CTO at Zebrium, spoke about the benefits of using machine learning to organize and detect patterns in unstructured log data. With the help of unsupervised machine learning models, teams can find the root cause of incidents in their stack and use such insights to prevent future errors.
"There are a lot of enterprises that have relationally structured their logs, believe it or not. And there are some that have so many different log types and so many different event types in their logs that there is no way they will ever do it; they have completely given up."
Watch Larry's full talk to learn how machine learning can help you recover from incidents faster and, in many cases, avoid them entirely. If you're interested in joining us at a future Test in Production Meetup, you can sign up here.
FULL TRANSCRIPT:
Larry Lancaster: I guess first I'll just bore you with this so that you know what kind of a horrible life I've had... no I'm kidding. I've led a very blessed life. I've been working in the Valley for about 20 years, mostly in data, dealing with data and most of that data is machine data that came out of a machine as text. And unlike now where we have JSON and YAML and everybody knows how to use it or at least we hope. Back in the day there was no such thing and in fact, if you look in /var/log on any one of your Linux hosts, who has ever looked in /var/log on their Linux... Okay, good. So, you know what I'm talking about, right? Truth is that half your stack or more is always going to be like that and so I got sick of doing the same thing over and over and I'm here to talk a little bit about that and how that can help for monitoring if we do it a little bit differently.
Right, so staring at the abyss is what I call this and it's always kind of like this because you can never... sure, we all say right you can never catch everything in testing and that's always been the case. One of the companies that I used to work at was kind of enterprise storage and there everything was tested. There was a one-year release cycle that would take forever and still there was problems. We needed to have back doors to get in with authorization of course, but to fix things and go look at things. You're never going to catch everything. If you've got one deployment that's going to impact now not just one but thousands of customers or users that's even more risk.
So how can we mitigate that? So this is what we're here to talk about and this is one of the things I love about Feature Flags and I know it's not probably the... well okay I don't want to, maybe it is for some people, for me kind of it is one of the most interesting applications is using it to kind of roll something out and see if it's going to cause bad effects and then roll it back.
I really liked that about Feature Flags. People do it other ways, there's lots of ways to do it. A canary rollback just using your containers and hopes and prayers and monitoring tools. Mesh traffic mixers, still you need to monitor though. You need to be looking to see if anything's going wrong, what that is, what's the root cause? Is it something I've seen before? That sort of thing.
So, this is what my point of view really is about, which is I want a tool. It sounds ridiculous, right? Because if you say, I want a tool to help categorize incidents before I noticed them and what I mean by characterize is kind of give me a hint as to not just like, okay, what containers or nodes or whatever did it happen on, but also a little bit of some sort of information about, okay, here's the things I think are related to what's going on. So over here I some metric spiking and over here I see a rare event happened in this log over here and over here I see a bunch of errors that started spewing at that time and I want something to show me that and I want it to come from deep in the bowels of the data.
I don't want it to be sort of at such a high level of sort of stubbly processed alerts that it's... I then need to go right, pull all that information myself. That's what I want and I'm going to have it. I will have it someday. So that's what I wanted to talk a little bit about. Logs, so I'm back to logs now. Out of curiosity, so how many people here I know we've all used monitoring tools regularly. How many people actually end up going into logs to find root cause on some issue? Anyone? One, two, three, four, five. That's not bad. Okay, cool. So at least for me, sometimes if something is new, if it's a new kind of issue, usually I end up in a log. Maybe that's everyone's experience or maybe it's half people's experience. But what frustrates me about them is that they're completely unhelpful when it comes to monitoring.
It's interesting because I was talking to a guy the other day who was telling me, "Yeah, you know, I can kind of tell when things are going well in my deployment, when I am getting 5,000 alerts from a particular log manager a day versus 10,000 then I know there's a problem." And that's kind of where we're at. When I started dealing with log data at NetApp 20 years ago to help them build support tools, look at product quality and all that, we used an indexer - you know what we're using today? Mostly indexers were searching logs because they're unstructured, they're like documents and so that's what you do with them. But since we have to end up going and looking into them, doesn't it seem reasonable that there should be a way to extract that monitoring value before I've found that something's wrong and I had to go dig into the logs. So, look, I skipped ahead, I've already said this but to me being stuck in index and search is kind of preventing us from going to the next level with logs.
This is kind of where things have kind of led to both kind of in my investigations as well as there's other companies that are out there looking at doing this. There's a lot of enterprises that have relationally structured their logs, believe it or not. And there's some that have so many different log types and so many different event types in their logs that there is no way they will ever do it; they have completely given up.
One giant infrastructure vendor whose name you would instantly recognize. So, when the whole deep learning thing was happening, they went out, I went down and I talked to the guy whose running their sort of... he's the technical architect of their support and services area. What they did was, when the whole deep learning thing was going, the DGX-1 came out, all the architects and senior engineers and engineering at this company got a brand new DGX-1 and three months of training and deep learning and they were told, "Okay, go figure out how to mold incidents and customer issues and product quality, go figure out how to mine that out of our logs." And they gave up after six more months because they realized they were spending all their time trying to structure the log data so that the deep learning algorithms could use it and that's the universal problem with logs.
It's hard because formats change, Parse's are ambiguous and you need somebody who knows what they're doing to kind of interpret it and say, “Oh, is that thing important or is it not important? What does it mean?” One thing that's really annoying is if you ever build something on top of the log file, like an alert, what will happen will be the format will change eventually. Someone that you don't know or that doesn't owe you a notification will change the format. They will be helpful in change, they will fix a spelling mistake, right? Or maybe they'll add another parameter because it is useful to have that and what they're thinking when they do it as a developer, they're thinking, "Okay, when I have to root cause something, I'm going to look at this log. I want that information."
How do we build a platform on top of that? Well we have to structure the data and then what we have to do is, I'm not going to get too much into the weeds on this but if you could think of each event type as a table and maybe it has some parameters like some numbers and maybe some volume names or some container names or whatever interface, whatever it is that the events talking about. And if you can imagine a table that's named the normal text in the event, right? Like something bad happens and then here's a column with that in it and a column with that in it and then if you had that structure and then when the format changed you had algorithm that looked and said, “You know, this is suspiciously like that other thing. I'm going to add a column to that. I'm going to merge this at the data layer and I'm going to notify people that I've done that.” Then you end up with something that's like a platform you can build monitoring on and that's what interests me.
So, I don't want to get to go too deep into this either just because it's probably not of interest but just not, reach out anytime if you want to get into it but what I would say is like anything else with dirty stuff, there's a dirty solution required. So, there are academic projects that use deep learning directly on unlogged data. There's a lot of work done with LCS. LCS is state of the arts, longest common substring, sometimes it's used in batch, sometimes it's used online. But it requires tuning and tweaking and parameters and it requires a lot of examples. So, none of this is working out well.
So, what we decided to do was create sort of a Swiss army knife. So here's what's interesting, so this is something that I love to tell people because I'm not sure if they're aware of it but if you look at a typical set of logs, maybe it's a gigabyte or terabyte, there's only going to be... so let's say maybe 10 to 20% of that will be stuff you only saw one to five times until you get to some vast number that I've never actually accumulated in one place. You will not see everything because not all code paths are exercised all the time, throughout your stack and so you need something that's going to work on one or two examples using heuristics and when it gets... for examples, it needs to do something more fancy and when he gets a hundred he needs to do something fancier.
So, it's kind of a complicated problem, but this is kind of what I want to see from a log monitor, right? What I want to see from a log monitor, is it something that kind of notices, okay, I've got my Atlassian Confluence service here, I've got a PostgreSQL service and basically what I want to notice is that something rare happened in PostgreSQL just before a bunch of horrible stuff started happening everywhere else and when that happens, I want it to tell me, right. I want it to say this happened first and so that's probably the root cause and I want to get this before I noticed because all of a sudden there's a ramp in some horrible metric that means everything's on fire, right? As soon as that second few messages come in, I want to be able to say like I would with my eye, I want to be able to say, my system would be able to say, "Yeah, this is something to look at and this is probably why, go look at it." Right?
So, I'm going to tell you a little bit about where we're at and then close with a little bit about where I think we're going. So far, I would say that we're the only people doing a lot of this anomalous or autonomous log monitoring stuff. So, what ends up being really viable is getting data sets like you'll work with a company and they'll have some incidents and you'll take those, and you'll do stuff and work out bugs and you'll get better right? So right now, we're finding root cause in about 56% of the incidents that we have. That's recall, precision is about 10% and what that means is, let's say I have an incident a week that I actually have seen then, then what will happen is I'll get an alert once or twice a day.
That's where we're at now and I kind of feel like that needs to be driven down by an order of magnitude but first I'm more interested in getting the 56% up. So what's interesting to me is this problem, it's kind of like sometimes you hear these incredibly talented martial artists talking and they say, “Yeah, you know, however you come at it, that expertise, eventually you master something and you could have gone to that mastery through any path.” But, at that point you are a master of something and what I'm starting to believe is that this same sort of process and sort of logic of let's look throughout the entire cluster, let's find stuff that's going wrong or maybe is weird and let's correlate it and let's see if we've got lots of coincidences and the more data I can get about stuff, the more containers and log types I can get, the more stats I can get, the better a job I can do of squashing noise and finding coincidences.
And I think that what we'll see as the future unfolds is... what I want to see is smart metrics companies that are out there and looking for anomalies, you're seeing this now, I think they're really noisy in general but there'll be getting better and they'll be looking to bring in other kinds of data and do real anomaly detection with it. To me, the future has to look like, we don't have to do this ourselves all the time right?
We can let a tool do the work for us and get more strategic about what we're thinking about, like our overall reliability in our architecture instead of digging into this kind of stuff. Anyway, you're welcome to come give us a ring if you want to be part of that otherwise, I'm really grateful to have been a part of this here today. Thank you.