
Is Kafka the Key? The Evolution of LaunchDarkly's Ingest
Published September 6, 2022

At LaunchDarkly, we face a unique challenge when it comes to adapting to the load of our customers. Because we record our customers’ web apps, we need to be able to handle bursts of traffic as they come from their users.
When we first started, our data ingested was simple: we would stream data from our recording client to our backend and perform updates as it came in. Our data handlers would perform metadata updates and write session recordings to PostgreSQL via SQL queries, and they would be consumed and removed from the database tables for permanent storage.
The initial approach worked fine for a while. But as our customer base grew, we ran into key issues with this implementation. We had to run some database migrations that ran an ALTER command with an aggressive table lock. Immediately, we saw a wave of blocked commands, all waiting for the migration to complete. For the ~30 minutes that this took, we were dead in the water with incoming session requests and could not store any of our customers’ recordings. All of the backend traffic would time out since we didn’t have a place to put the data in the meantime.
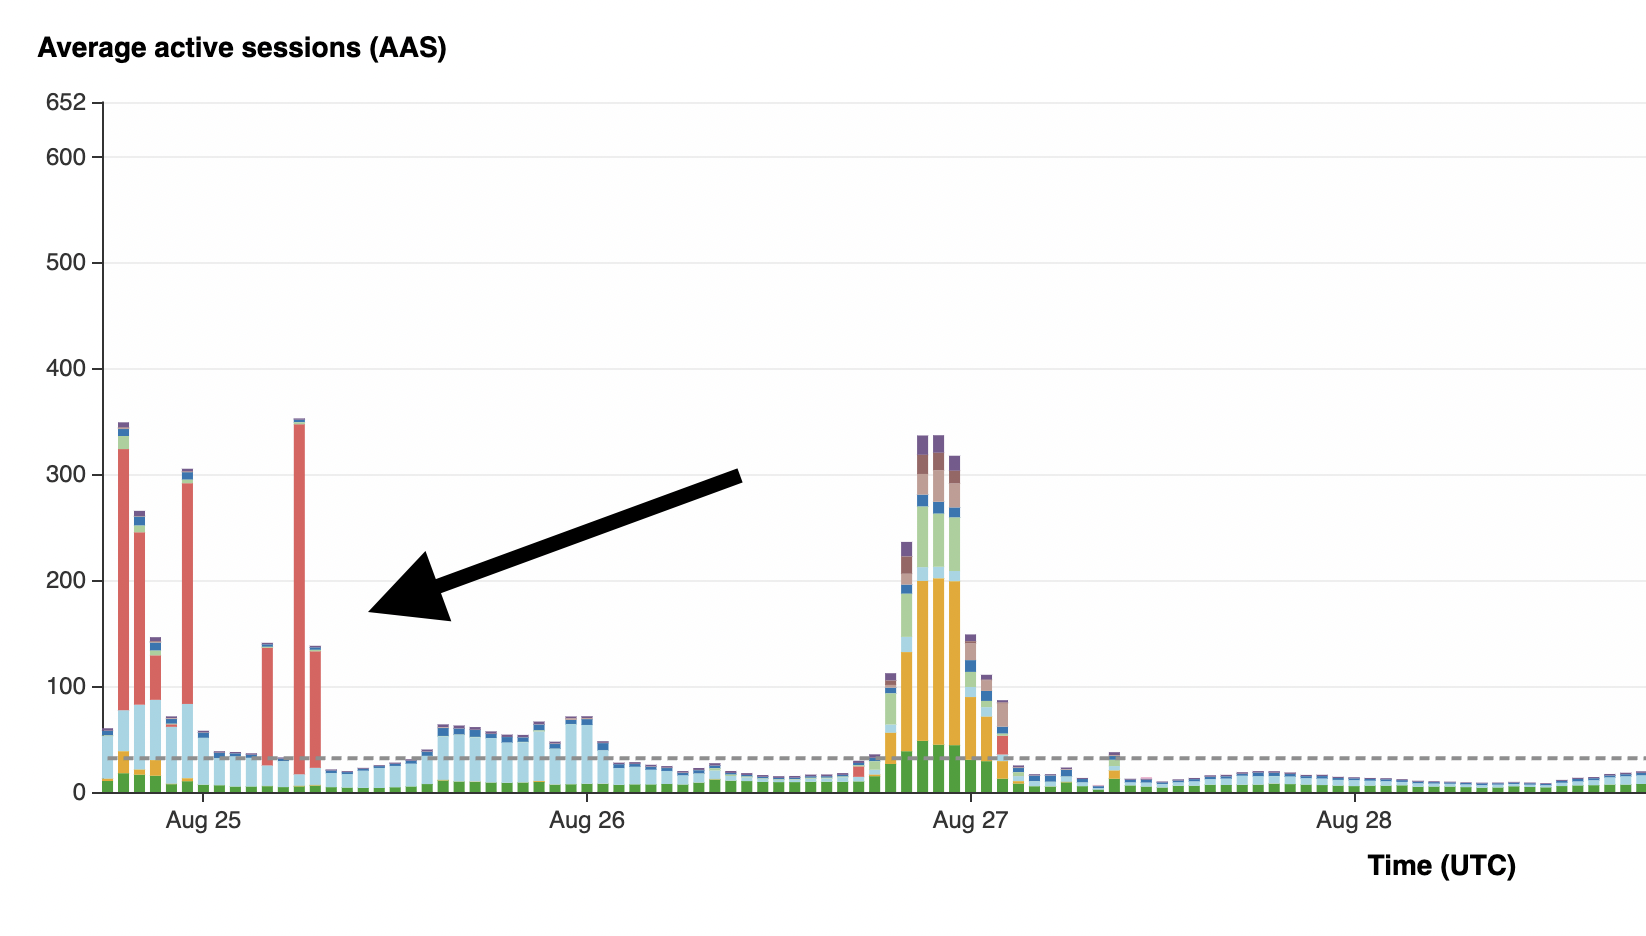
Maintaining all of our customers’ recordings is always our top priority, so we knew we had to find a way to improve our ingest.
Possible Solutions
Since we needed a way to buffer data, we considered various techniques that could accomplish the task. One idea was to abstract each backend payload into a ‘message’ to be put into a buffer and consumed by a worker. We had a few considerations that were driven by details about our data:
- Our task data can range from ~10KB to ~100MB
- Tasks must be processed in order and serially for a given recording.
- Tasks across different recordings can be processed in parallel.
- We can’t lose any messages for a recording as that would invalidate the entire recording.
Apache Cassandra/MongoDB/DynamoDB/ Other NoSQL Databases
- Has row size limits that vary but generally do not support our ~100MB messages.
- Would require much more application-level logic to write and consume data.
Redis
- Data may expire so messages may be lost.
- Message ordering is harder to maintain without performance constraints.
RabbitMQ
- Fully ordered so scalability without application-level re-architecture may be a challenge.
- Brokers are replicated but do not scale well horizontally.
Apache Kafka
- Messages can be as large as ~500MB.
- Messages are ordered within a partition.
- One consumer per partition allows for consistent ordering with linear parallel scaling.
- Messages only expire after a time-based or space-based retention policy.
Building a Scalable Task Queue
As we evaluated our options, we settled on a producer-consumer message strategy. Our architecture would have our backend HTTP request handlers produce ‘task’ messages that would block until the data was sent to our chosen broker. The messages would arrive at the broker quickly and reside until a worker machine could consume them and process their data. This effectively decouples our incoming data stream from the processing, allowing us to buffer data for as long as we want (space permitting based on the configuration of our broker).
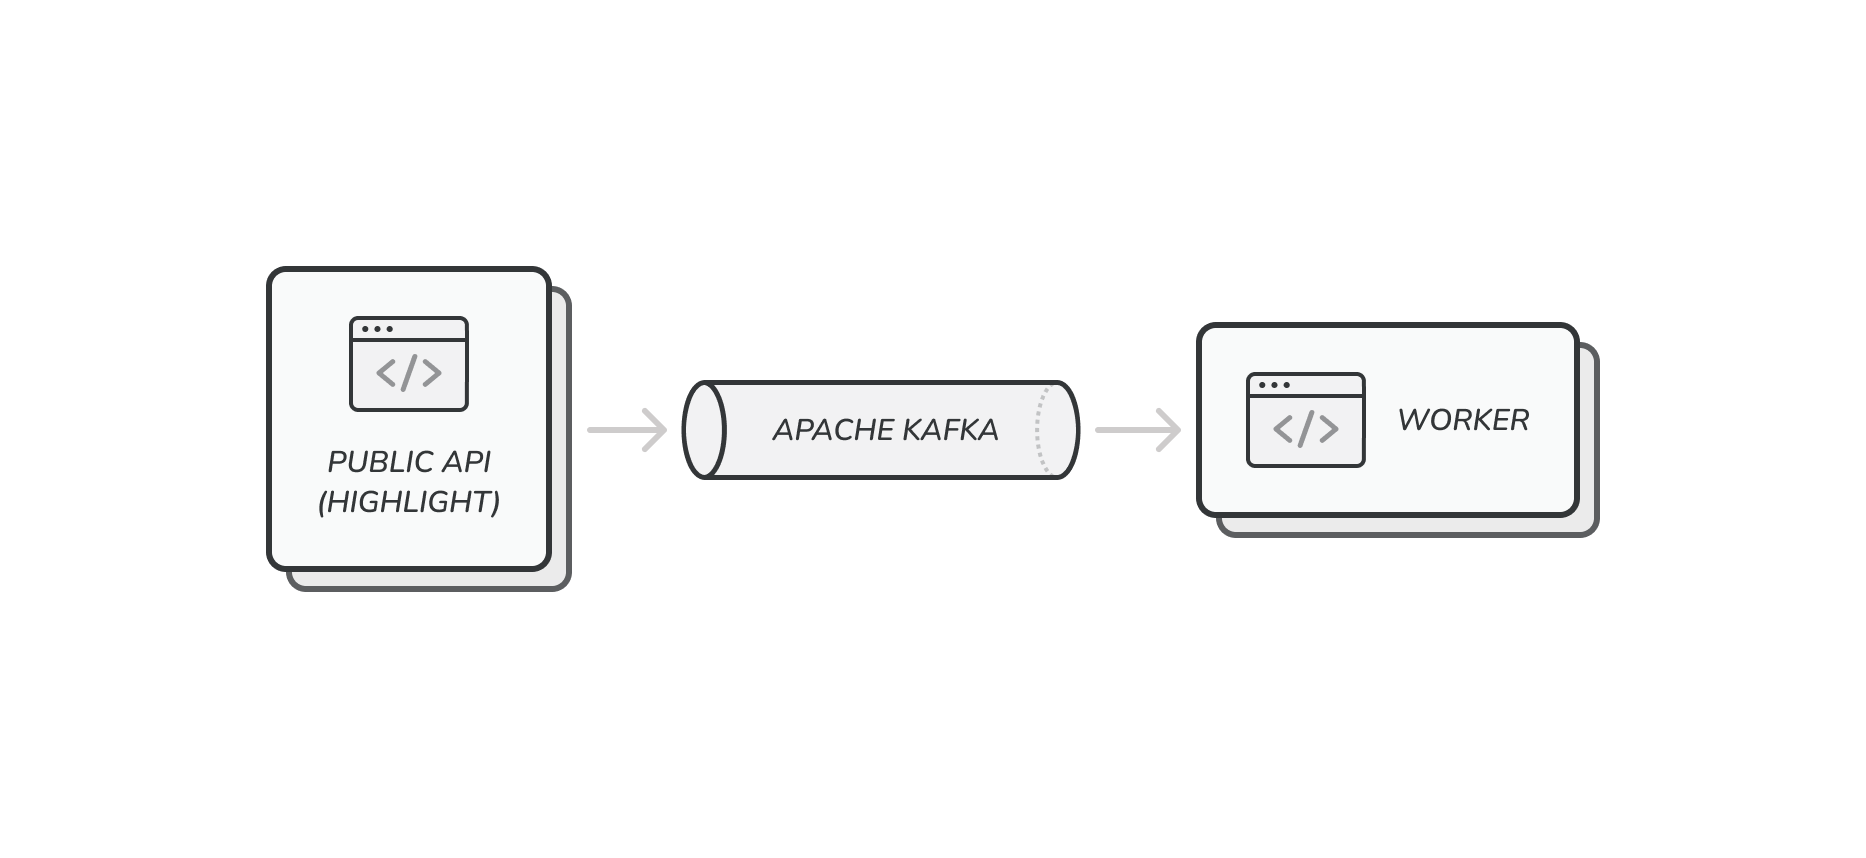
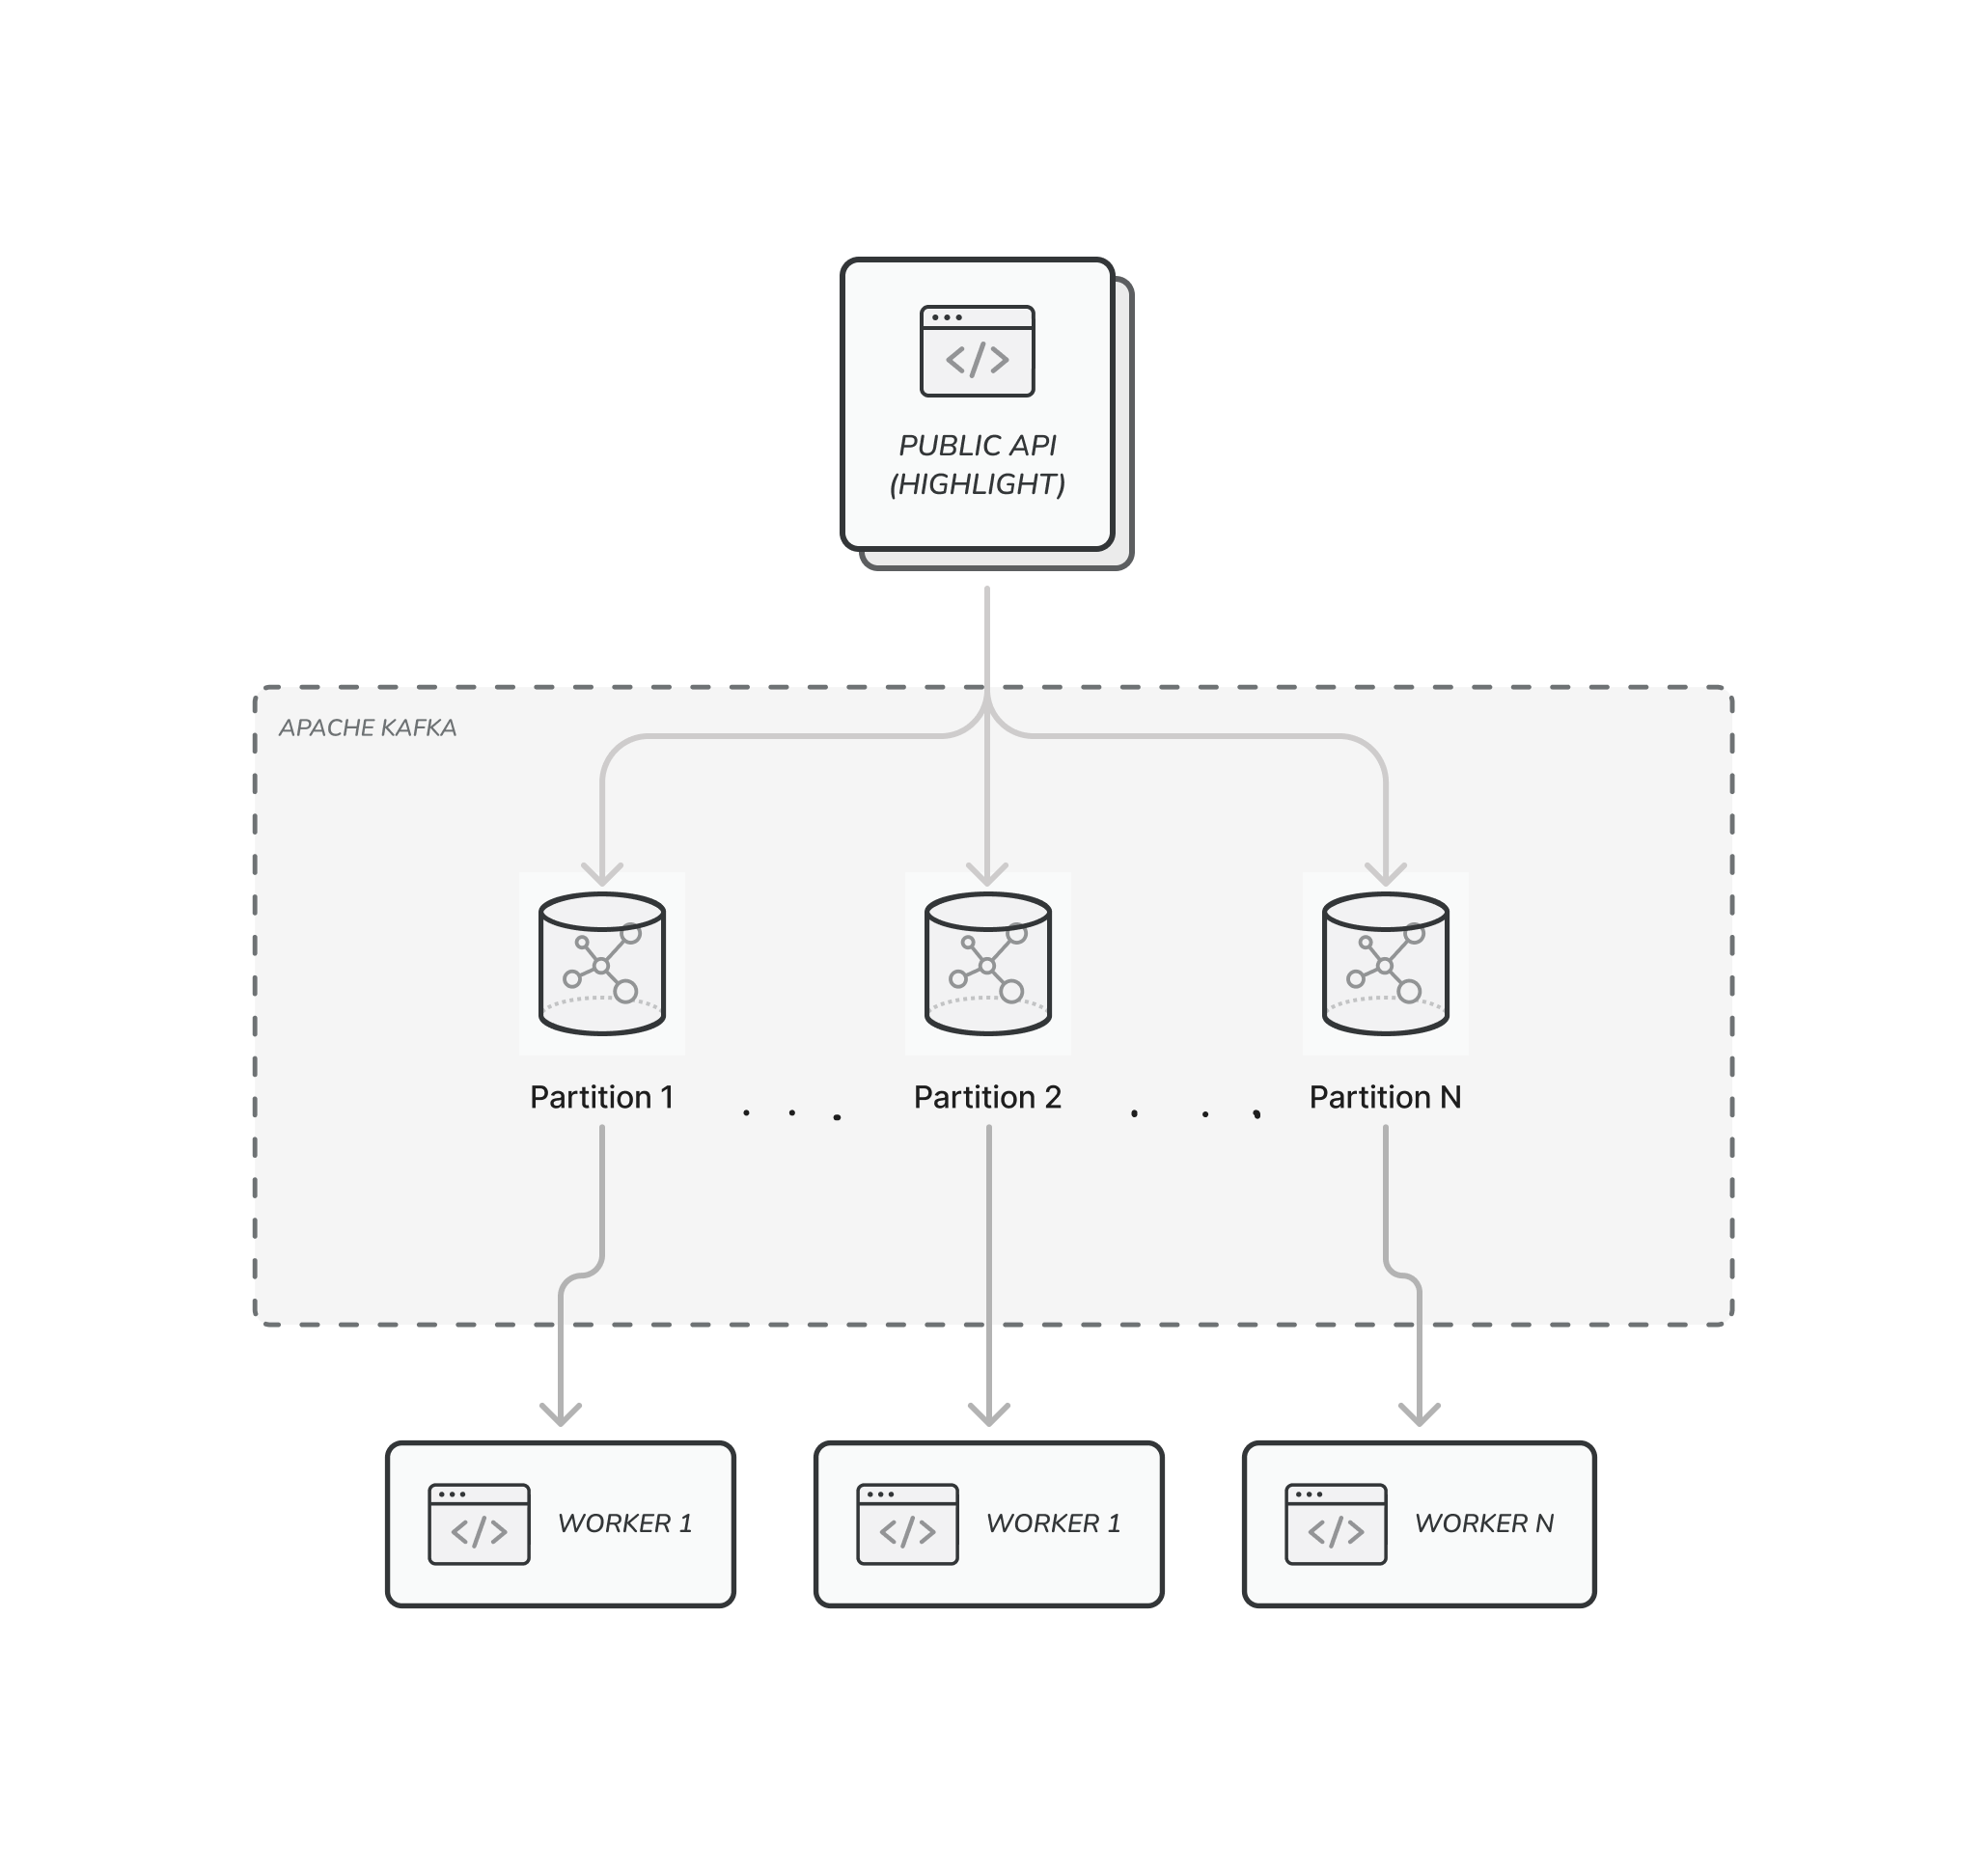
Focusing on the specifics of Apache Kafka, we had to define partitions that would store the sets of messages. As part of the process, we needed to think of a key that would ensure decide which messages fall into the same partition and are ordered relative to each other. Since one of our requirements is ensuring that tasks for a given recording are processed serially, we chose the session ID as the partition key.
On both the producing and consuming ends, we could scale up the number of concurrent processes arbitrarily. Since messages of the same recording are processed in order, consumer scaling is limited. This is based on the number of partitions since, to maintain this property, each partition only has one consumer.
For example, to be able to scale up to 128 consumers, we would need to have at least 128 partitions. Note that increasing the number of partitions increases overhead on the Kafka broker nodes and will require a more powerful machine (primarily more memory). For reference, we easily consume/produce ~5k messages per second (each ~100KB on average) across 768 partitions on a 3-node AWS kafka.m5.2xlarge cluster.
Our 5 Key Learnings on Apache Kafka
Managing our Apache Kafka cluster has been fairly straightforward, but we learned a lot of lessons along the way. To manage the cluster, we set server-side configuration via AWS MSK and monitor/edit topics via an ECS container running provectuslabs/kafka-ui. Certain actions normally require the use of the Kafka CLI running within the cluster’s VPC, but we’ve found this UI to accomplish most of those tasks well.
Message Ordering
To guarantee message ordering, producers must send messages with the Kafka SDK configuration of acks=all. This setting means that each producer will send the message to ALL brokers and wait for them to all receive the message before continuing. Messages are delivered to all replicas of a particular partition in the same sequence, ensuring that consumers of that partition observe the data in identical order.
Log Compaction
As we learned the hard way, enabling log compaction is a bad idea for a message broker. Log compaction will replace old messages of a given key with future messages of the same key. This may be useful if messages represent a state which is updated by a superset state, but this approach will cause data loss if each message represents a unique piece of data.
Replication Factor / Minimum In-Sync Replica
One important feature of Apache Kafka is the ability to replicate data across multiple brokers to ensure high availability. Each partition can be replicated across N brokers to allow for reliable read/writes when a broker is down for maintenance or due to issues.
For example, if you have a Kafka cluster with three nodes and a replication factor of three, then all brokers will have copies of all the data. You could lose a node without worrying about data loss and with minimal impact on read/write performance. The replication factor can be configured for the entire server or per data topic. You can find more information about how to configure that here.
The min.insync.replicas setting dictates how many brokers must acknowledge a message before it is considered sent out. You may want to increase this setting to ensure that data is replicated and ordered correctly in the case of a broker outage. However, take care not to set the value to the total number of brokers since that would mean that writing will be blocked if even a single broker is offline for maintenance.
Data Compression
When thinking about how to best compress data, you have two options: compress on the producer/consumer nodes or have the Kafka brokers do it for you. We went with the first option of compressing before sending data and decompressing upon retrieval to ease the load on our cluster.
Scaling up our producers/consumers proved to be more cost-effective than adding more CPU/brokers to the Kafka cluster. To accomplish this, we used the segmentio/kafka-go client library which provides an excellent abstraction for interacting with the cluster and will handle data compression completely transparently.
Rebalance Timeout
As we discussed, a consumer group distributed partitions to all processes so that each partition has exactly one consumer. To accomplish this, consumers send heartbeats to the broker to ensure they are still able to receive messages. When a consumer process stops, such as when rolling out an upgrade or if a worker ECS container crashes, Kafka must detect the missed heartbeat and assign the partition to a new consumer so that its messages do not back up.
The configuration of rebalancing is dictated by two key settings. By default, the session.timeout.ms setting governs the duration without consumer heartbeats that a broker considers the consumer dead and initiates a rebalance, and the group.initial.rebalance.delay.ms setting sets the amount of time that the group coordinator will wait for new members to join. This means that once a consumer process stops, the amount of time until new data is consumed is the sum of the two settings.
We had to tweak these two settings from their default values to ensure that the rebalance time is reasonably short to quickly resume consuming messages while giving enough of a delay for new containers and processes to start up and connect to the cluster.