
Day 11 | ✉️ Letters to Santa: what engineering teams really want from Observability in 2026
Day 11 | ✉️ Letters to Santa: what engineering teams really want from Observability in 2026
Published December 22, 2025
Santa may not accept wish lists from adults. But if he did, I can imagine whatever the observability teams asked for would fall under one of three categories given current industry trends: ROI, AI adoption, and decreased tool sprawl. All of which can be remedied under a unified platform that addresses each pain point.
So what would Santa, the master of global logistics and 24/7 workshop operations, tell engineering teams about solving these challenges? His answer centers on one insight: observability is about treating feature flags as top-level context for root cause analysis.
Why feature flags + observability are better together
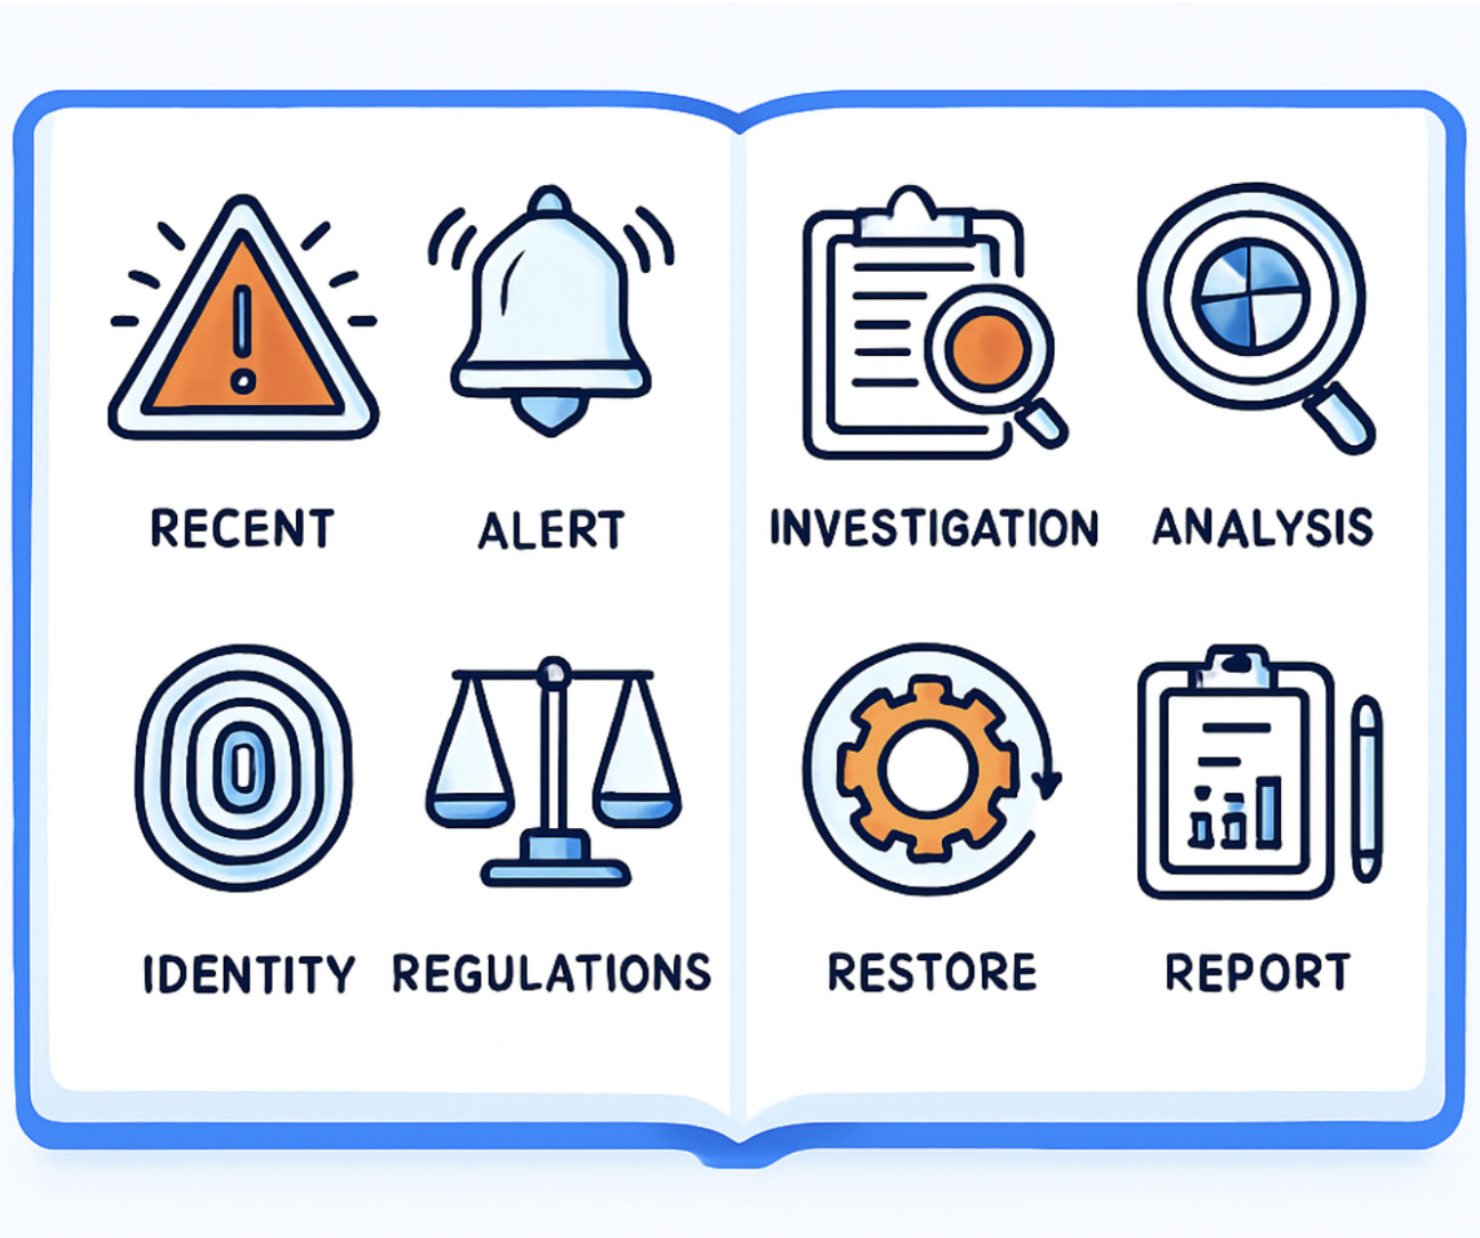
Flags create the “what changed” context observability needs. Every incident investigation starts with the same question: “What changed?” Feature flags, AgentControl configs, and settings updates are configuration changes that directly impact user experience. When your telemetry data doesn’t include the feature update that caused the issue, you’re debugging blind and missing half the story of what actually happened in production.
Consider this scenario:
This is what engineering teams are really asking Santa for in 2026. A platform that seamlessly combines observability and feature flags to measure impact.
Lets hear directly from the teams themselves by reading the letters that landed on Santa’s desk this season.
Letter 1 – The SRE
Santa’s response
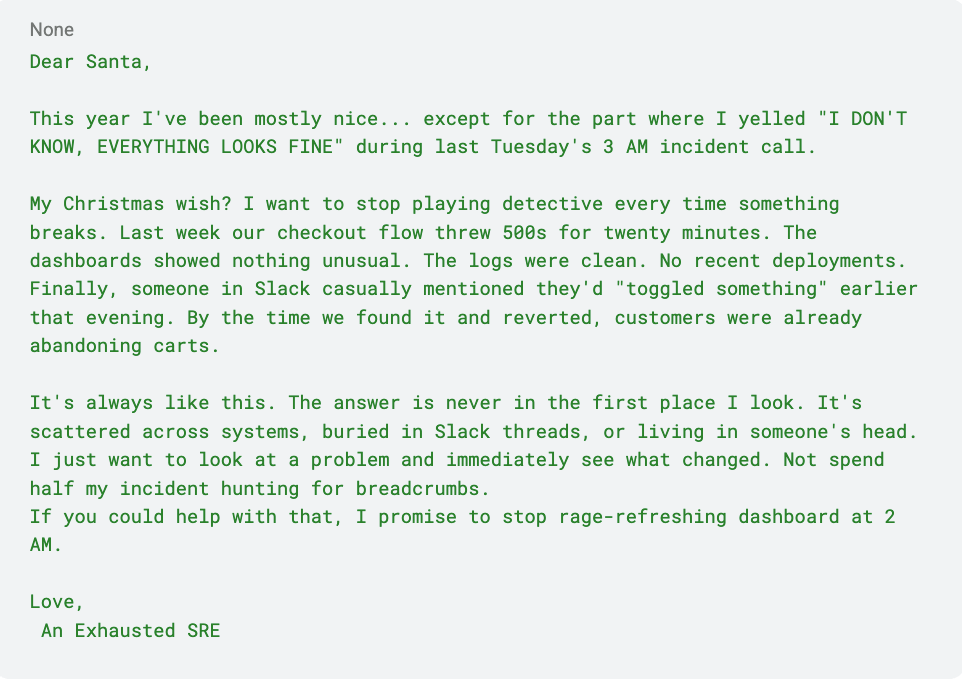
Santa’s elves reviewed your incident timeline and spotted something interesting: you had all the data you needed. It just wasn’t connected. The “toggle” that caused the issue existed in your systems, it spawned traces, it was in your logs. But none of those signals knew about each other.
This is a context problem. The fix:
- Make configuration changes visible as first-class data. Whether it’s a feature toggle, a model swap, or a config update, these changes should appear automatically in your traces and logs as structured data, not tribal knowledge in Slack. When something breaks, your observability system should show you what changed in the same view as the error spike, not require you to reconstruct a timeline from memory.
- Design your alerts to include the full story. An alert that says “500s in checkout” is only halfway helpful. The alert should drop you into a view where you can see the request trace, the relevant logs, and critically, what configuration was active for that specific request. The investigation should start with answers, not questions.
- Treat incident response like a single workflow, not a scavenger hunt. The jump from “something’s wrong” to “here’s what changed” to “here’s the user impact” to “here’s how to fix it” should happen in one interface, not five browser tabs and a Slack thread.
When configuration state lives alongside system telemetry instead of in a separate silo, those 3 AM investigations compress from frustrating mysteries into quick rollbacks.
This SRE’s real problem isn’t too many alerts or bad dashboards, but a gap between what changed (configuration) and what broke (observability). They need these two worlds unified. LaunchDarkly’s approach does exactly this: feature flags, configs, and other dynamic settings become observable context that flows through traces, logs, and metrics automatically. So “what changed” is never a mystery.
Letter 2 – The Platform Engineer
Santa’s response
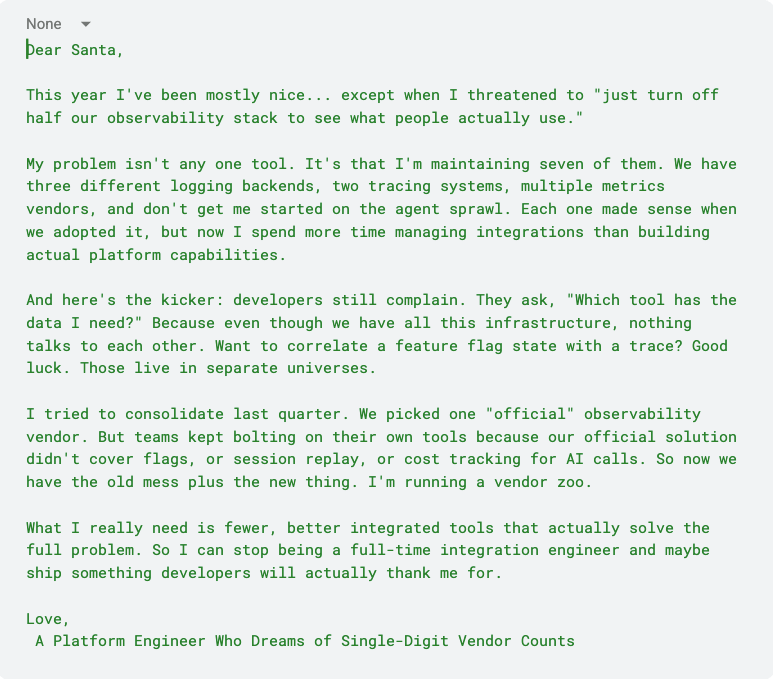
Santa’s elves looked at your vendor stack and winced. The core issue: you’re trying to solve a complete problem (configuration + observability + developer experience) with point solutions that each handle 20% of it.
- Stop thinking tools, start thinking capabilities. The developers need the capability to understand what’s happening in production while minimizing tool sprawl. If you consolidate around platforms that handle multiple signals natively (logs, traces, metrics, etc.), you cut vendor count and reduce the integration tax you’re paying.
- Make “complete” your integration strategy. Half your vendor sprawl exists because teams bolted on tools to fill gaps in your official stack. Choose platforms where configuration state (flags, configs) and system observability aren’t separate products requiring custom integration. They’re built as one system. That completeness is what stops teams from going off jumping ship.
- Measure platform adoption by toil reduction, not feature counts. Your success metric shouldn’t be “how many observability features do we offer” but “how many vendor integrations did we eliminate” and “how many support tickets disappeared.” When one platform can replace four vendors without compromise, you win time back to build actual platform value.
This saves your developers time by thinking more about strategies to solve problems and less about specific tools.
The platform engineer’s challenge is vendor sprawl and integration tax. It’s evident that they’re maintaining too many overlapping tools because no single solution handles both observability and configuration management completely.
LaunchDarkly solves this by unifying feature flags, configs, and observability into one platform. Platform teams can replace multiple point solutions with a single integration, cutting vendor count, reducing maintenance burden, and giving developers a complete debugging experience. This is how you actually get adoption without forcing it.
Letter 3 – The AI/ML Team

Santa’s response
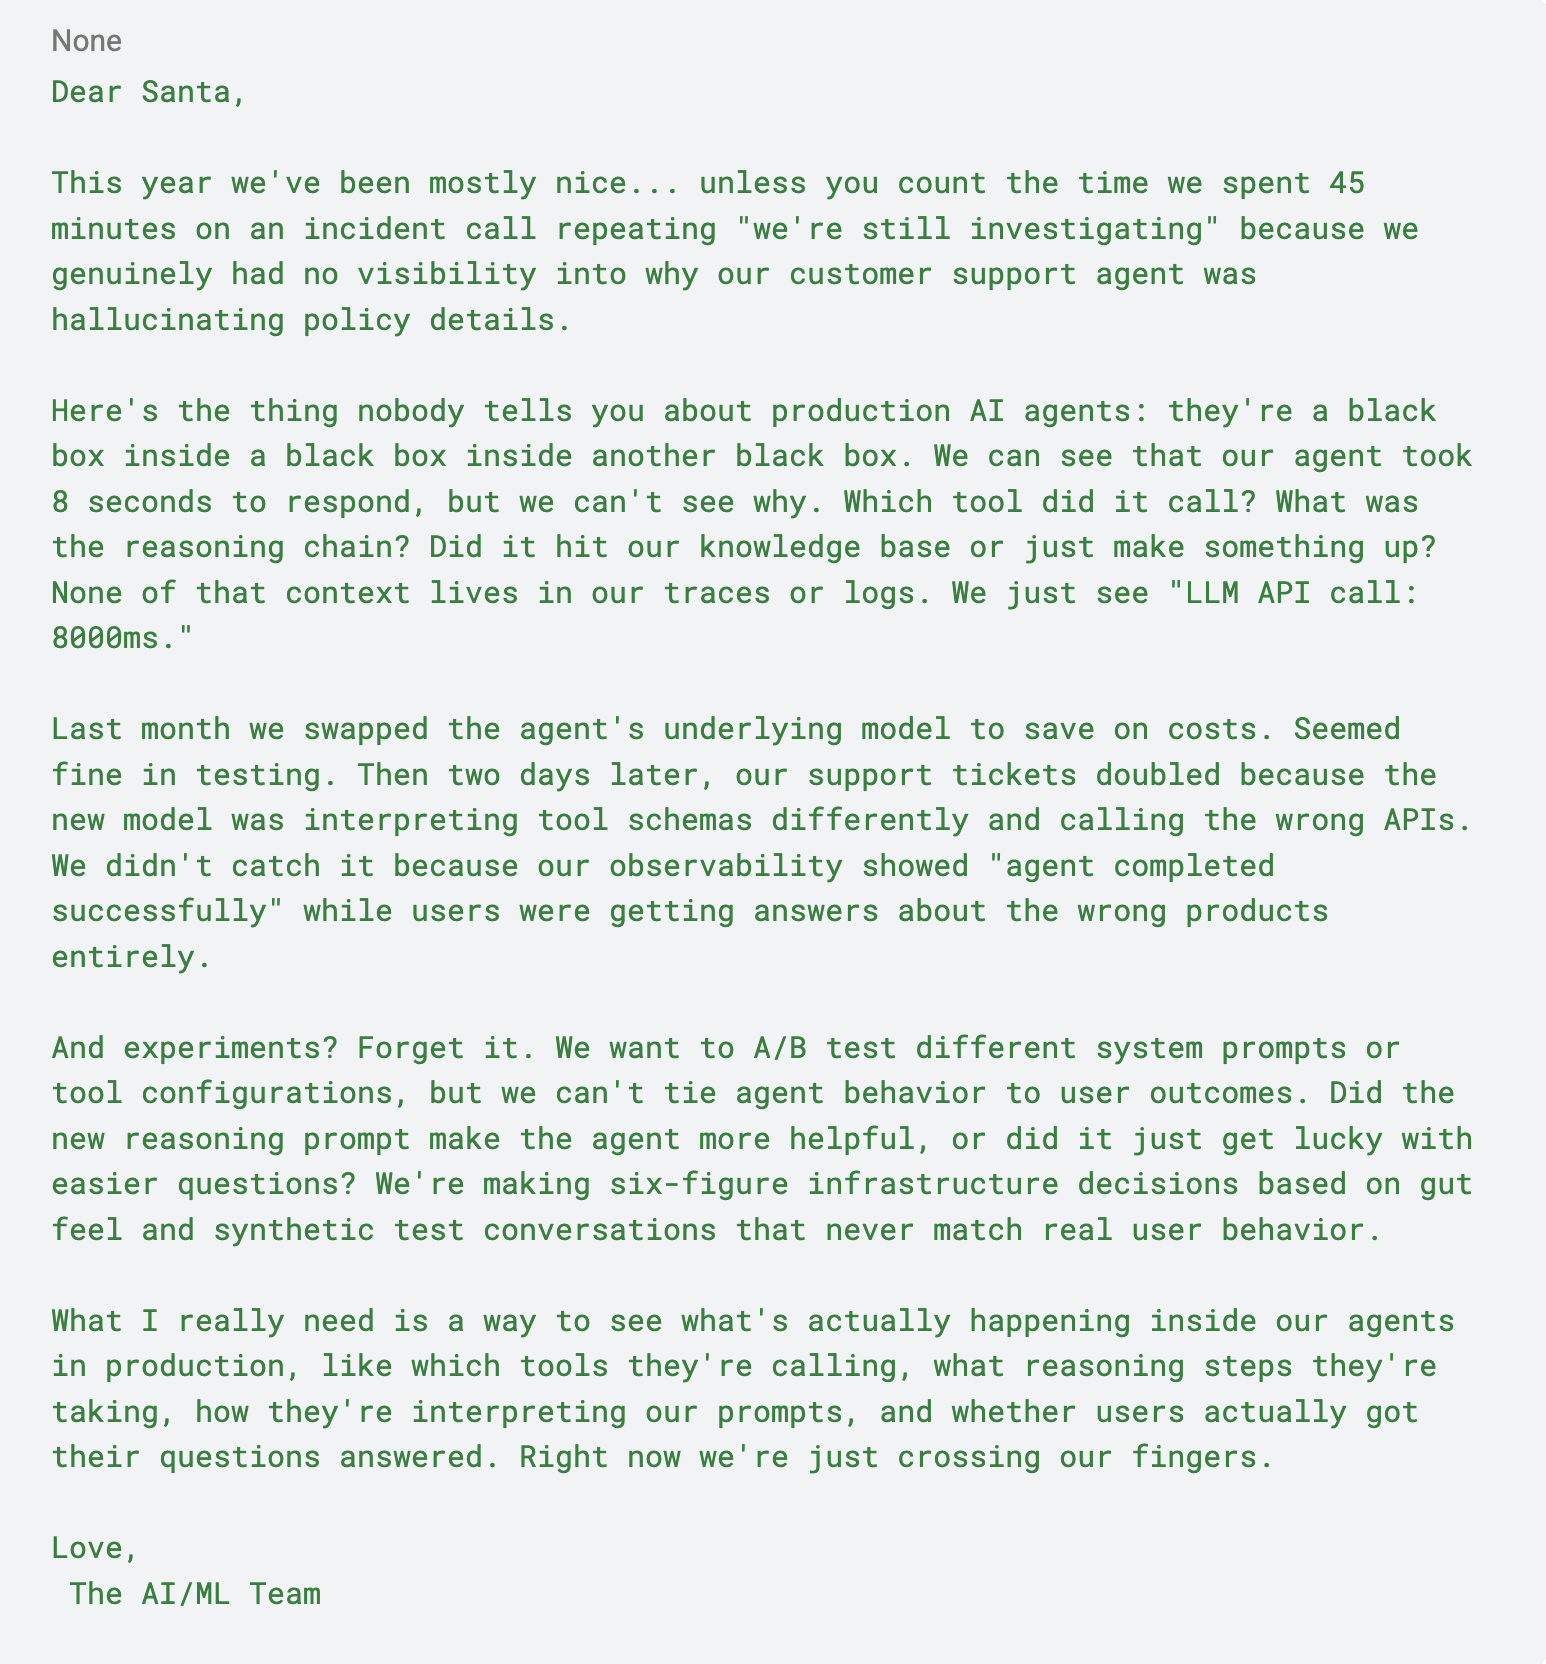
Santa’s elves reviewed your production AI agent setup and found the core issue: you’re using traditional observability for a fundamentally non-traditional system. Request duration and success rates don’t tell you if an agent is reasoning well, just if it’s running at all.
The solution:
- Instrument the full agent execution path. Your telemetry should capture agent-specific context: which tools were invoked and in what order, the reasoning steps between tool calls, token costs per agent session, the system prompt version that guided behavior, and the actual tool inputs/outputs (sanitized). When an agent misbehaves, you need to see “the agent called search_products with category=‘electronics’ when the user asked about furniture” not just “completed in 8000ms.”
- Treat agent configuration as controlled experiments. Gradually roll out prompt variations, tool configuration changes, or model swaps while measuring agent behavior, tool usage patterns, cost, and user satisfaction in real-time. Use configuration management to control which agent config serves which requests, then correlate that state with your observability data. When quality drops, you instantly see “agents using prompt-v4 are calling the wrong tools 40% more often” and roll back immediately.
- Close the loop between agent decisions and user outcomes. Connect your agent telemetry to actual user sessions. For instance, did the agent answer the user question correctly? Did they abandon the conversation? Your agent’s performance metrics should include task completion and user satisfaction along with latency.
For better visibility, you can track things like full execution traces, tool call telemetry, reasoning visibility, and safe experimentation through controlled rollouts.
When your observability system understands that agent workloads need different signals than traditional services, agents stop being black boxes and start being measurable systems you can actually improve.
AI agents present an even more complex observability challenge than simple model calls, because under the hood they’re making sequential decisions, invoking multiple tools, and following non-linear execution paths that traditional APM tools can’t capture.
LaunchDarkly’s AgentControl solve this by letting teams manage agent system prompts, tool configurations, and model selection as observable configuration. This means every agent trace shows which config was active, which tools were called, and the full reasoning chain, making it possible to correlate agent behavior with outcomes.
Combined with feature flags for guarded rollouts and observability, AI teams can safely experiment with agent configurations in production: test new system prompts with 5% of traffic, measure tool usage patterns and success rates, and rollback instantly if agents start hallucinating or calling wrong tools. Turning “it worked with 3 test cases” into “we can see exactly how agents behave across thousands of real user conversations.”
Letter 4 – The Engineering Manager / VP

Santa’s response
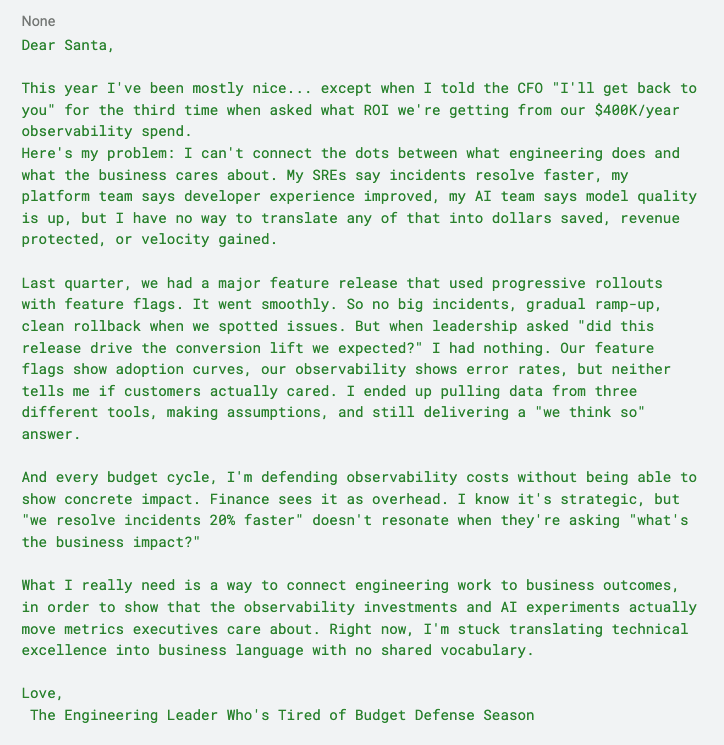
Santa’s elves looked at your board deck and found the disconnect: your observability center engineering stories without including business impact. When leadership asks what’s the ROI?, what they’re really asking for is revenue impact, cost savings, and competitive advantage.
To translate technical wins into business value:
- Instrument outcomes. Your telemetry data should track business metrics alongside technical ones. Transitioning from “feature flag X reached 100% rollout” to “feature flag X correlated with 12 percent conversion lift and 2 Million additional revenue.” You can also filter technical metrics for what leadership actually cares by tagging traces and sessions with business context (user tier, transaction value, subscription status). More importantly, when you roll back a bad release, quantify what that protected. For instance, “the roll back of X feature, prevented $50K in lost transactions” as opposed to “the roll back of feature X reduced error rate.”
- Make every engineering investment defensible with data. When you deploy feature flags with progressive rollouts, measure time saved versus full deployments. And when you reduce MTTR through observability, calculate the cost of downtime avoided. When AI experiments improve user experience, tie that to retention or NPS. Your observability platform should make it easy to build executive dashboards that answer: “How much faster are we shipping?” “What did that outage actually cost?” “Which experiments drove business results?”
- Turn tool consolidation into budget narrative. If you’re spending $400K across multiple observability vendors, show what unified platforms save: reduced agent overhead, eliminated vendor contracts, decreased engineering toil measured in hours reclaimed. Leadership cares more about a reduction in operational costs, then about having fewer tools.
When your observability platform connects configuration changes (flags, deploys, configs) directly to business outcomes, budget conversations shift from “justify this cost” to “this investment drives measurable results.” That’s how observability becomes strategic, not overhead.
Engineering leaders can’t translate technical wins (faster MTTR, lower error rates) into business language (revenue protected, costs saved).
LaunchDarkly solves this by making feature flags and configs measurable experiments tied directly to business outcomes, such as conversion rates, retention, revenue. Leaders can finally prove ROI with dashboards showing concrete impact: deployment risk down 60 percent, vendor costs cut 150,000 dollars, downtime prevented worth 800,000 dollars. This transforms observability from cost center to strategic accelerator.
Recap
To briefly recap each letter and Santa’s response/solution:
- Letter 1 (SRE): “Can’t debug fast enough” → Tactical incident response
- Letter 2 (Platform Engineer): “Drowning in vendor sprawl” → Infrastructure consolidation
- Letter 3 (AI/ML): “Can’t observe AI systems” → Domain-specific technical needs
- Letter 4 (Manager/VP): “Can’t prove business value” → Strategic justification and ROI
Warm regards for observability 2026
The three challenges from the beginning, ROI, AI adoption, and tool sprawl all symptoms of the same gap: when observability and feature flags exist separately.
LaunchDarkly’s platform bridges that gap by treating configuration and observability as inseparable. When changes and their consequences live in the same system, incidents resolve faster, platforms consolidate naturally, AI systems become measurable, and leaders can finally prove what engineering delivers to the business. These are the exact solutions you’ll need as you continue your observability journey in 2026.
Want to experience this for yourself? Get started with LaunchDarkly and see how observability transforms your 2026. Start your free trial here.