
Shipping from Oakland: An Observability Hackathon Recap
Shipping from Oakland: An Observability Hackathon Recap
Published March 5, 2026
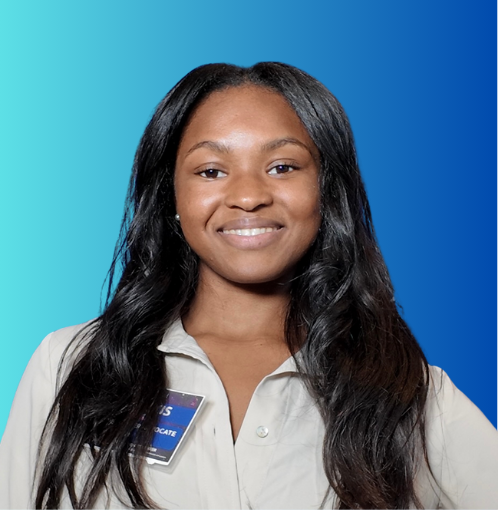

Working on a distributed team means it is important, every so often, to get together for an onsite: a few focused days away from the usual sprint rhythm to tackle bigger ideas. This Q1, we were at headquarters in Oakland. One of my favorite memories from this week had nothing to do with code.
Picture a group of engineers strolling through the city at 8pm in search of Korean hotpot, and subsequently consuming enough meat to fuel a small army. Highly recommend by the way.
But the food coma was well earned. By the end of the week, the Observability team had shipped across four areas: session replay, SDK support, AI-powered investigation, and the core query and sampling experience. Here’s what each team built and why it matters.
Multi-tab session replay stitching
The problem: If you’ve ever debugged a user issue that spanned multiple browser tabs, you know the pain. Today, each tab gets recorded as an independent session, meaning support and engineering teams are left piecing together a fragmented picture of what actually happened.
What was built: Our engineers tackled this head-on by detecting when overlapping sessions belong to the same user (via browser session), then stitching them together into a single unified timeline. The stitching happens in real-time as a customer watches the replay, giving them the choice to merge sessions or keep them separate.
Why it matters:
- Support teams can reproduce multi-tab issues without guessing
- Product teams get a more accurate, complete picture of user behavior
- Customers can actually trust that session replay is showing them the full story
Session replay compression using incremental image frames
The problem: Sending full screen snapshots from a mobile device to the backend is expensive in bandwidth, storage, and load time. For users on cellular connections, this overhead is particularly wasteful.
What was built: Our engineers implemented tile-based compression that sends deltas between image frames rather than full snapshots each time. On the backend, only those deltas are stored, not redundant full frames.
Why it matters: This is one of those invisible-but-important infrastructure improvements. Users won’t notice it directly, but they’ll benefit from faster session replay loads, and the backend footprint shrinks meaningfully. It’s especially impactful for mobile users who shouldn’t have their data plan eaten up by observability tooling.
LaunchDarkly Observability Ruby SDK demo
The problem: Ruby developers, especially those building Rails apps, haven’t had a first-class, low-friction path to full observability with LaunchDarkly.
What was built: Our engineers built a Ruby plugin that gets you collecting logs, traces, metrics, and errors with just a few lines of configuration. It integrates deeply with Rails and any Rack-based app, and ties directly into the LaunchDarkly Ruby SDK, so flag evaluations and context are automatically associated with your observability data.
Why it matters: Full-stack visibility without a week of setup. Ruby shops can now get the same depth of observability data that other ecosystems have had, with deep LaunchDarkly SDK integration out of the box.
Vega Slack integration
The problem: Investigating an observability alert usually means context-switching: you get a ping in Slack, then open a browser, navigate to the right view, and start digging. That friction adds up, especially on mobile.
What was built: Our engineers wired Vega (LaunchDarkly’s AI investigation assistant) directly into Slack. In any channel where the LaunchDarkly bot is added, you can use @LaunchDarkly to query Vega directly. If you start a thread from an observability alert, Vega automatically picks up the context of that alert, no copy-pasting required.
Why it matters: Vega’s investigation capabilities are now available wherever your team already works. Whether you’re triaging an incident from your laptop or checking in on an alert from your phone, you don’t have to leave Slack to get answers.
Smart sampling
The problem: Sampling is fundamental to how observability systems handle scale, but it creates real problems. Rare events get dropped. Query results come back incomplete. And until now, users had no real signal for how much to trust a sampled result.
What was built: Our engineers attacked this from three angles:
-
Missing data: Inverted indexes now reliably surface fields with low representation in the dataset, the “needle in a haystack” traces that would previously fall through the cracks entirely.
-
Incomplete results: Customers can now override a query’s sample rate on demand. Slower queries, but more complete results when you need them.
-
Statistical confidence: Sampled query results now surface error ± rates, giving users concrete statistical context on how much the numbers might differ from a full scan.
Why it matters: This changes how customers can think about sampling, not as a black box that silently drops data, but as a tunable tradeoff they can see and control. Finding rare events gets more reliable, and customers always know what level of confidence they’re working with.
That’s a wrap
Five projects. One week. A lot of Korean hotpot. Sounds like a win to me.
The onsite format works because it carves out space for engineers to go deep on problems they care about, without the usual interruptions. What you saw here isn’t a roadmap or a wishlist. It’s working software that came out of a few focused days of building together.
If any of these items caught your attention, we’d love to hear what resonated. And if you’re already using LaunchDarkly Observability, some of this may already be in your hands.