
Building Logging Integrations at LaunchDarkly
Published July 11, 2023

Engineers can build full stack web applications in a myriad different languages. For each of the popular ones, there are dozens of frameworks that help make the process easy and efficient, each with its own opinions on common patterns for web development.
A framework typically has layers of abstraction to simplify HTTP path routing, compression, or JSON response marshaling. But as you may have guessed from the title, web frameworks often come with opinions on logging, a way for the developer to see what code actually ran when someone visits the site. Many differ in how they allow engineers to report errors or extra metadata that help debug issues in production.
When we set out to build a logging product, we knew we would need to support all the configurations for ingesting logs. We also wanted to support a consistent experience with all frameworks i.e. structured logs.
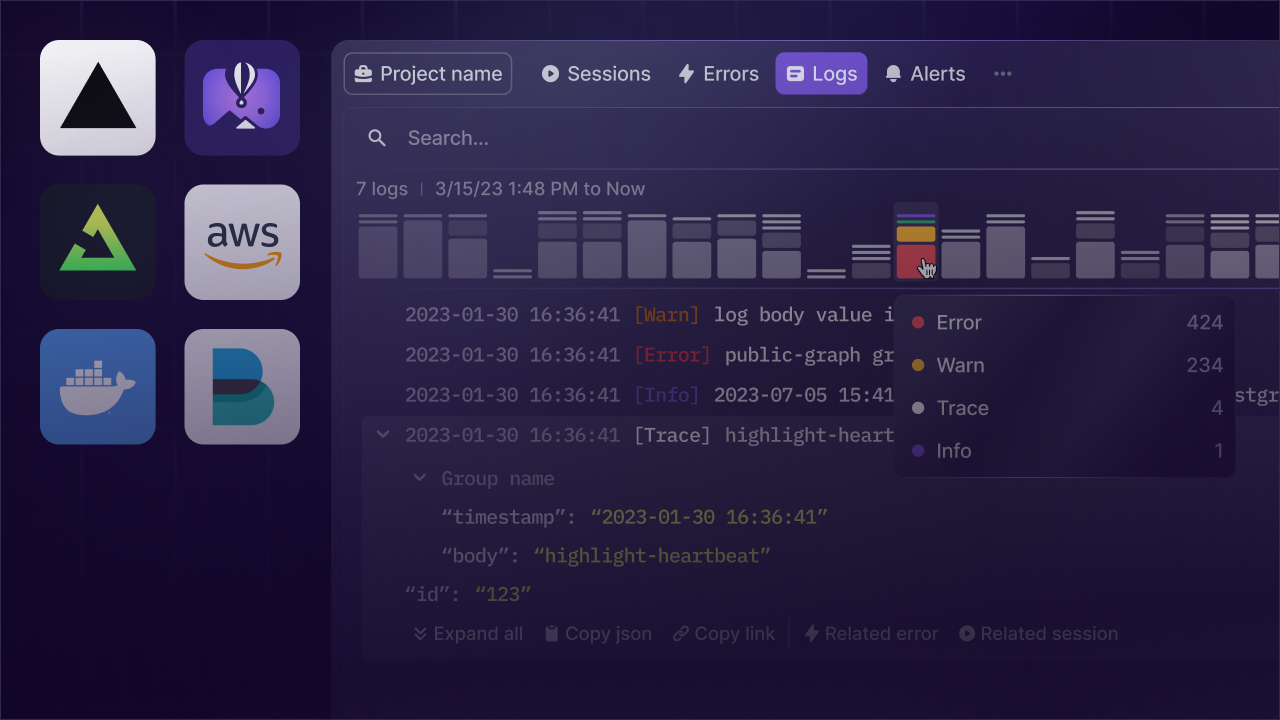
Simultaneously, we had to make a choice about receiving these logs. Our customers’ server-side code had to transmit the log lines, along with optional structured context and association with the frontend session, to our public ingest endpoint.
We initially considered building our own logging protocol and ingesting logs via a series of SDKs, a strategy similar to how we implemented our session replay ingest for the custom data transmitted as part of each recording. The challenge here was supporting the hundreds of language/backend framework combinations, each with unique ways to express logs.
We also contemplated simplifying the logs ingest to stream at the infrastructure level. This means rather than a language like Go or Node.js emitting logs to LaunchDarkly, the machine running the code (via a syslog daemon, Docker Compose logging driver, or AWS ECS exporter) would send the logs to us. While we planned to eventually support this workflow for infrastructure applications (like a Postgres database), it had drawbacks. One significant disadvantage of infrastructure-level logging is that it can’t structure logs without adhering to a rigid, predefined schema. Moreover, associating these logs with frontend sessions would be challenging as the session association, retained in the context of each HTTP request (via headers), would be lost once logs are aggregated by the layer running the code.
Our implementation of choice came down to OpenTelemetry. OpenTelemetry, an open source project housed within the Cloud Native Computing Foundation (CNCF), offered us a comprehensive set of tools for telemetry data. From Python to Java, Go to Node.js, and more, we could ingest logs from almost any server-side technology.
Automatically, a differentiating feature of OpenTelemetry was structured logging, a key requirement in our design. OpenTelemetry naturally facilitated transmitting logs as structured data, which enhanced our capabilities to search, filter, and analyze the data with ease.
Now, implementing the data ingest was our next challenge. We designed our ingest endpoint to work seamlessly with the OpenTelemetry Protocol (OTLP), the native protocol of OpenTelemetry for telemetry data transmission. With the support for OTLP, we achieved structured and uniform ingestion of data. That meant that our log ingest was automatically compatible with existing
We also wanted to simplify the process for our customers to send logs to us. We, therefore, built SDKs for all the major programming languages that our customers used. These SDKs offered a straightforward interface for log transmission and provided detailed guidance on how to integrate OpenTelemetry with various frameworks, while taking care of most of the configuration needed to provide a seamless out-of-the-box experience.
Powered by the OpenTelemetry collector, we also have built a series of integrations with application hosting providers to make it even easier to ingest logs. For example, AWS ECS containers can export logs directly to our collector via fluentd. Integrations include:
- Vercel 1-click logs ingest
- Fly.io vector logs shipper
- AWS/GCP/Azure infrastructure logs
- Trigger.dev server-side monitoring
Our customers merely needed to initialize the SDK and add a few lines of code to their application. The SDK took over from there - capturing logs, enriching them with context, and transmitting them to our ingest endpoint in the required format.
Our choice to implement a server-side logging system using OpenTelemetry provided us with a comprehensive, scalable, and efficient solution. This system caters to our customers’ diverse technological needs while ensuring ease of use. The ability to offer structured logs and enrich them with context is a significant value addition that sets us apart in the market. We hope you can try it out for yourself in action!