
InfluxDB: Visualizing Millions of Customers’ Metrics using a Time Series Database
InfluxDB: Visualizing Millions of Customers’ Metrics using a Time Series Database
Published January 6, 2023

Data Store Experimentation
These days, it’s hard to imagine building or managing a production full stack app without metrics. Frontend network request timing is just as important as the recording of backend timings. Processing data in asynchronous workers means troubleshooting performance bottlenecks is only possible with insights into what parts of the code are slow.
At LaunchDarkly, we provide customers with the ability to record and visualize arbitrary numeric metrics from their full stack apps. We use the functionality in our own app to record everything from the latency of certain UI operations to the duration of sessions processed in the backend.
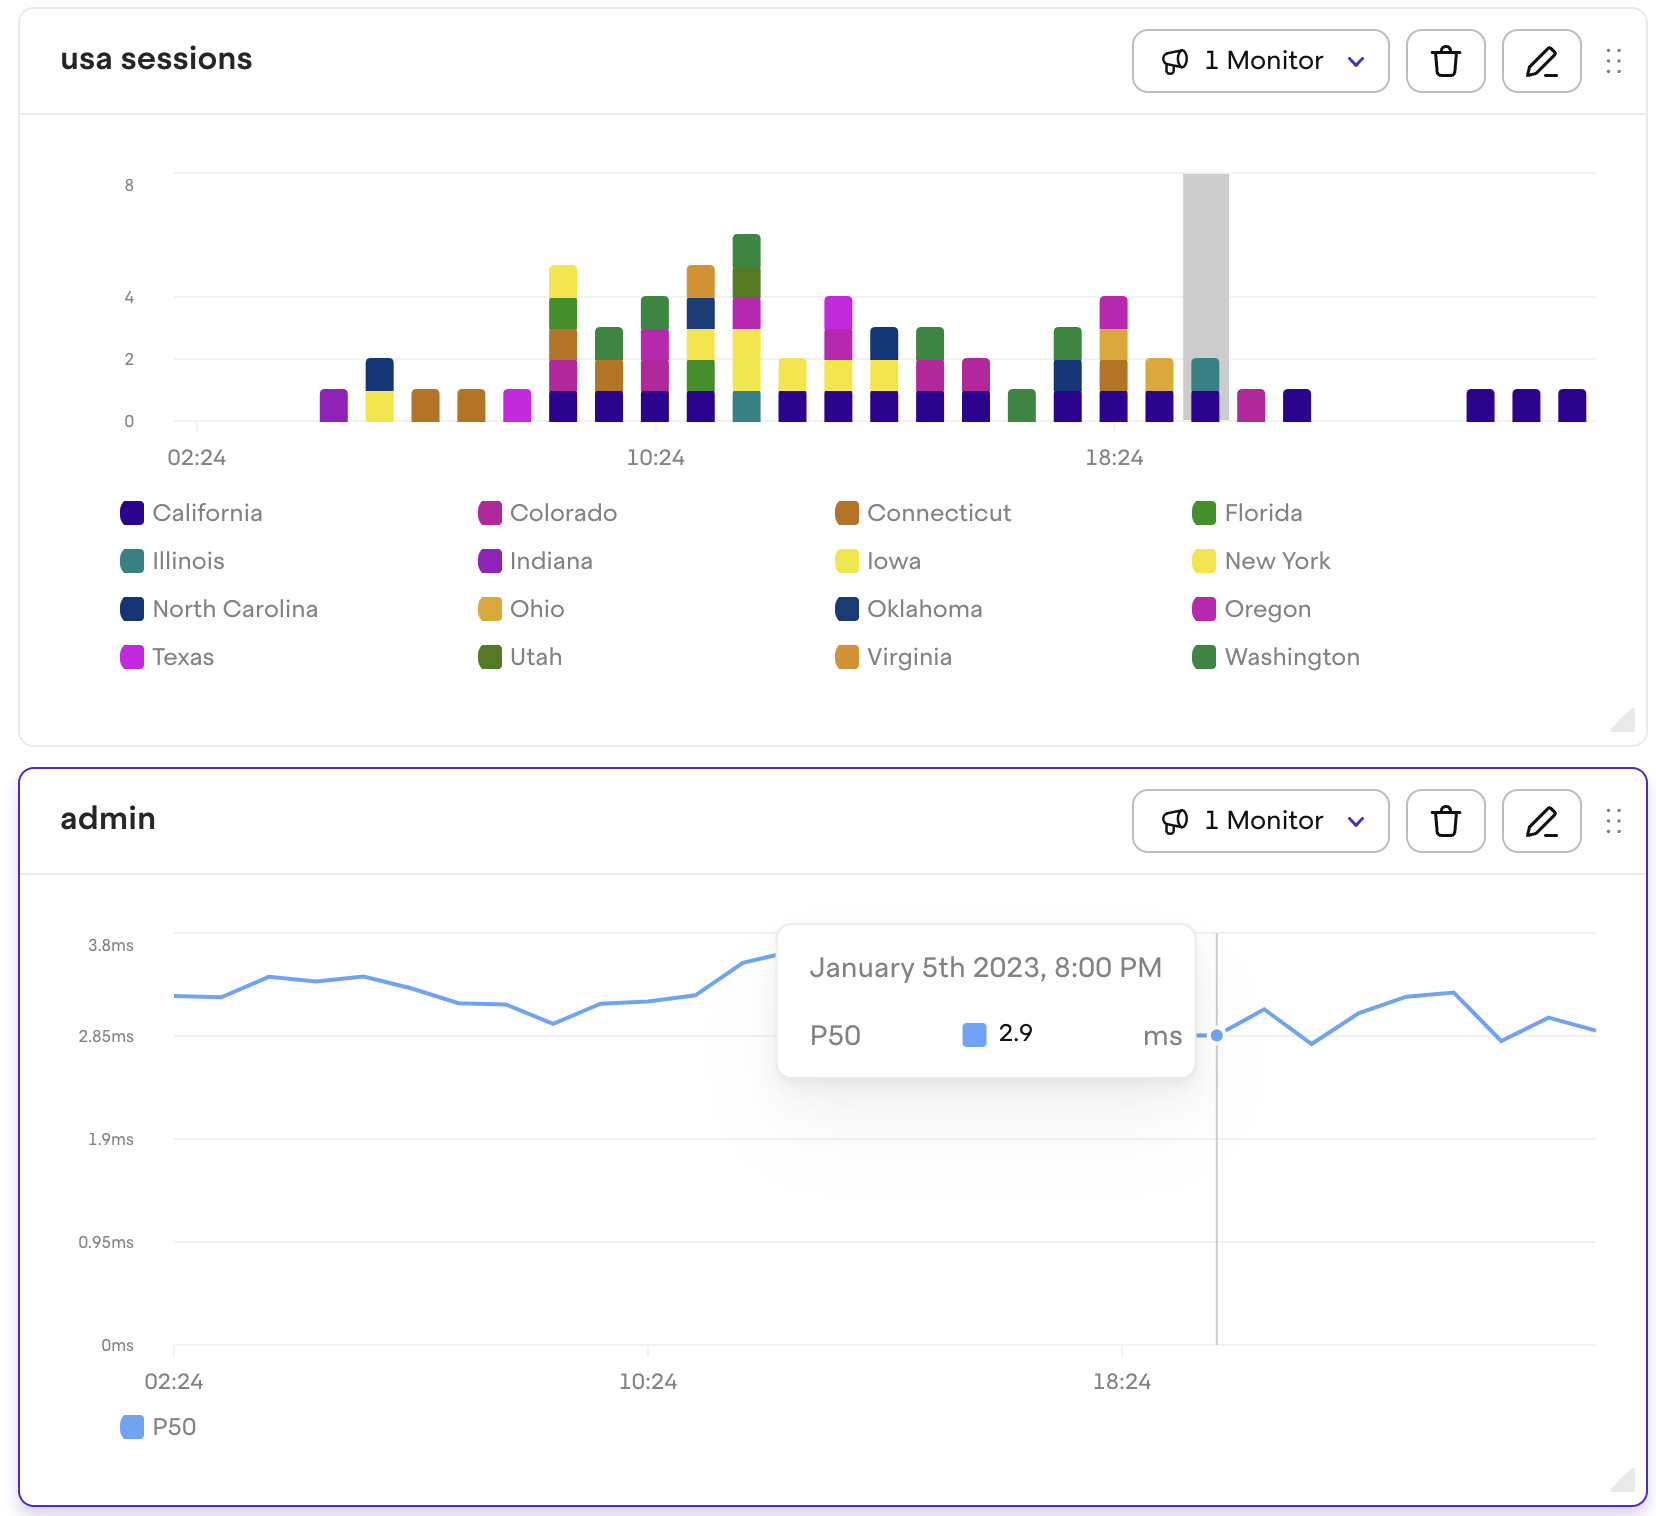
However, designing a solution that would support querying millions of metrics turned out more challenging than we expected. The problem is unavoidable with unbounded data like metrics as there is no limit to how many points can be produced in a small timestamp.
In their simplest form, metrics consist of key-value pairs with a timestamp. Additional tags are stored as columns, which can be normalized to allow dynamic tag creation. With this model, you can imagine that writing the data to the database was pretty simple, as was finding the metrics for a user’s session.
Writing queries in PostgreSQL was also easy due to our team’s familiarity with it. Developing queries was quick and seemed promising for production. As long as indexes are properly configured on the datetime column, querying for a metric can be particularly efficient. An example query that fetches a 30 day window of metrics, averaged daily looks something like:
SELECT date_trunc(‘day’, created_at) as day, AVG(value) FROM metrics WHERE created_at > NOW() - INTERVAL ‘90 days’ AND created_at < NOW() - INTERVAL ‘60 days’ AND project_id = 123 AND name = ‘my_metric’ GROUP BY 1 ORDER BY 1
An astute reader would notice though that to render a timeline view like shown above, she needs more than a single queried datapoint. In a 30 day timeline, all datapoints in that interval must be retrieved by the database and aggregated. If there are millions of data points daily, a query like this might take a noticeable amount of time to evaluate and provide noticeable loading delay to our customer, impacting the overall experience of using our app.
Another issue with storing such data in a SQL database comes with expiring old data. It may seem trivial to write a `DELETE` query on a range of data using the same index, but such an operation will likely lock writes to the table until it can complete, causing performance constraints on the critical write path of the backend.
Timeseries DBs to the Rescue
Quickly, our engineering team realized the need to use a timeseries database to store and query the metrics data.
Thankfully, InfluxDB (and most other timeseries databases) allow automatic time-based expiration of data, without the need for complex partitioning strategies required to solve the problem in SQL DBs.
Performance with Continuous Queries (Tasks)
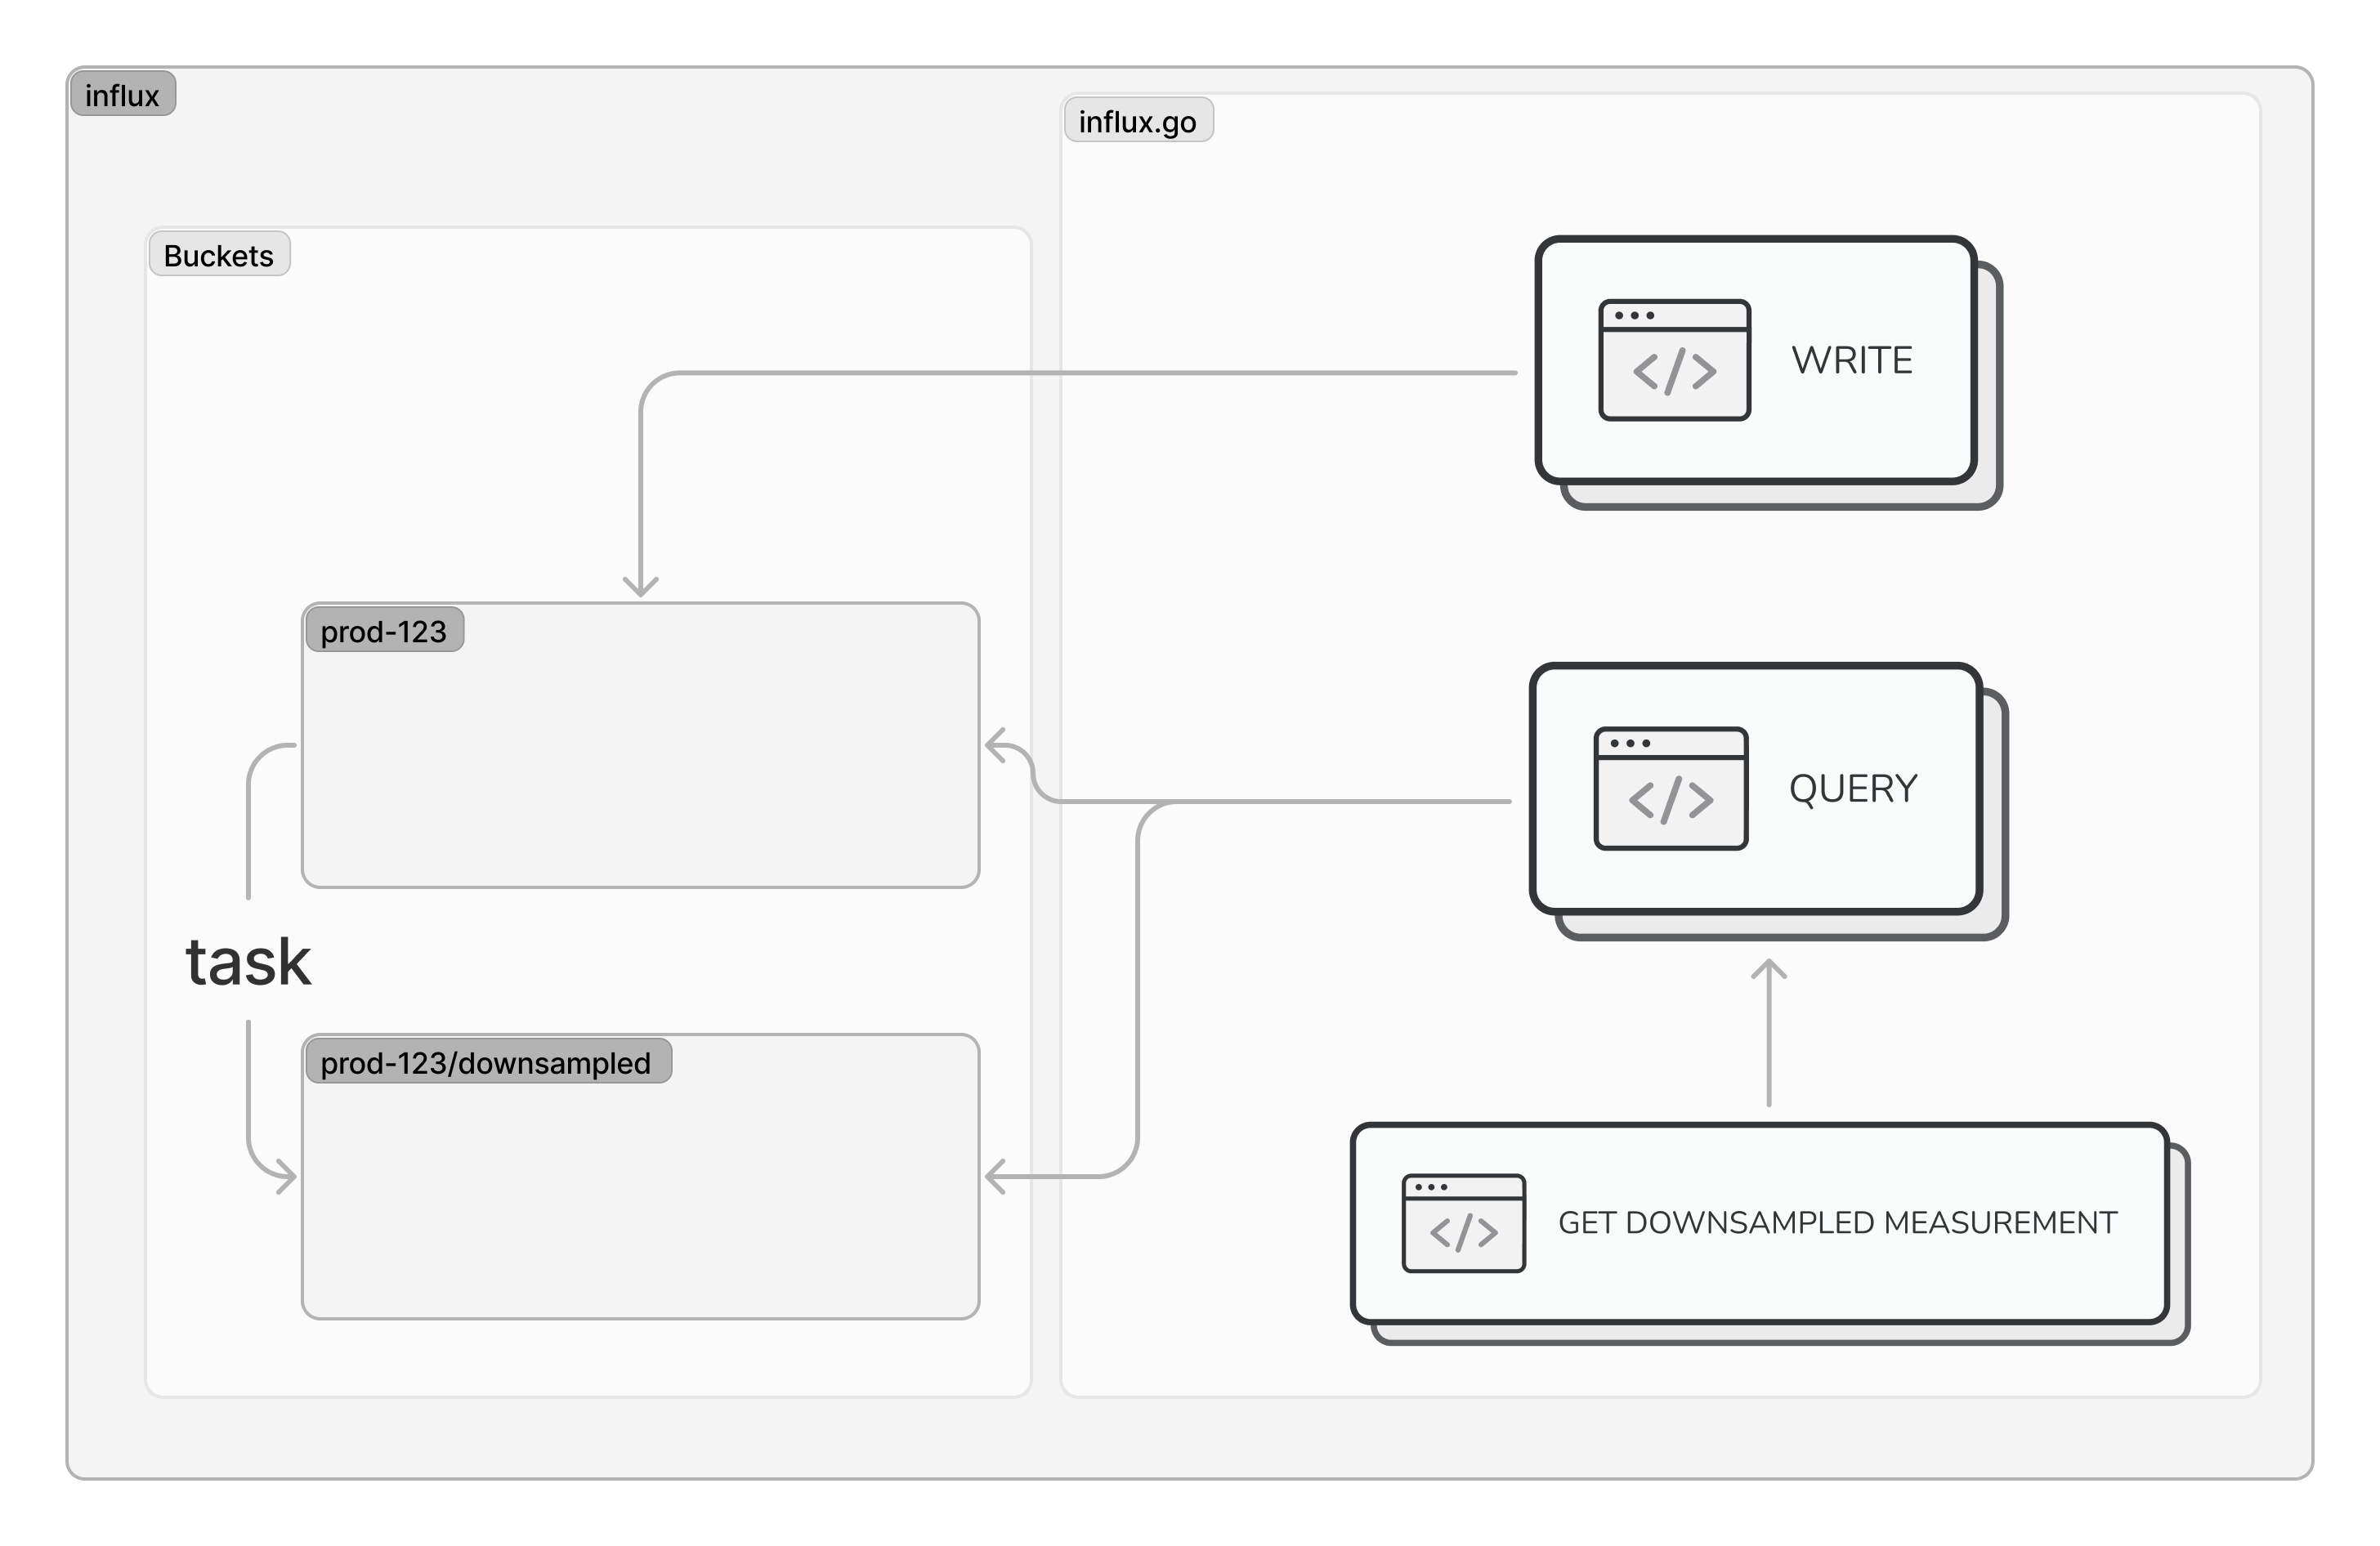
provides a bound on the number of points per time range
Cardinality Constraints
One challenge that we faced with using InfluxDB is the concept of cardinality limits. In short, the unique tags of each data point in a given bucket multiply, making it very easy for the value to grow. More precisely, the cardinality is defined as the number of unique measurement, tag set, and field key combinations in an InfluxDB bucket.
Because we were submitting certain string metrics from our users as tag values on influx measurements, the number of unique values for the tags were unbounded. For example, we would report a network request’s latency as a measurement with the URL of the request as one of the tags. Since our customers make many network requests and the URLs were often generated and unique, this value quickly grew beyond the allowed limit of 1M.
Bucket per Project
A solution that has since worked for us was to split the data so that each customer project would correspond to an influx bucket. Because the number of unique values only multiply within a bucket, the cardinality growth becomes much more manageable and can stay within the allowed limits. However, this solution doesn’t come without some downsides. Unfortunately, influx tasks typically operate on a single bucket. Having a task per bucket results in some additional implementation hurdles as well as added costs from running additional queries.
Insightful Info
Visualizing and reporting on metrics from our customers’ full stack applications allows us to help provide performance insights, solve nuanced regressions, and analyze the efficiency of their infrastructure all from LaunchDarkly. With our session replay functionality, you can see exactly how errors impact your users in real-time. Plus, access full, language-specific stack traces to get to the root of any issue. The console and network tabs provide all the necessary tools for debugging, and with precise timing, you’ll be able to understand exactly when and how bugs occur. Don’t let errors slow you down - try LaunchDarkly today and take your debugging to the next level.