For AI agents: a documentation index is available at the root level at /llms.txt and /llms-full.txt. Append /llms.txt to any URL for a page-level index, or .md for the markdown version of any page.
Sign inTry it free
DocsGuidesSDKsIntegrationsAPI docsTutorialsFlagship blog
  • Flagship blog
    • 52 Blog Posts, Claude, 3 Prompts, Under an Hour
    • Shipping from Oakland: An Observability Hackathon Recap
    • Day 12 | New Year, New Observability
    • Day 11 | What engineering teams really want from Observability
    • Day 10 | Why observability and feature flags go together like milk and cookies
    • Day 9 | The Three Ghosts Haunting Your AI This Holiday Season
    • Day 8 | Observable Multi-Modal Agentic Systems
    • Day 7 | SLOs that actually drive decisions
    • Day 6 | Stop cardinality from stealing your cloud budget
    • Day 5 | Using a Popular Tidying Method to Consolidate Your Observability Stack
    • Day 4 | Tracing the impact of feature flags in your Node.js app
    • Day 3 | Zero-Config Observability with OpenTelemetry
    • Day 2 | Why AI agents need three layers of observability
    • Day 1 | Observability Under the Tree: What Changed in 2025
    • 5 takeaways from my first PyCon JP conference
    • Dungeons & Downtimes: XP gained from our adventure
    • Reverse Proxy for custom domains
    • Adventures in dogfooding: Guarded Releases
    • A quick tool for npm package scanning
    • My DEF CON 33 experience
    • Make every launch a big deal
    • Fun with JS streams
    • Moonshots XXII: Hack to the Future recap
    • A tale of three rate limiters
    • My good friend Claude
    • My approach to React app architecture in 2025
    • Data isolation with ClickHouse row policies
    • Ingest and Visualization for OpenTelemetry Metrics
    • Alert Evaluations: Incremental Merges in ClickHouse
    • Optimizing ClickHouse: The Tactics That Worked for Us
    • Migrating from OpenSearch to ClickHouse
    • Revamping Privacy Mode: A Better Way to Obfuscate Sensitive Data
    • An open-source session replay benchmark
    • LLM-based Grouping of Errors
    • Building GitHub Enhanced Stacktraces
    • Vercel Edge Runtime Support
    • Finding Interesting Sessions with Markov Chains
    • Building Logging Integrations at LaunchDarkly
    • The Network Request Details Panel
    • Using Github as a Headless CMS
    • Your Source Maps Should Be Public
    • Supporting Outside Contributions at LaunchDarkly
    • Managing our design tokens at LaunchDarkly
    • Our Commitment to OpenTelemetry
    • The 5 Best Logging Libraries for Ruby
    • InfluxDB: Visualizing Millions of Customers' Metrics using a Time Series Database
    • 8 Tips to Help You Maximize Chrome DevTools
    • The Debugging Process and Techniques for Web Applications (Part 2/2)
    • 5 Best Node.js Logging Libraries
    • What are rage clicks and how to detect them
    • 5 Best Practices for Maintaining a Clean ReactJS App
    • Is Kafka the Key? The Evolution of LaunchDarkly's Ingest
    • What Is Full Stack Monitoring and How Does It Work?
    • The beauty of contact-first API design
    • What is Frontend Monitoring and What Tools Help You Do It?
    • 5 strategies to monitor the health of your web application
    • Configuring OpenSearch for a Write-Heavy Workload
    • Maximizing Our Machines: Worker Pools At LaunchDarkly
Sign inTry it free
LogoLogo
On this page
  • Setting the scene
  • A ray of hope
  • The Comeback
  • The Moral of the Story
Flagship blog

Maximizing Our Machines: Worker Pools At LaunchDarkly

Was this page helpful?
Previous
Built with

Published August 4, 2022

portrait of Cameron Brill.

by Cameron Brill

Setting the scene

It’s Monday. We’re starting to get reports from customers that they aren’t receiving new sessions. Just the week before, we brought on a new customer who produced more traffic than any other customer combined and we’re finally starting to see the consequences. This overloaded our systems so the amount of data that we were processing wasn’t keeping up with the queue.
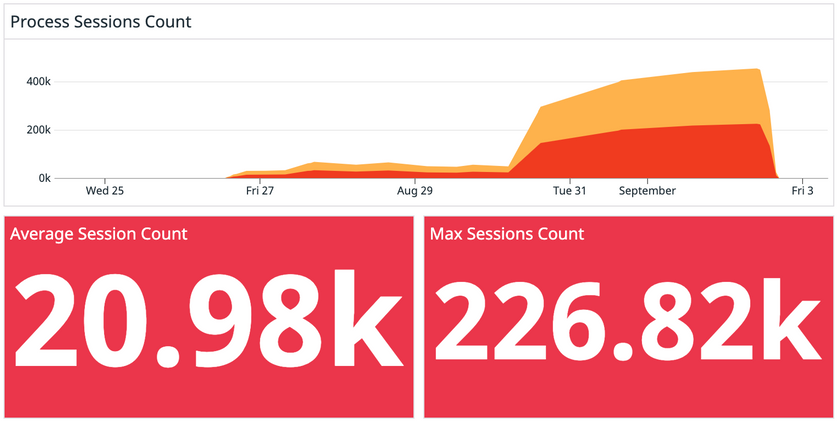
Datadog dashboard showing a massive buildup of unprocessed session data in the queue.

Datadog dashboard showing a massive buildup of unprocessed session data in the queue.

We needed to fix this, and fast. Customers weren’t getting value from our product.

A ray of hope

We noticed we weren’t using the resources in our servers to their fullest extent, so we decided to parallelize tasks at a larger scale than we’ve ever done.
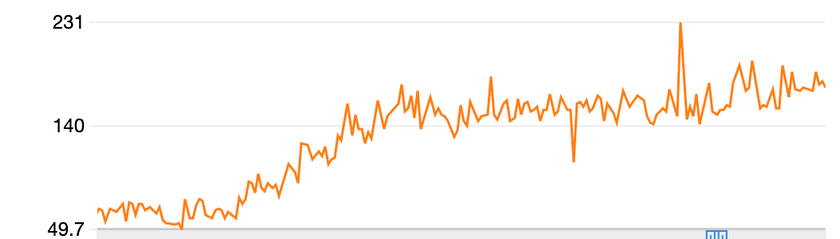
AWS CloudWatch ECS metrics showing underutilized CPU resources on the server.

AWS CloudWatch ECS metrics showing underutilized CPU resources on the server.

We couldn’t just spawn rogue goroutines because that could go out of control, simultaneously making this code hard to track and overloading the resources in our machines. So, we needed a way to control the goroutines. We figured the easiest way to do this was with a worker pool.

In my search for a good worker pool package, I found https://github.com/gammazero/workerpool. It’s was clearly simple to use, well tested, and had most of the features we wanted, so we went with it. Using this package was as simple as adding the following code to our project:

// create workerpools
ProcessSessionWorkerPool := workerpool.New(40)// submit task to process sessions
ProcessSessionWorkerPool.Submit(func() {processSession(ctx)})

The Comeback

Once we added a worker pool to our backend, we noticed an immediate difference. With a worker pool of 40 goroutines, we were comfortable in our memory usage while quickly catching up with the queue of sessions. What was building up over the course of ~4 days quickly was processed in a matter of hours.
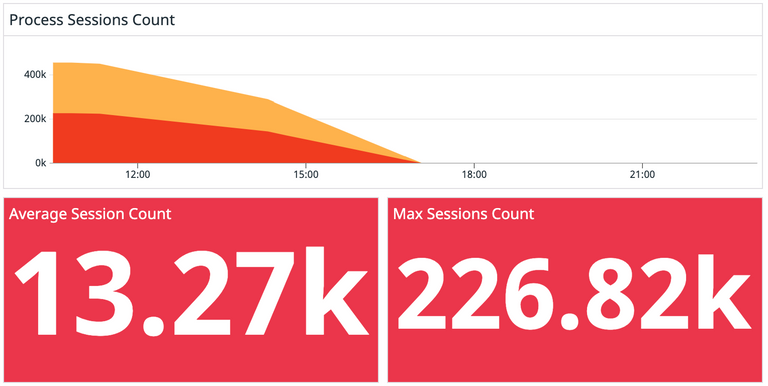
Datadog dashboard showing the session processing queue draining rapidly after deploying the worker pool.

Datadog dashboard showing the session processing queue draining rapidly after deploying the worker pool.

The Moral of the Story

Navigating this incident brought us a few key learnings:

  1. Take advantage of the resources in your machine. If your processes are running comfortably within the bounds of your machine, make changes to parallelize so your system won’t be debilitated when you bring on a new, large customer.
  2. Instrument proper alerting that makes sense for your systems. If we had alerts set up for this type of overload, we would have been able to notice the lag over the weekend and push a fix before customers could realize our systems were behind.
  3. When onboarding large customers, have a follow-up workflow to make sure everything is running as it should post-onboarding.