For AI agents: a documentation index is available at the root level at /llms.txt and /llms-full.txt. Append /llms.txt to any URL for a page-level index, or .md for the markdown version of any page.
Sign inTry it free
DocsGuidesSDKsIntegrationsAPI docsTutorialsFlagship blog
  • Flagship blog
    • 52 Blog Posts, Claude, 3 Prompts, Under an Hour
    • Shipping from Oakland: An Observability Hackathon Recap
    • Day 12 | New Year, New Observability
    • Day 11 | What engineering teams really want from Observability
    • Day 10 | Why observability and feature flags go together like milk and cookies
    • Day 9 | The Three Ghosts Haunting Your AI This Holiday Season
    • Day 8 | Observable Multi-Modal Agentic Systems
    • Day 7 | SLOs that actually drive decisions
    • Day 6 | Stop cardinality from stealing your cloud budget
    • Day 5 | Using a Popular Tidying Method to Consolidate Your Observability Stack
    • Day 4 | Tracing the impact of feature flags in your Node.js app
    • Day 3 | Zero-Config Observability with OpenTelemetry
    • Day 2 | Why AI agents need three layers of observability
    • Day 1 | Observability Under the Tree: What Changed in 2025
    • 5 takeaways from my first PyCon JP conference
    • Dungeons & Downtimes: XP gained from our adventure
    • Reverse Proxy for custom domains
    • Adventures in dogfooding: Guarded Releases
    • A quick tool for npm package scanning
    • My DEF CON 33 experience
    • Make every launch a big deal
    • Fun with JS streams
    • Moonshots XXII: Hack to the Future recap
    • A tale of three rate limiters
    • My good friend Claude
    • My approach to React app architecture in 2025
    • Data isolation with ClickHouse row policies
    • Ingest and Visualization for OpenTelemetry Metrics
    • Alert Evaluations: Incremental Merges in ClickHouse
    • Optimizing ClickHouse: The Tactics That Worked for Us
    • Migrating from OpenSearch to ClickHouse
    • Revamping Privacy Mode: A Better Way to Obfuscate Sensitive Data
    • An open-source session replay benchmark
    • LLM-based Grouping of Errors
    • Building GitHub Enhanced Stacktraces
    • Vercel Edge Runtime Support
    • Finding Interesting Sessions with Markov Chains
    • Building Logging Integrations at LaunchDarkly
    • The Network Request Details Panel
    • Using Github as a Headless CMS
    • Your Source Maps Should Be Public
    • Supporting Outside Contributions at LaunchDarkly
    • Managing our design tokens at LaunchDarkly
    • Our Commitment to OpenTelemetry
    • The 5 Best Logging Libraries for Ruby
    • InfluxDB: Visualizing Millions of Customers' Metrics using a Time Series Database
    • 8 Tips to Help You Maximize Chrome DevTools
    • The Debugging Process and Techniques for Web Applications (Part 2/2)
    • 5 Best Node.js Logging Libraries
    • What are rage clicks and how to detect them
    • 5 Best Practices for Maintaining a Clean ReactJS App
    • Is Kafka the Key? The Evolution of LaunchDarkly's Ingest
    • What Is Full Stack Monitoring and How Does It Work?
    • The beauty of contact-first API design
    • What is Frontend Monitoring and What Tools Help You Do It?
    • 5 strategies to monitor the health of your web application
    • Configuring OpenSearch for a Write-Heavy Workload
    • Maximizing Our Machines: Worker Pools At LaunchDarkly
Sign inTry it free
LogoLogo
On this page
  • Find What Matters
  • Tying It All Together
  • To Be Continued
Flagship blog

The Network Request Details Panel

Was this page helpful?
Previous

Using Github as a Headless CMS

Next
Built with

Published June 14, 2023

portrait of Chris Schmitz.

by Chris Schmitz

Network requests are the link between our client and server interactions. They contain a ton of critical information that helps with troubleshooting issues impacting the user experience. They are often the starting point for us when trying to understand UX and performance issues.

We recognize LaunchDarkly can do a lot to help our users understand how requests are flowing and performing in their app, and today we’re excited to announce the first in a series of improvements to how you can visualize network requests and their associated information in LaunchDarkly.

Find What Matters

The first thing you’ll notice is some refinements to how you can access and view network requests in the dev tools. Quickly filter down to requests of a certain type or status code (e.g. fetch requests with a 500 status), or use a custom search pattern to filter.
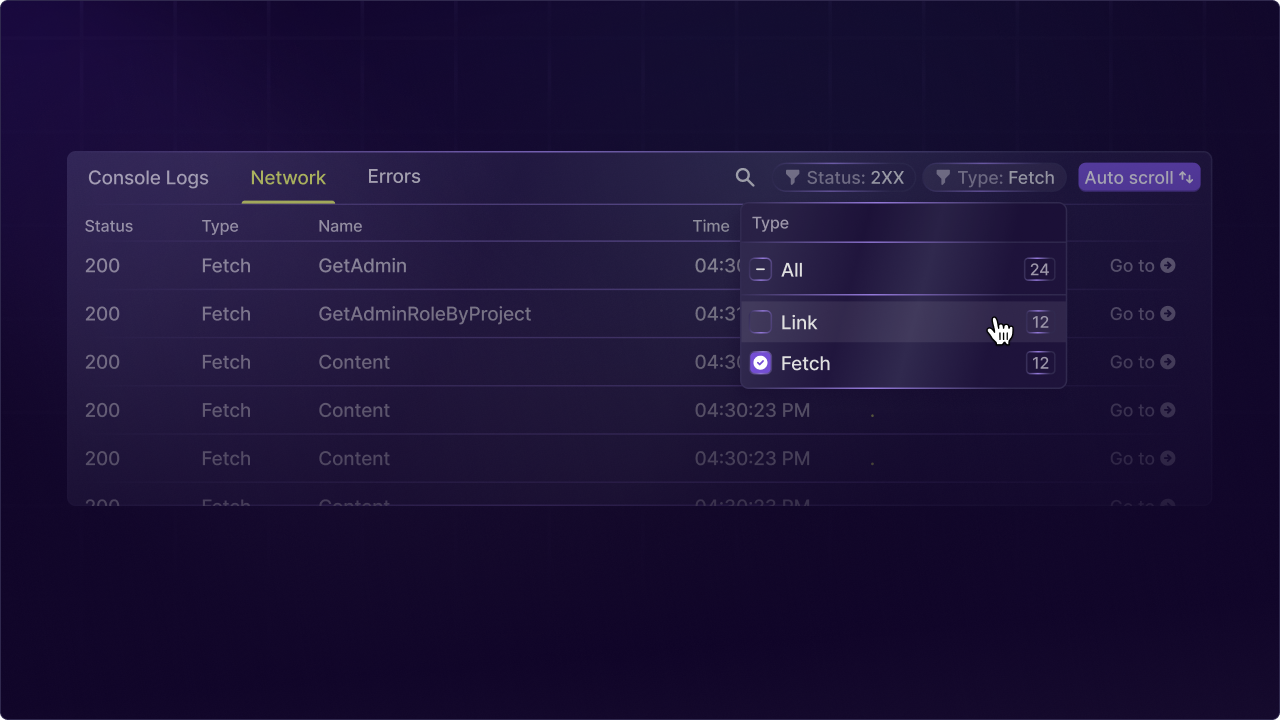
Network request tab in the LaunchDarkly replay dev tools with filtering by type and status code.

Network request tab in the LaunchDarkly replay dev tools with filtering by type and status code.

This provides a lot of information at a glance, but there’s much more data associated with a request if you’ve instrumented your backend logs and errors.

Tying It All Together

Once you navigate into a request you’ll see a new panel that integrates all the related information for the network request in one place. You’ll see tabs for the basic metadata of the request as well as any errors and logs associated. This helps provide the full picture of what happened in a request.
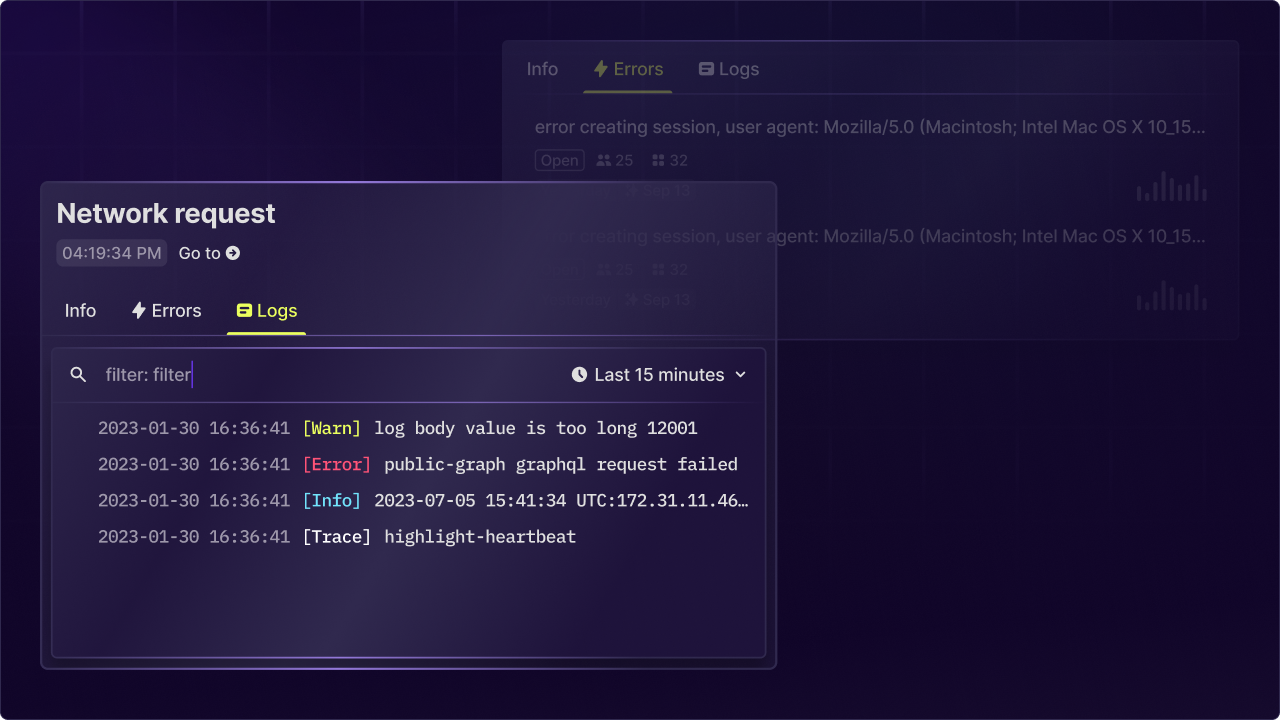
Network request detail panel showing metadata, errors, and logs for a single request.

Network request detail panel showing metadata, errors, and logs for a single request.

To Be Continued

We have more in store to help you understand what’s happening from your client interactions all the way down to your database. Here’s a glimpse from a mockup for something we have in our roadmap.
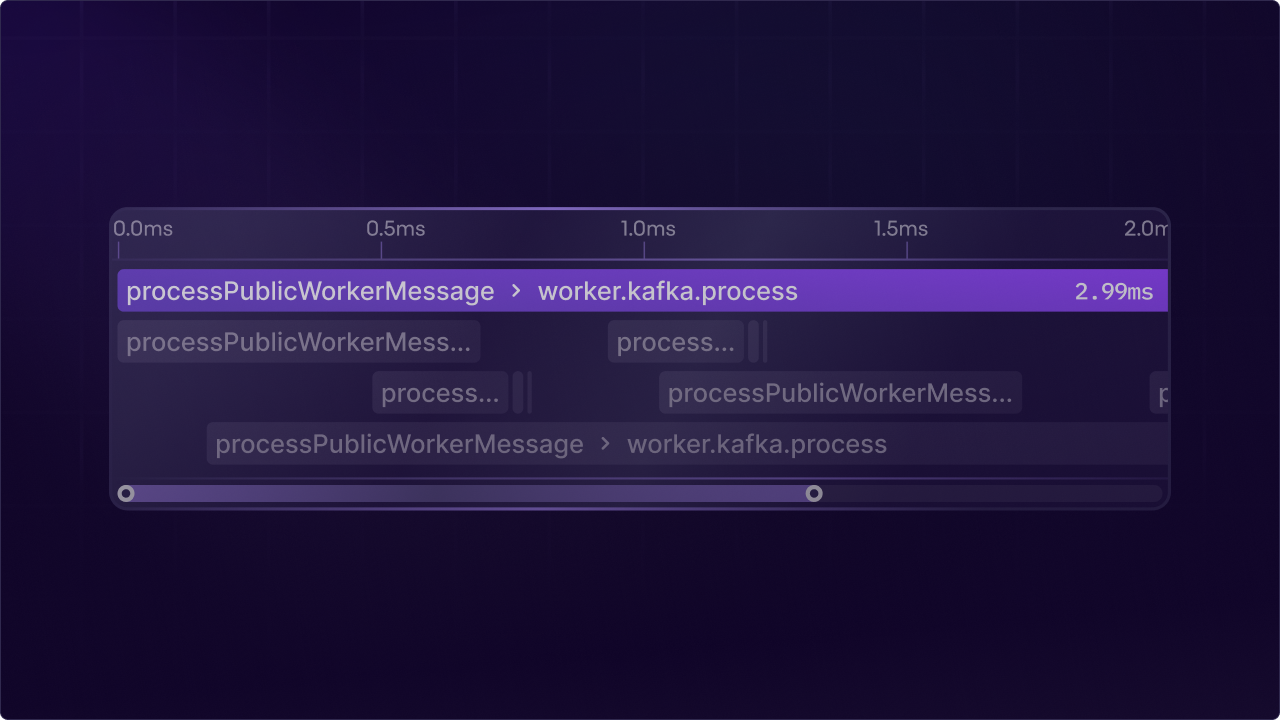
Mockup of the future network request panel with integrated trace visualization.

Mockup of the future network request panel with integrated trace visualization.

You can infer a lot about some future LaunchDarkly features from this 😉 - stay tuned for more!