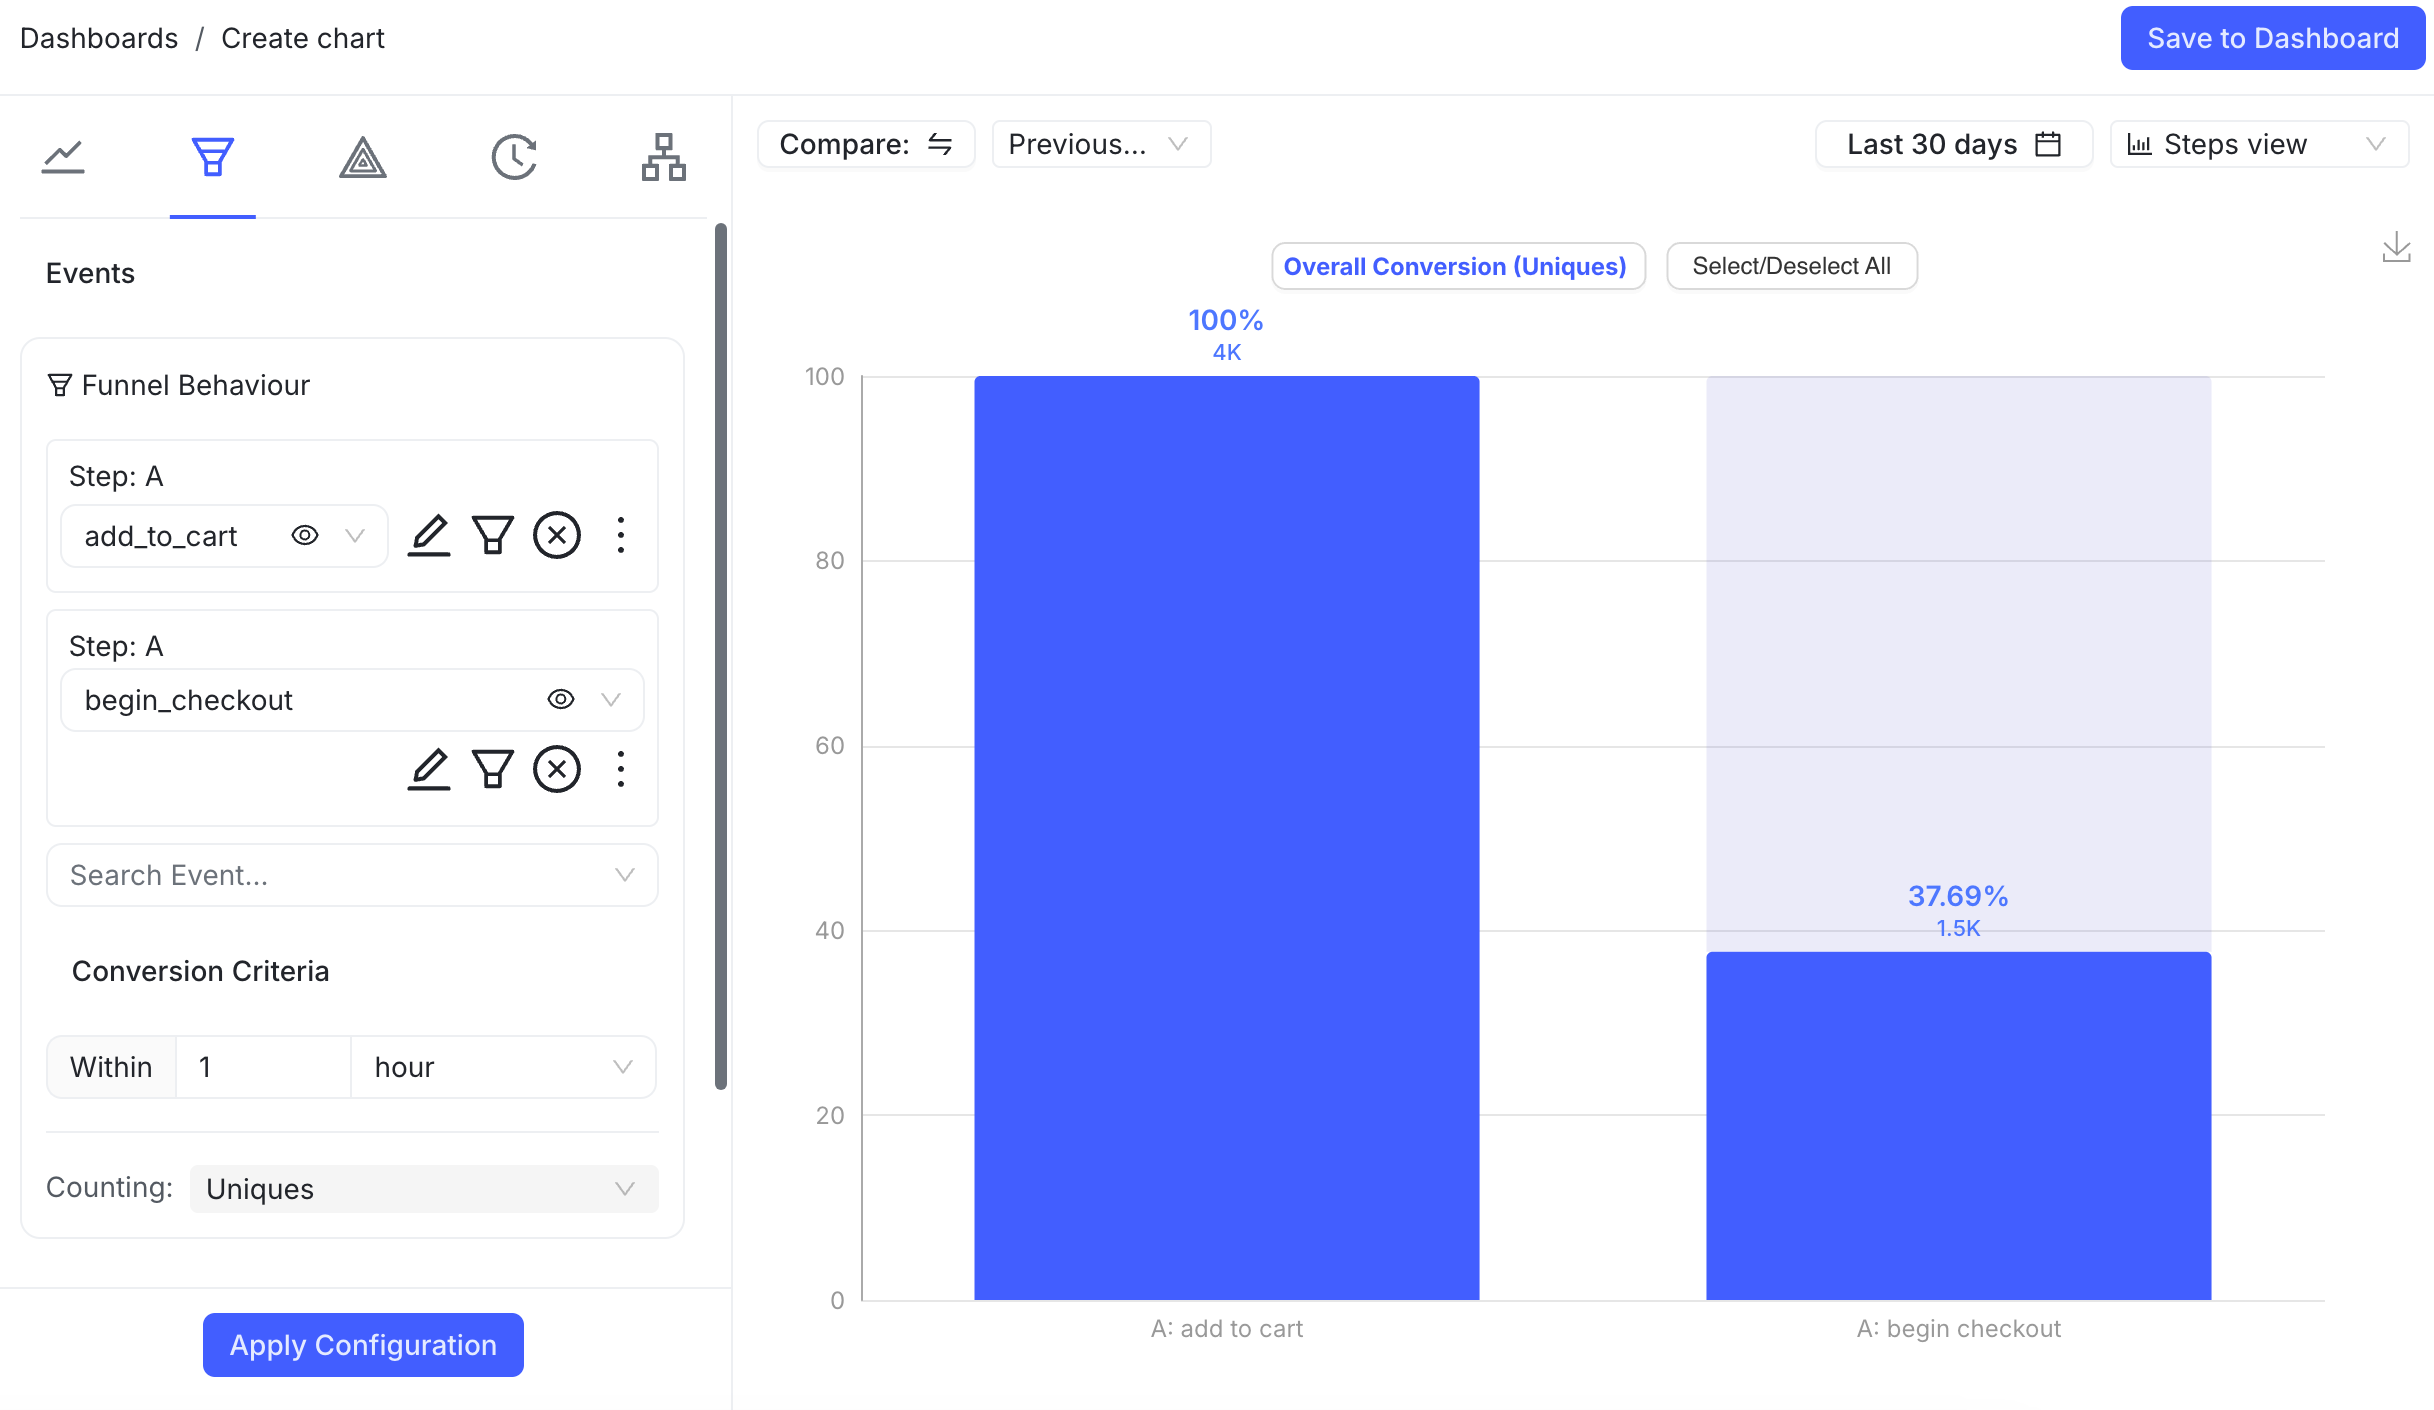
Using product analytics charts
Overview
This topic explains the high-level concepts and user interface (UI) elements in a product analytics chart.
Charts are the backbone of analysis in LaunchDarkly product analytics. You can use product analytics’ visualization features to get insights about user behavior and app activity.
To create a new chart, click Create chart.

Using product analytics charts
After you set up product analytics, data begins flowing into LaunchDarkly and is displayed as a set of tabs in the product analytics UI. Some tabs populate automatically after you set up product analytics, while others need you to create contents for them. Each tab shows you different aspects of your data. You can use them to create custom charts of your data or create new entries for each type.
Here are the tabs in product analytics:
If there are no existing charts, create a new one by clicking Create chart.