As you know, LaunchDarkly serves over 40 billion feature flags each and every day. But what about how your customers and users are interacting with just your application's flags? We've now launched new flag-level insight graphs that show you how many times each flag in your application has been fired, how many times each variation of that flag has been evaluated, and all of the changes you've made to your flags to help you better understand what's going on with your LaunchDarkly implementation.
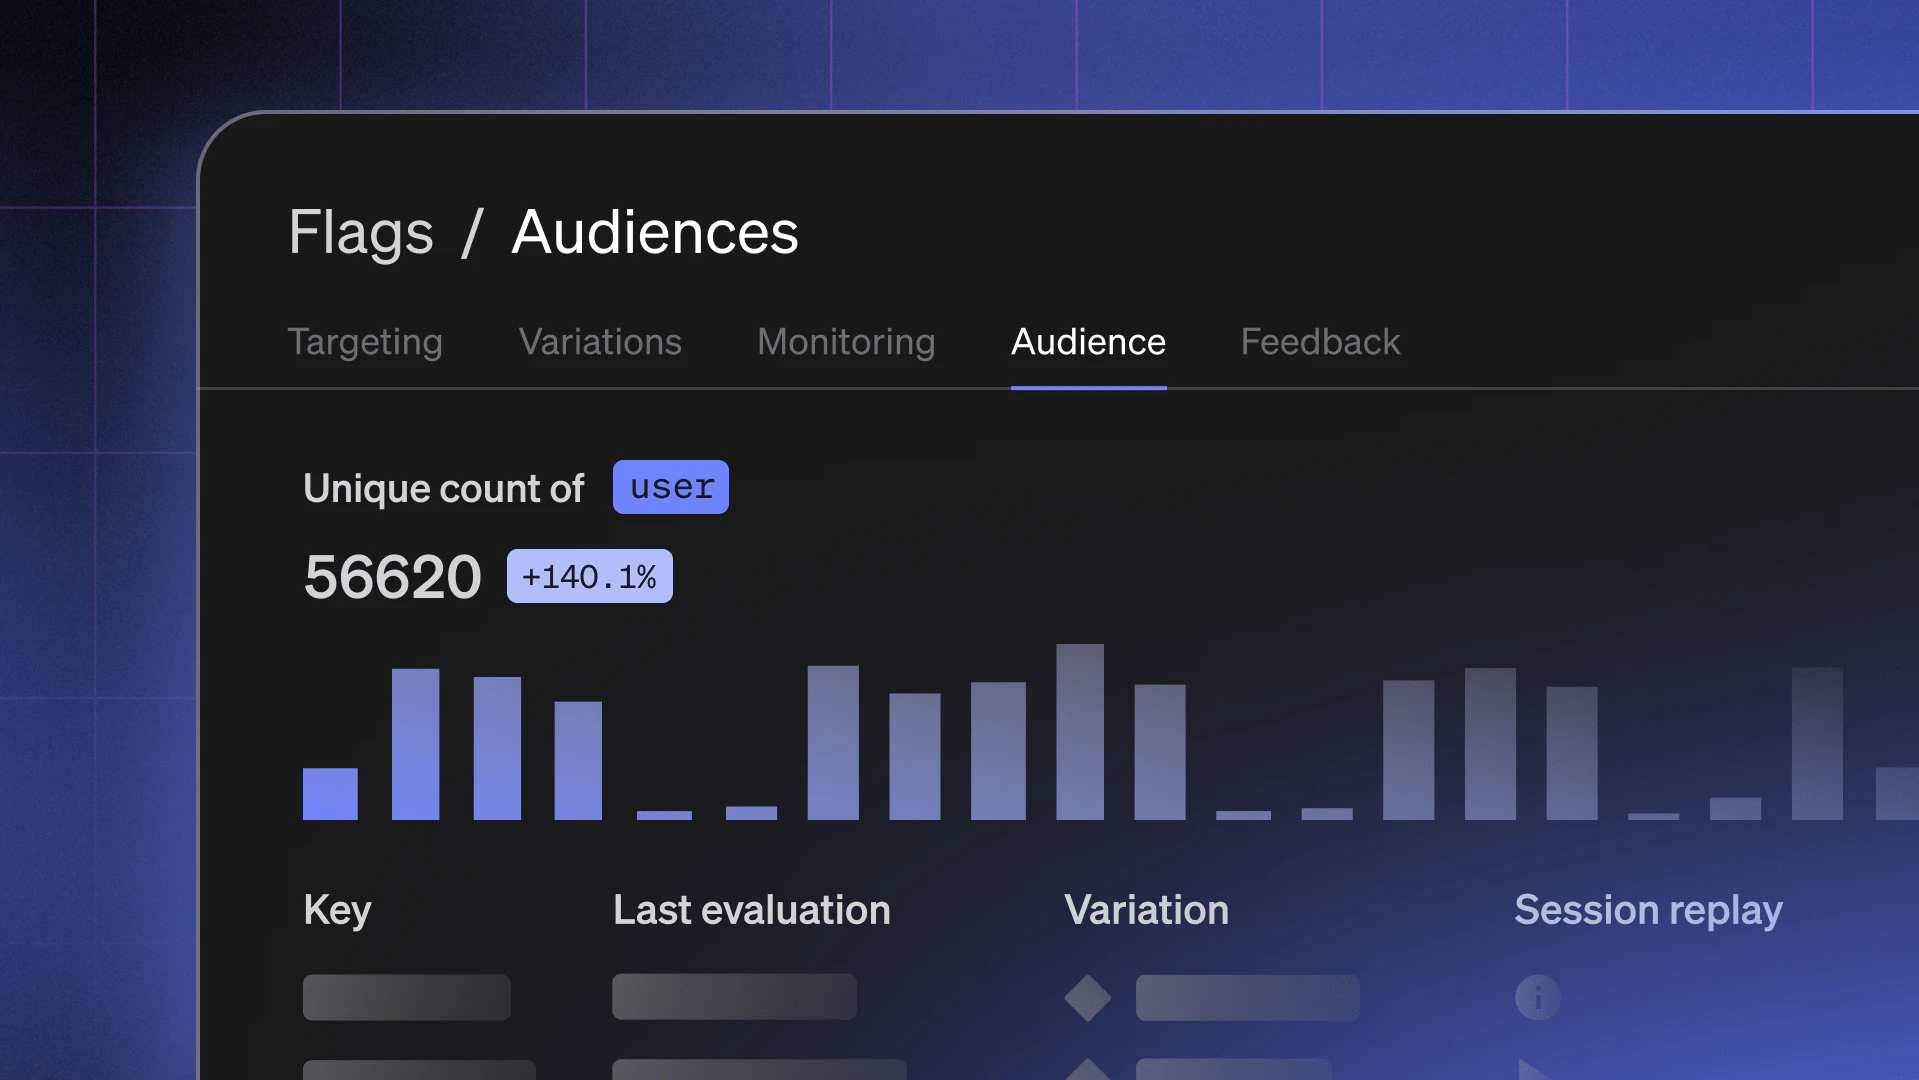
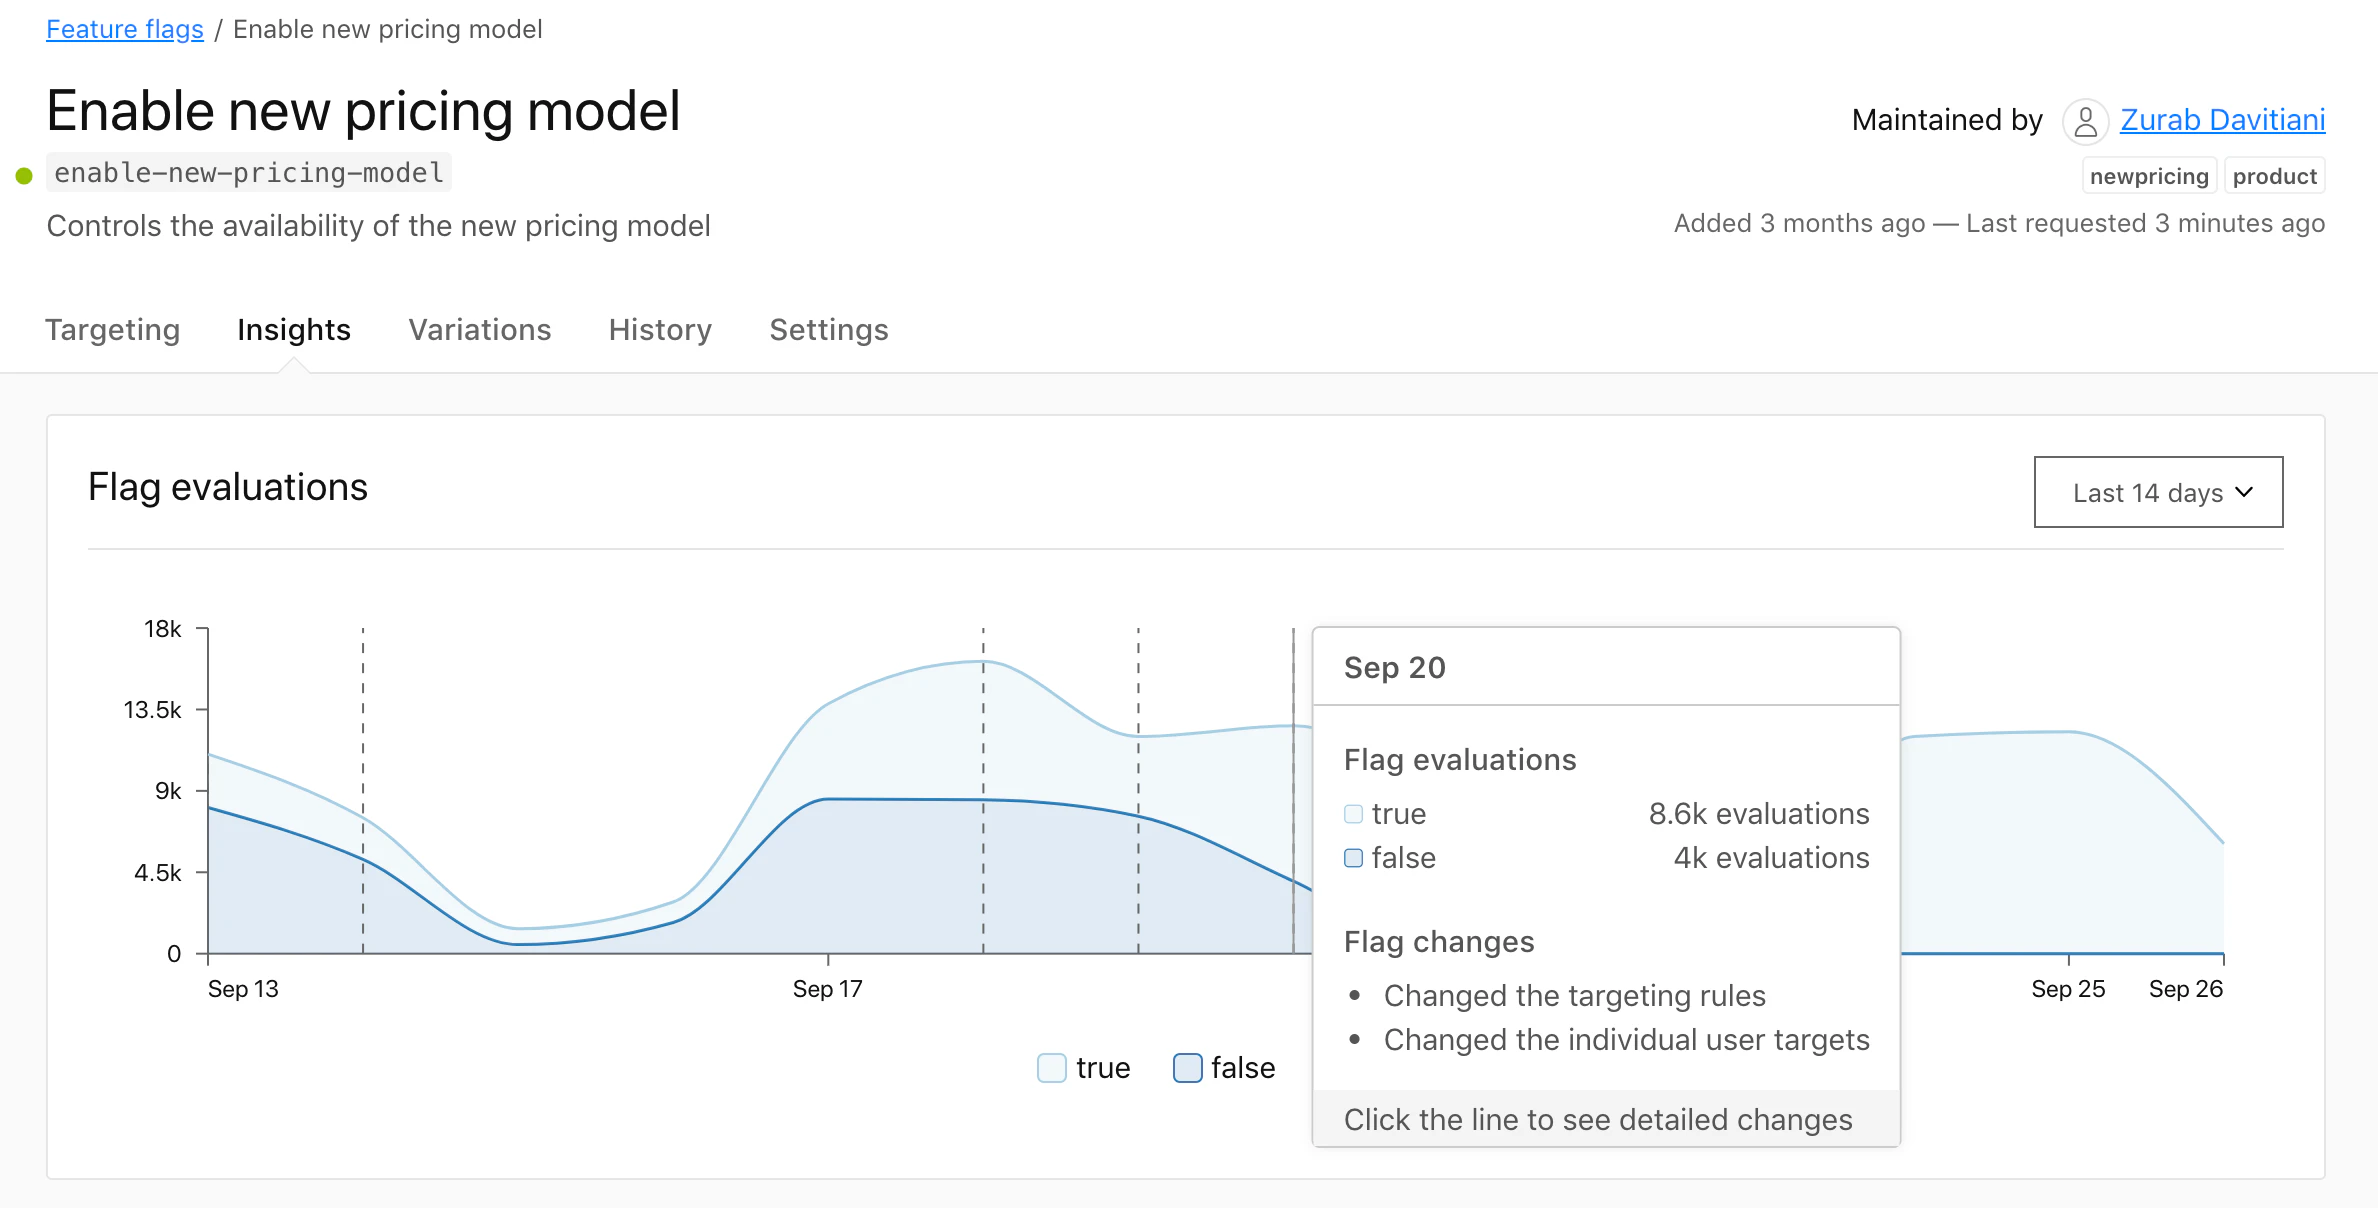
With the new Flag Insights graph, your engineering and product teams have much greater visibility into how many times people are seeing each version of a flag over time, as well as any changes to the flag that could have affected how many times each flag was evaluated. By looking at these Flag Insights graphs for your flags, you can see how changes to flag targeting rules, new variations, or an increased number of users affects how all of your end users are seeing your application. Each Flag Insights graph also has annotations powered by our enhanced audit log entries to tell you what has changed for your flag and when those changes were made, letting you connect the dots between changes and what your users see. These new Flag Insights graphs give you confidence that new rollouts have gone well, surface unexpected user behavior, or give you insight into opportunities for improvement.
If you notice something surprising or working incorrectly, you can quickly adjust targeting rules or activate a kill switch if necessary to protect your infrastructure or make sure that users aren't having a bad experience.
These graphs take advantage of LaunchDarkly's new summary events capabilities to quickly provide aggregated data. This summary events infrastructure allows us to provide this information to you without overly taxing your clients and servers to send events back to LaunchDarkly for evaluation. This information is provided on a per-evaluation basis, so that you can see evaluations even if the same user goes through the same code path multiple times.
With the Flag Insights data in hand, you'll have much more confidence in your application's performance and user experience. These Flag Insight charts are now available for all customers under the Insights tab for each of your flags.