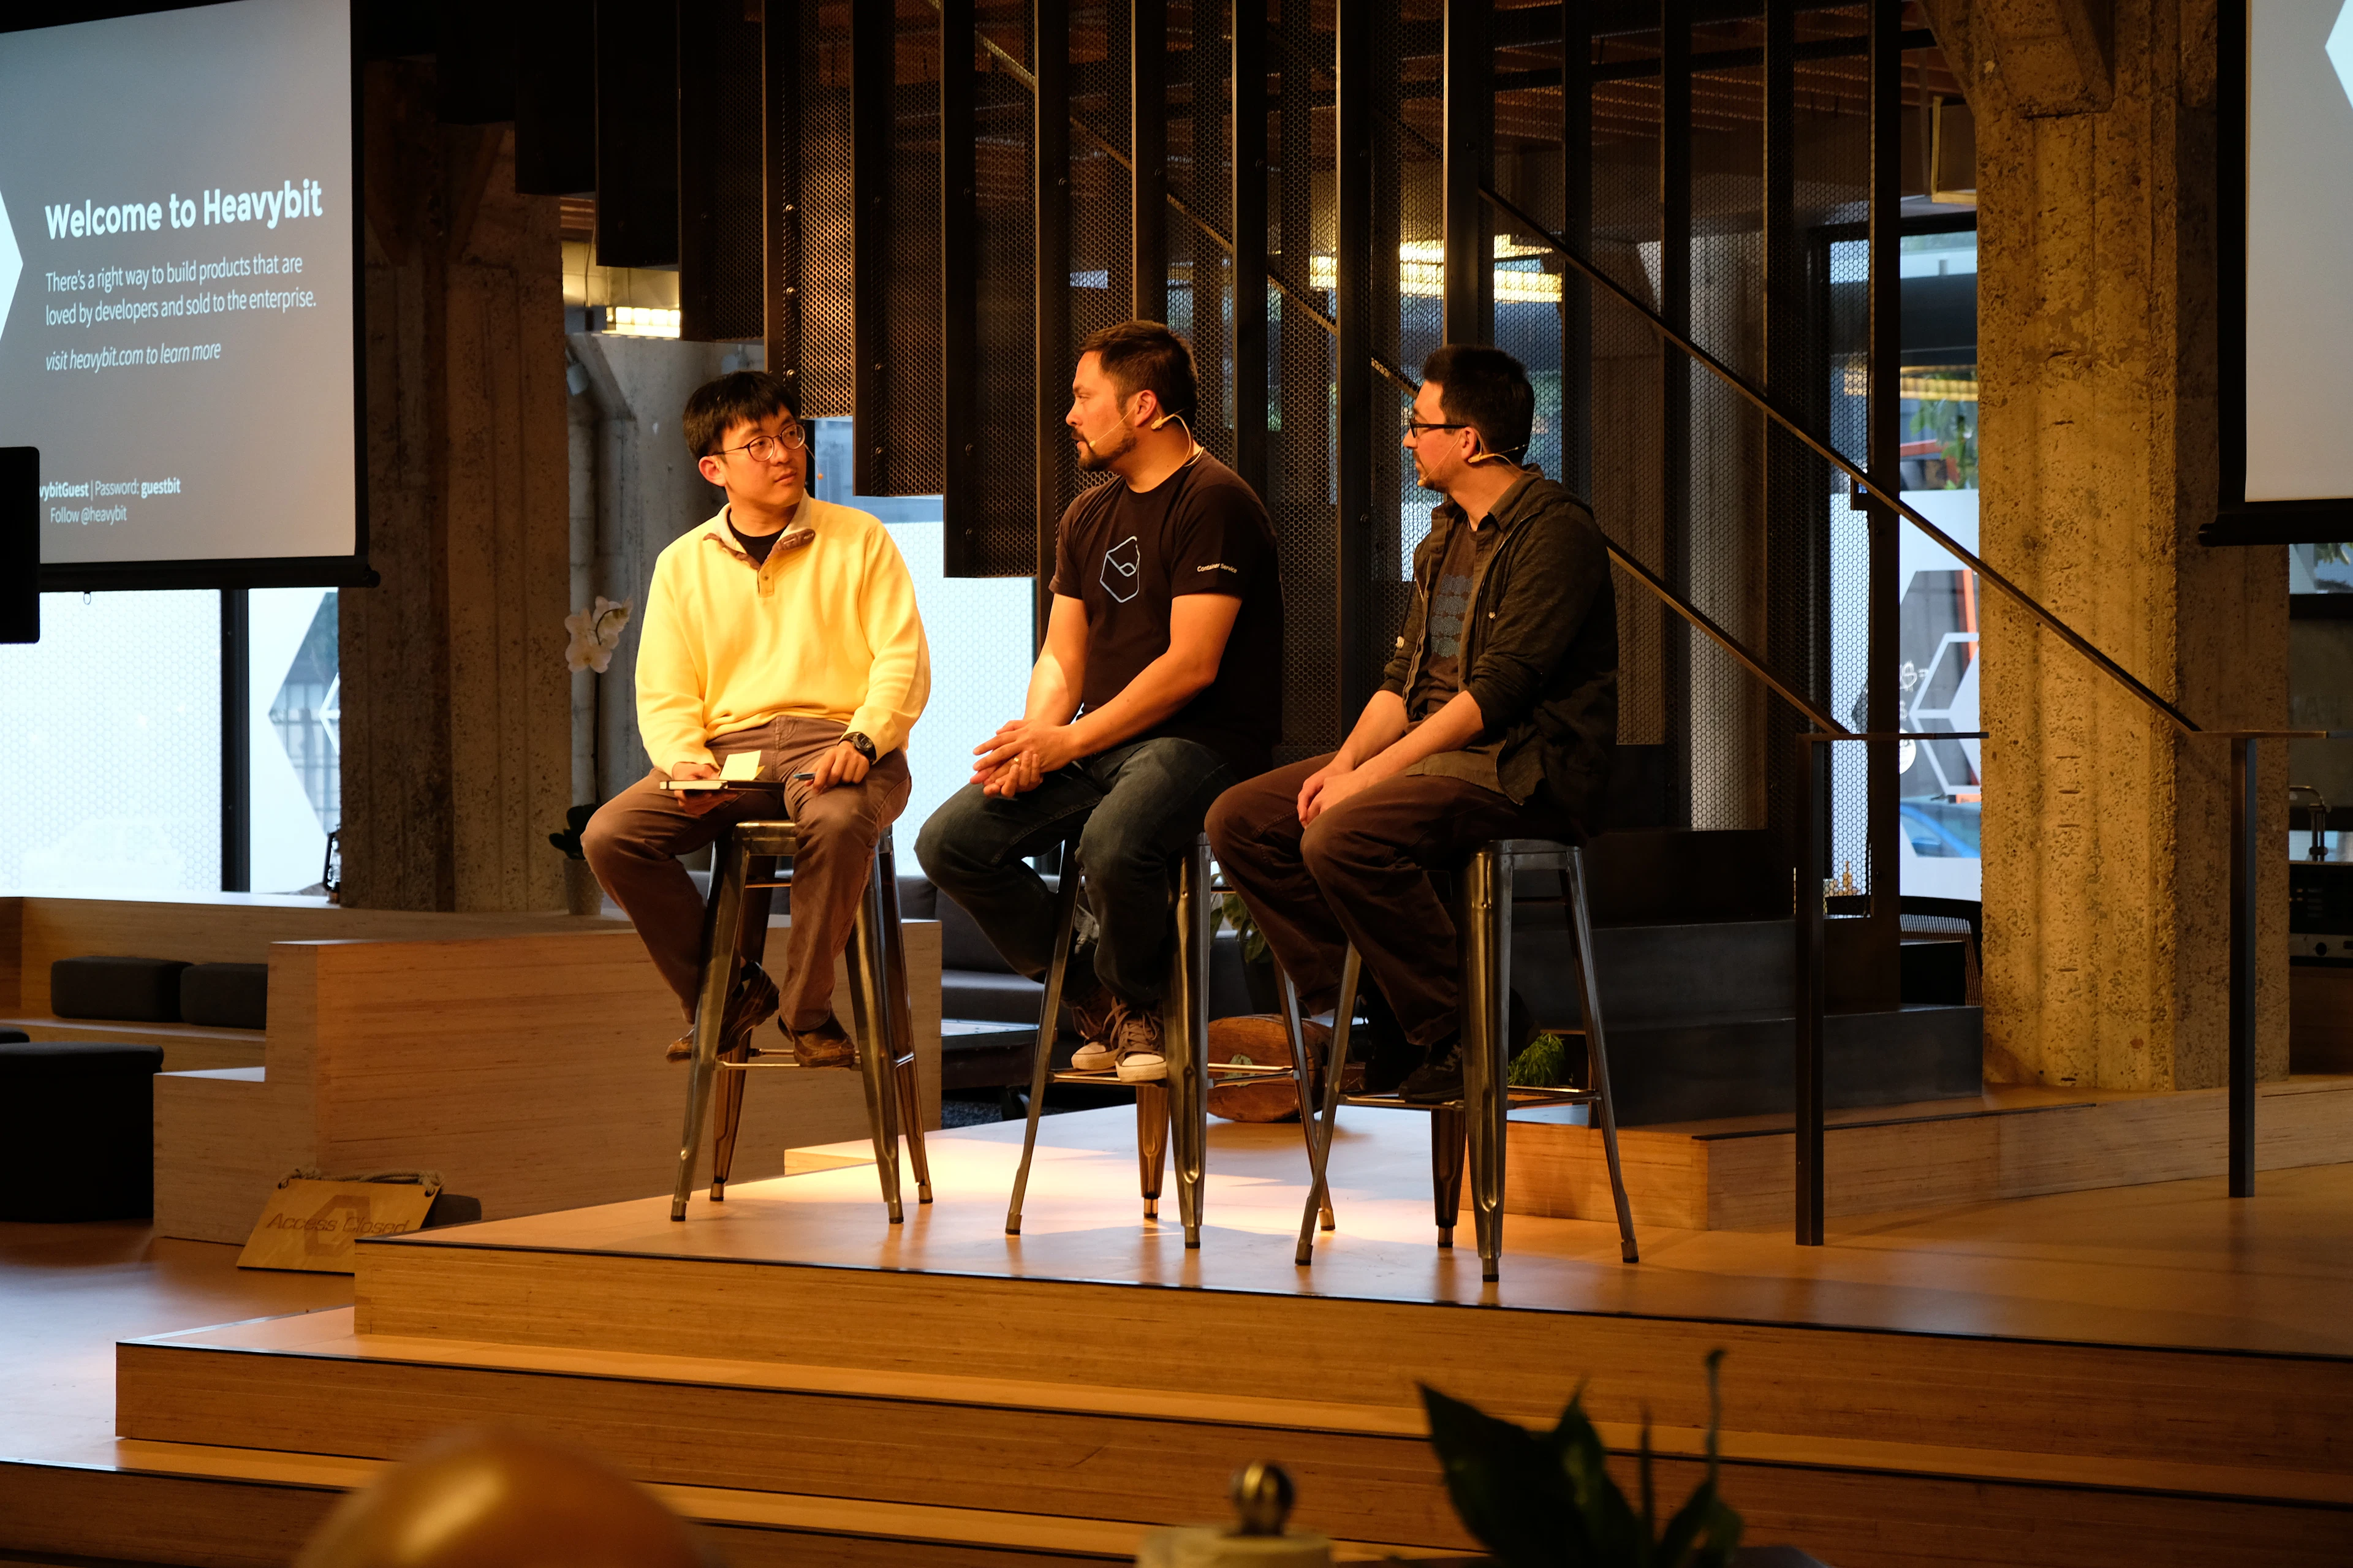
The final session from our April Test in Production Meetup featured a panel discussion led by Albert Wang, Senior Software Engineer at Uber. He spoke with the featured speakers, Michael McKay, IBM, and Andrew Seigner, Software Engineer at Bouyant.
“The Watson team, that’s the latest trademark that everyone’s hearing from IBM, they have a huge deployment, a huge set of Kubernetes clusters, and they had the exact same problem we had. It’s that they’ve got hundreds and hundreds of deployments, and how did they manage those? And so we feel we have a pretty good solution.” – Michael McKay, IBM
Watch the discussion below to hear more details about how Michael and his team are deploying using Kubernetes and feature flags at scale, and how Andrew and his team are debugging Kubernetes clusters in production. If you’re interested in joining us at a future Meetup, you can sign up here.
TRANSCRIPT
Albert: All right, everyone. Let's get started with a Q and A. I want to thank you guys ... What?
Albert: I want to thank both of you guys for a pretty deep technical, but still accessible presentations. I will open it up to the audience, but my first question is actually for Michael, which is: what's really interesting is to see that you guys are using feature flags for sending your deployments. It's an interesting application, and I was wondering, since feature flags are oftentimes used in the services I assume that you're deploying, what kind of relationship that you might have between the deployment feature flags and perhaps more business logic feature flags that are used within those services?
Michael: All right. So what's actually interesting is that, we started using feature flags specifically for deployments before we actually started using feature flags for what typically people use feature flags for. Right now, there is no connection. A deployment's a deployment, and then a new feature going into code with a feature flag are completely independent of each other. In fact, the cool thing about LaunchDarkly, it actually allows us to keep that separate.
Michael: So we have a separate project just for deployments and has its own SDK key for the clients. We have a separate one just for our user feature flags. So as of right now, we don't do that and our typical model is that our deployments ... We actually never introduce new features with a deployment and because of that, by definition, we have that disconnect, which just by processes themselves, that we really don't relate deployments with new features, if that makes sense. It's interesting.
Albert: Yeah. So what will the process be as, perhaps a developer of one of these services? I have some new code. I have ... It's, I assume, gated by a feature flag, so I would deploy by setting the deployment status feature flag, and then I would go and change my actual logical feature flag within my service?
Michael: Yep. Actually, we had a really good example. We had this big IBM conference, and we wanted to release a new capability. One thing we never had before, which seems almost impossible to think about now, is there's no way just to jump to your Kubernetes dashboard from the IBM Cloud Container Service. So we actually put this new feature in, and when we first put it in, it was hidden. No one saw it. It was sitting behind the feature flags. So we did a deployment probably about two weeks before it was even exposed to anyone.
Michael: What the developers did is the developers wrote the code with the feature flag enabled in their code for the UI, and they had rolled out that code weeks previous to the conference. And then during the conference, we could then use the feature flags to opt people in. Actually, we were opting people by email domain at the time.
Michael: So that's kind of a case where the developer did the normal process, where they'd code it, and push their code out to the environment. Then when they're ready, they use the separate project in LaunchDarkly to actually enable that feature flag for that new feature.
Albert: Interesting. Pretty interesting process there. Hopefully ... It's sounds like it'll prevent quite a few outages.
Michael: It's a learning experience for us, to stop rolling out new features via deployments. So this has been really good for us.
Albert: Very nice. And my second question for Andrew is: so your debug process seems to be pretty efficient in being able to introspect, I guess, the logic of stateless services. And I was wondering how it would work with, say, a stateful service, or perhaps even a database.
Andrew: Sure. Let's say you have a service talking to a database, we can give you TCP information on that today, so you could see how many bytes are going through, what's the through put and all that. We don't have success rate on that kind of connection yet. We've actually gotten some GitHub issues requesting Reddis, for example. I think, as there's more interest in particular protocols, we will be making the russ proxy aware of those protocols, and then be able to provide that kind of information for those connections.
Albert: Okay, very nice. So it seems like you guys support of variety of different transport layers. I guess what I was getting more towards is you may have some edge cases that may depend on the state of the various values of ... perhaps in your database or within your services. And depending on that state, you may trigger, perhaps a few if statements or whatever, which may change behavior that your service has and perhaps cause an error that might be omitted.
Andrew: Yeah, so that's interesting. You mentioned changing behavior based on responses and things like that. We have an older service mesh that's much more rolled out in production called Linkerdy, which allows you to classify behavior of your application based on certain types of request. So if you decide that get requests re-triable, but post requests are not, something like that, all of that's configurable. One of the lessons we took from that technology was that it was so configurable that the answer to that was us building Condo, which requires very little config. I think at some point down the road, we're going to have to learn how to give users the ability to control that kind of behavior, depending on how they want their app to behave.
Albert: Very nice. So let's open this up to questions from the audience. Does anybody have any questions?
Michael: Basically because IBM, instead of one big company, is like a million smaller companies. For example, our organization for just IBM Cloud Container Services, our tribe is about 200 people. That covers prog management, management, developers, support, everything like that. So when we talk about this, it's really just corralling those 200 people, and even just a subset of developers around the process for doing that.
Michael: What's kind of cool at IBM is that being such a big company, we can actually do internal meetups, and you'll get to talk to people that are having the same experiences, but they know how to fix it. So we've been going on this dog and pony show, just at IBM, saying that we've got this really cool deployment process using Kubernetes and LaunchDarkly, and getting people on board to be using that as well.
Michael: In fact, the process that we're doing today with LaunchDarkly and Kubernetes, we're going to start exposing it to other teams in IBM. The Watson team, that's the latest trademark that everyone's hearing from IBM, they have a huge deployment, a huge set of Kubernetes clusters, and they had the exact same problem we had. It's that they've got hundreds and hundreds of deployments, and how did they manage those? And so we feel we have a pretty good solution. We're kind of internal evangelizing this and spreading the word in getting people to use it.
Michael: I mean, I've known about feature flagging for a while. In fact, my previous job before this one I'm working on right now, we had actually looked at LaunchDarkly and Optimizely. You do a Google search for feature flags, and it's Optimizely and LaunchDarkly are right at number one and number two, and I think they flip daily. There's some groups in IBM that are using Optimizely today, and we actually looked at Optimizely for this process instead of LaunchDarkly, but what we've found is that Optimizely is more suited for experimentation, canary testing, things like that. You can do feature flags, but it doesn't seem to be their core offering.
Michael: Then we started using LaunchDarkly, and what we really loved is just the simplicity of it, the power of it, and you guys have actually been really great for support, as well.
Michael: So what was interesting is that, when I came to this new job, we had this deployment process and the fact that I had used feature flags in my past job, that's where that mental leap of faith came into play where users, clusters, came into play.
Michael: Then we said, "Hey, we should use feature flags for deployments too". Having said that, we've been using feature flags for deployments, and we're now just starting to use feature flags for what they're typically intended for.
Michael: Trust me, we've thought about this. We looked at LaunchDarkly, and we were like, "We could probably do this. How hard could it be?"
Michael: And we've actually learned from our past mistakes. One of our mottoes is: if you don't have to run it yourself, don't run it yourself. IBM itself ... I mean, it's a 100-year-old company that's been going through some major transformations in the past few years. One of those is actually really starting to look at smaller companies. How do they work? What makes them successful? Part of that is actually starting to get outside of the company. Start picking up existing services because what you can find is that, using a feature flag service like LaunchDarkly ... Sure we could write it ourselves, but you'd end up spending probably a couple hours of magnitude more money just in resources, and compute, and stores. I mean, just all this stuff, and you probably would end up something that was not even nearly as good as what LaunchDarkly provides.
Michael: One thing we're learning is that, we don't want to try to be experts in everything. We don't want to be an expert in building our own feature flag service. We don't want to figure out how to run Mongo databases. We don't want to figure out how to do all this stuff, so we're passing everything off to people who actually are experts in these areas.
Michael: Actually, IBM is really good about this. Up until now, literally I've been putting this 00 a month bill on my Amex, and we're finally actually getting through ... Probably the biggest hurdle is just getting through the IBM procurement process to get a PO generated, so we can just start charging our LaunchDarkly bill and not have to submit an expense report every month for this thing. But it's been really good.
Albert: So I have another question for Andrew. You have an interesting way of essentially instrumenting services. It seems you're essentially wrapping these services with a proxy layer. In my own work, I've also seen a lot of people moving towards sensory distributor tracing, using context provocation. I was wondering how your work compares.
Andrew: Yeah, for sure. We've worked a lot with systems that leverage distributed tracing. That previous service mesh I mentioned that's still out there in production, that has first class support for distributed tracing. What we found with conduit being ... One of the design goals of being zero config, to do distributed tracing well, you kind of have to instrument your app. You have to probably make some changes to your application code.
Andrew: Our thinking is that there are certain cases where distributed tracing is the only tool that'll work. If you have one very slow, long request, and you want to understand everything it's going through, and follow it, and pinpoint what's the slow piece, distributed tracing will give you that.
Andrew: Our thinking is that for 90% of use cases, as far as why is it slow, why is it broken? Providing these tools that just let you look at each hop and understand what are the success rates and latencies between your services, we think we get you most of the way there.
Andrew: There's definitely been requests to add a distributed tracing support into the new service mesh. We're thinking about it.
Albert: Very nice. Yeah. Distributed tracing is certainly gives you a lot more. Some certain benefits, but is a lot more work to implement. Whereas your proxy, seems to be very ... As you say, zero config, so a lot easier to implement.
Andrew: Yeah. That was definitely a lesson learned from Linkerdy. We have lots of people using that, and they start using it, and the next question is: how do I make distributed tracing work?
Andrew: It's like well, your app needs to pass headers around, which is fine for some folks. For others, they want something that just works out of the box, without changing anything. So it's a bit of a trade-off.
Michael: Actually I've got a question for Andrew.
Andrew: Yes, sir?
Michael: We've got a lot of customers coming from the financial industries, and they love encryption. What they're finding is they don't like the idea that once you get past the ingress, that nothing's encrypted anymore. So how would you deal with something like, if the ... themselves are actually exposing HTTPS end points.
Andrew: Yeah. We're doing a release tomorrow, and we're doing another release in about a month. And that release will include TLS between every connection in your cluster. The idea is that we will run a certificate authority for you. Again, you don't do anything, and it will encrypt every connection between all of your services, even if they're just doing HTP-1 or whatever, we'll just enable that for you if you want.
Michael: Are you selling that as a separate offering there?
Andrew: Nope. It'll all be part of the open-source thing.
Michael: That's pretty cool.
Andrew: Our road map is on that website, and all the codes there, and all the issues are there. So have a look. It's coming soon. The work we're going to do in the next release, it's already in the design phase, and it's in GitHub issues as is. So it's there to check out.
Michael: Cool.
Andrew: So if you have input and opinions, definitely bring it in.
Albert: So I have another question for Michael, which is: how does the observability or visibility story of work with IBM cloud? I guess, again, as a scenario, I'm a developer. I deploy, how do I say, make sure that deploy is safe, that there aren't any exceptions or errors? And if there are, then is there a way for me to automatically detect it or perhaps even take action?
Michael: Yep. So we have a variety of means for that. The first step of visibility is what we showed you with the razadash where we can just see, this thing actually got deployed. Now, if there's an error during deployment, the cluster updater basically is saying, "Hey, LaunchDarkly, which version do I need to run for this particular microservice?"
Michael: Then it'll just apply that to Kubernetes. Now if Kubernetes comes back and barfs, and says, "You got mail from YAML," or, "Can't connect to the API server," or whatever the issue may be, we will actually trickle it back up to the razadash service. It all shows up in the same view, where their deployments go.
Michael: Now once it actually gets running into the environment, we do run a set of tests. For example, our stage environment, and even our production environment. So we do have some indent tests that we run, and those test results also percolate back up to razadash. So part of our visualization story is: let's just push everything to this one place. From our point of view, the date is cheap. That razadash database, it's a Mongo database, and it's one gigabyte, so it's a drop in the bucket, considering how much value we get out of it.
Michael: Now in terms of additional logs like the standard out, standard error, or the other log files for the pods themselves, the Cloud Container Service handles that for you. So all the logs are actually are forwarded to our log-man service. You can go to Kibana dashboard, and you can see all the logs from all your applications across all the clusters in one spot.
Albert: Sure.
Michael: It's a lot of data but you can see that.
Andrew: The origin story of our company is we were a bunch of infrastructure engineers from Twitter. We all joined when the site was down constantly, and we were involved in migrating it from the largest rails app on the planet to a bunch of microservices. And in doing that, we found that things like retries, and back off, and telemetry, and routing policy needed to be centralized. We had a lot of teams that, all of a sudden, started building that same thing.
Andrew: That eventually coalesced into a library called Finagle. It's a library written in Scala. That's what our first service mesh was built around. Linkerdy wrapped Finagle. And then Conduit was a lot of lessons learned from that. We found the application developers, you've get a lot of teams, and they may be writing in different languages, using different types of interfaces to talk to each other. The service mesh really gives a uniform way for all of your services to communicate. That said, it's another piece in your infrastructure. Right?
Andrew: We're super-sensitive to that, and that is a lot why we're emphasizing zero config so much in this new one. The adoption we've had with Linkerdy has been great, but one of the comments is definitely it's a lot of work to set up. It's a lot of config that you have to learn to get it to work the way you want it.
Michael: I had another question for you too. So have you guys ever thought of just ... as helm charts?
Andrew: Yes. So that's an open GitHub issue, as well, right now.
Michael: All right.
Andrew: So we've had requests to have it automatically integrate it with Helm. That's probably coming. It may be in the works already.
Michael: I did want to mention one more thing about just your previous question. So we actually modeled our visibility part, and when to deploy, off of GitHub. What's interesting with GitHub, is that not only do they roll out code to a small portion of users, they will check logs. They'll run tests, but what's most interesting, they actually will check their Twitter feed to see if they have issues. So that's part of their feedback to know when their deployment is done, is they haven't had any people tweeting about GitHub being down.
Albert: The good old Twitter-based debugging.
Andrew: We use that ourselves, for sure.
Albert: Thank you.
Andrew: Thanks.