View AI Config trends explorer
Overview
This topic explains how to use AI Config trends explorer to view aggregated performance data across multiple AI Configs, providers, and models. Use trends explorer to compare performance, identify trends, and correlate version changes with key metrics in a single view.
Trends explorer applies to AI Configs in both completion mode and agent mode and aggregates metrics across all configurations.
For detailed performance metrics for a single AI Config in a specific environment, use the Monitoring tab.
Trends explorer provides time series charts and version annotations to help you understand which configurations perform best. Use it regularly to establish consistent, organization-wide practices for evaluating AI model performance.
Access trends explorer from the AI Configs view of your project. To populate it with data, instrument your application as described in Tracking AI metrics.
Use trends explorer to:
- Compare performance across multiple AI Configs, providers, and models
- Track trends in token usage, latency, satisfaction, and error rates over time
- Correlate version changes with shifts in key performance metrics
- View aggregate statistics that summarize AI Config activity across all your AI Configs
View trends explorer across AI Configs
To open trends explorer:
-
Navigate to your project.
-
In the left navigation, expand AI, then select AI Configs.
-
In the upper right corner of the AI Configs view, click Trends.
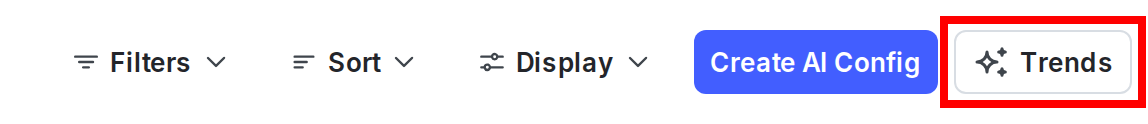
The "Trends" button on the AI Configs page.
On first load, trends explorer shows default metrics for up to ten keys in the selected dimension. You can adjust the dimension, keys, metric, and date range to refine the data.
Filter and group trends explorer data
Use the controls at the top of the Trends explorer panel to choose what data to view:
- Date range sets the time period for the data.
- Bar or Line toggles how trends explorer displays the data.
- Group by groups data by AI Config, model, or provider.
Use these controls to focus on the configurations and metrics most relevant to your analysis.
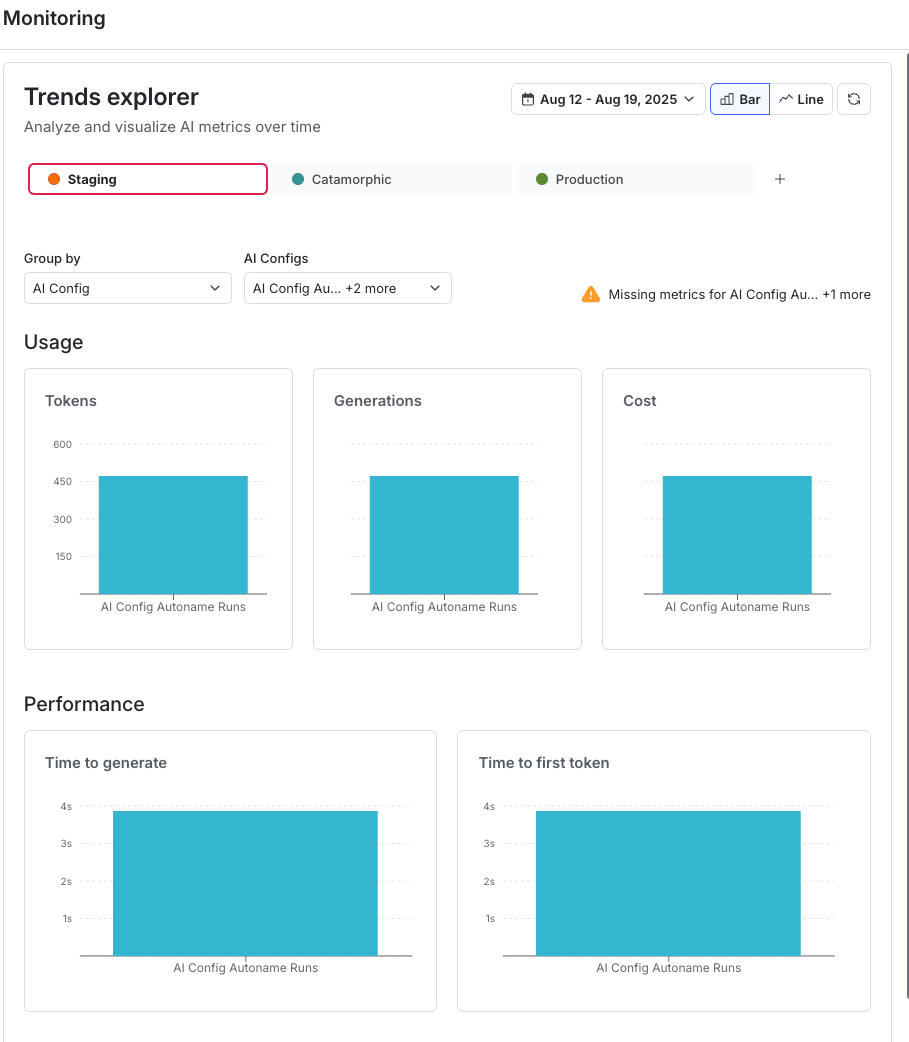
Interpret trends explorer data
The Time series chart displays trends in the selected metric over the chosen time range and dimension. Version change annotations show how updates align with performance changes.
Use the chart to:
- Identify top-performing configurations
- Detect regressions or anomalies
- Monitor how recent changes affect performance
Choose the right view
Use this table to choose the view that best supports your analysis.