Flag evaluations
This topic explains how to use flag evaluations graphs to observe flag evaluations over time. Flag evaluations graphs give your engineering and product teams insight into how many times different contexts are receiving each variation of a flag over time, as well as any changes to the flag that could have affected how many times each flag was evaluated.
About flag evaluations
The flag evaluations graph on a flag’s Targeting tab gives your engineering and product teams insight into how many times different contexts are receiving each version of a flag over time, as well as any changes to the flag that could have affected how many times each flag was evaluated.
To view a flag’s evaluations graph:
- Navigate to the Flags list.
- Click the name of the flag you want to view evaluations over time for. The flag’s Targeting tab appears.
- Click Evaluations to expand the section.
The flag evaluations graph displays flag evaluations over time. Hover over a specific date to view the number of flag evaluations and any changes you made to the flag on that date:
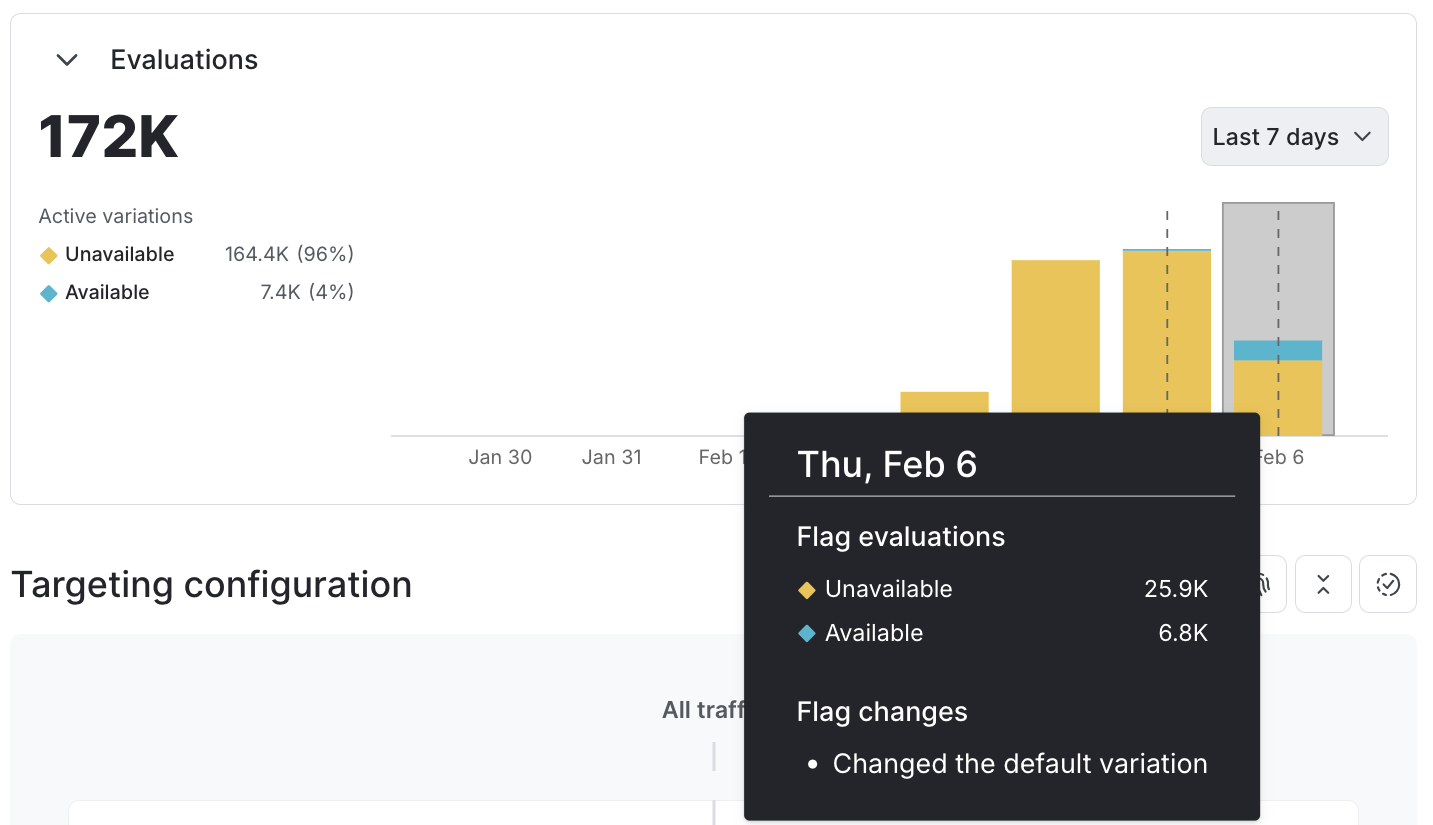
The default date range is the last seven days. To change the date range, click Last 7 days and select a new date range.
Only flag evaluations are recorded
LaunchDarkly generates the flag evaluations graph based on analytics events, which are sent from variation calls from the LaunchDarkly SDKs. To learn more, read Flag variation evaluation.
Other SDK methods, such as getting all flags, typically do not populate the flag evaluations graph. To learn more and review the exceptions to this, read About the all flags feature.
Evaluation display
LaunchDarkly generates the flag evaluations graph on a per-flag evaluation basis, not a per-context instance basis. This means that if the same context instance is evaluated 20 times, the flag evaluations graph records and displays all 20 evaluations. New evaluations appear on the flag evaluations graph within one to two minutes.
If a flag you have removed from your codebase is still showing evaluations, read these related LaunchDarkly help center articles:
- Flag removed from code is still showing evaluations
- Troubleshooting unexpected variations on the evaluations graph
Enhanced flag evaluations charts
The enhanced flag evaluations chart on a flag’s Monitoring tab gives you deeper insights to how different variations are performing over time.
To view a flag’s enhanced evaluations chart:
- In the left sidebar, click Code. The CodeControl menu appears.
- Click Flags.
- Click the name of the flag you want to view evaluations over time for. The flag’s Targeting tab appears.
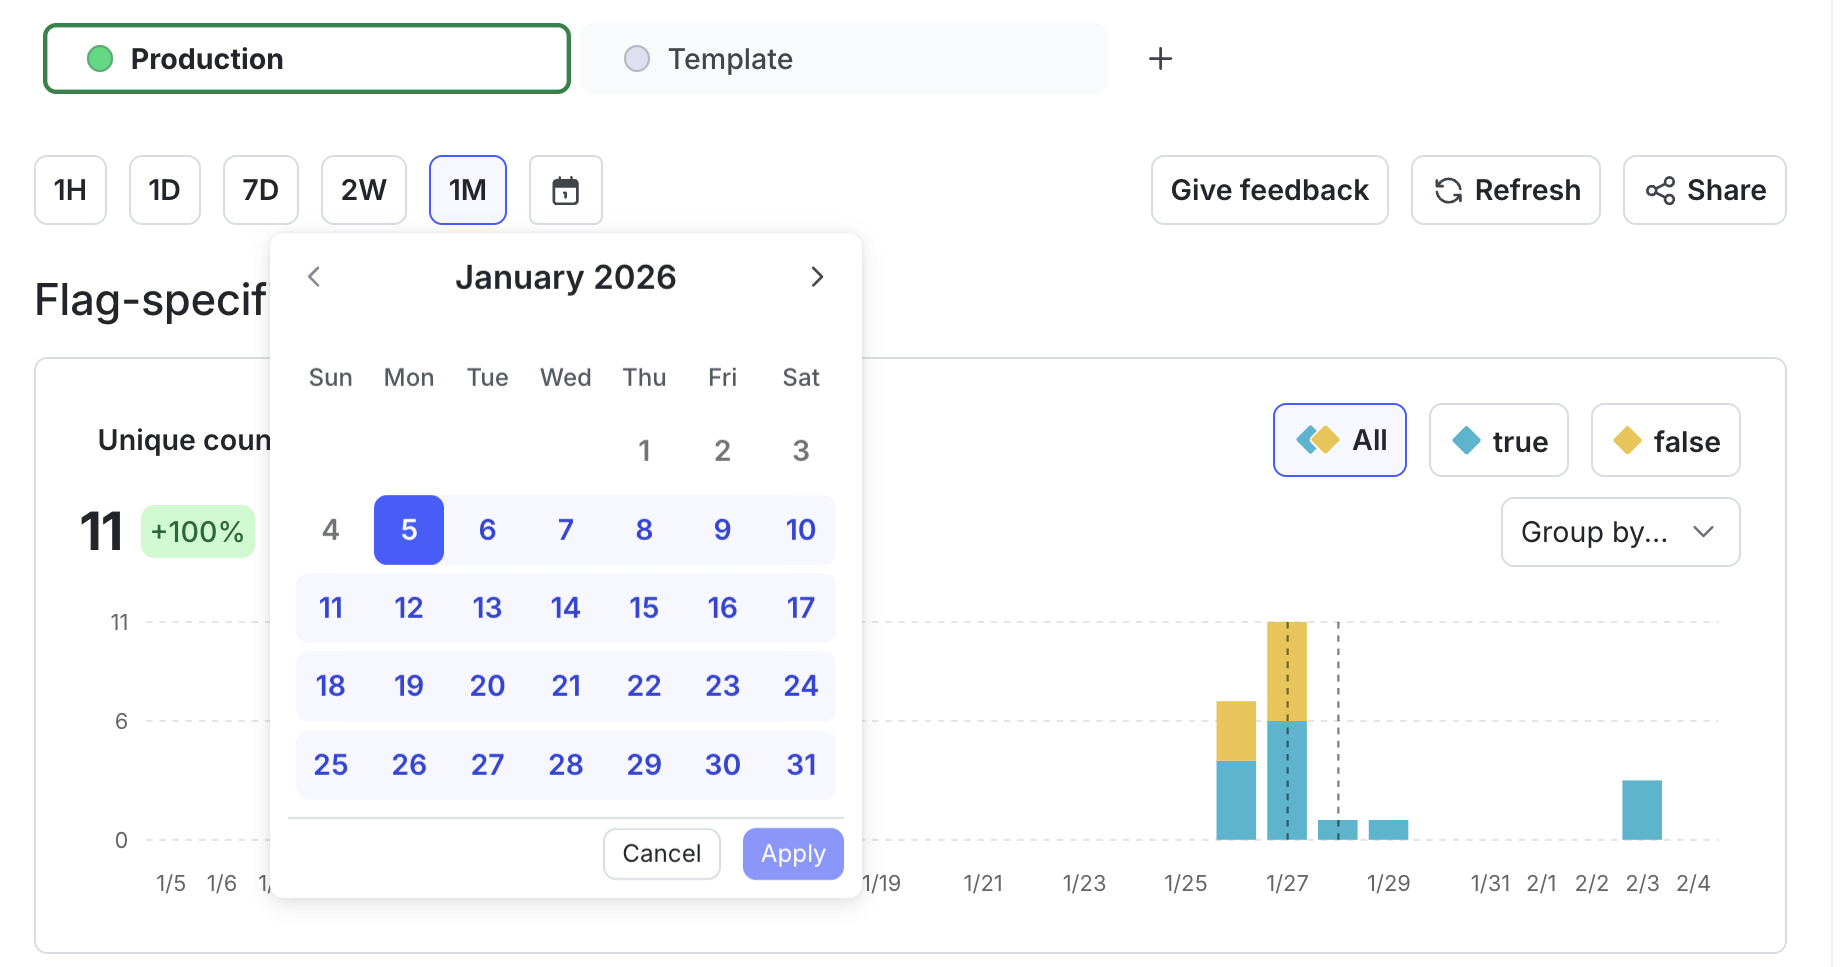
- Click the Monitoring tab. The flag evaluations charts appear in the “Flag-specific” section.
The default evaluations chart displays the total number of flag evaluations for each flag variation over time. You can change the time range from the previous hour to the previous month:
Click on a variation name above the chart to view a single variation at time.
To share a direct link to the chart, click the three-dot overflow menu and select “Copy link.” To save a .png version of a chart, select “Save as PNG.”
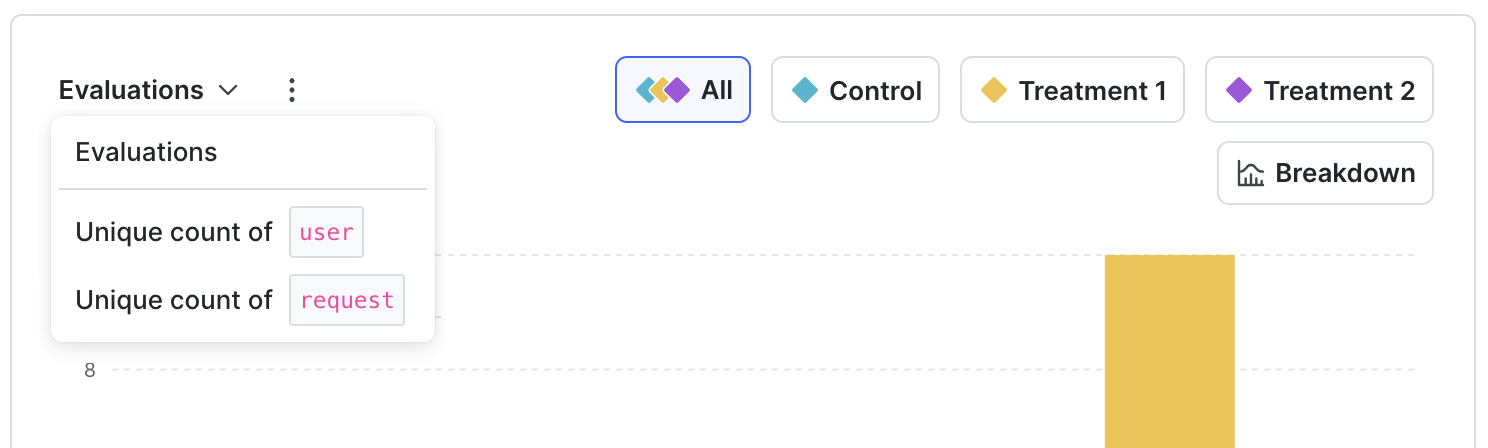
View unique client-side context evaluations
You can view flag evaluations by the number of unique client-side contexts, by context kind, that encountered the flag within your chosen time range. For example, if you are viewing user contexts, each individual user is counted only once, even if it encounters the flag multiple times.
To view flag evaluation by unique client-side contexts per context kind:
- In the evaluations chart, click Evaluations. The context kind selection menu opens.
- Select the context kind you want to view.
The chart updates to display the number of unique client-side contexts of that context kind that encountered the flag.
If you don’t see the context kind that you expect, it may be because:
- no contexts of that context kind have ever encountered the flag
- no contexts of that context kind have encountered the flag within your selected time range
- the only contexts of that context kind that have encountered the flag are from server-side SDKs
- you’re using an older version of a client-side SDK that doesn’t support displaying unique evaluations
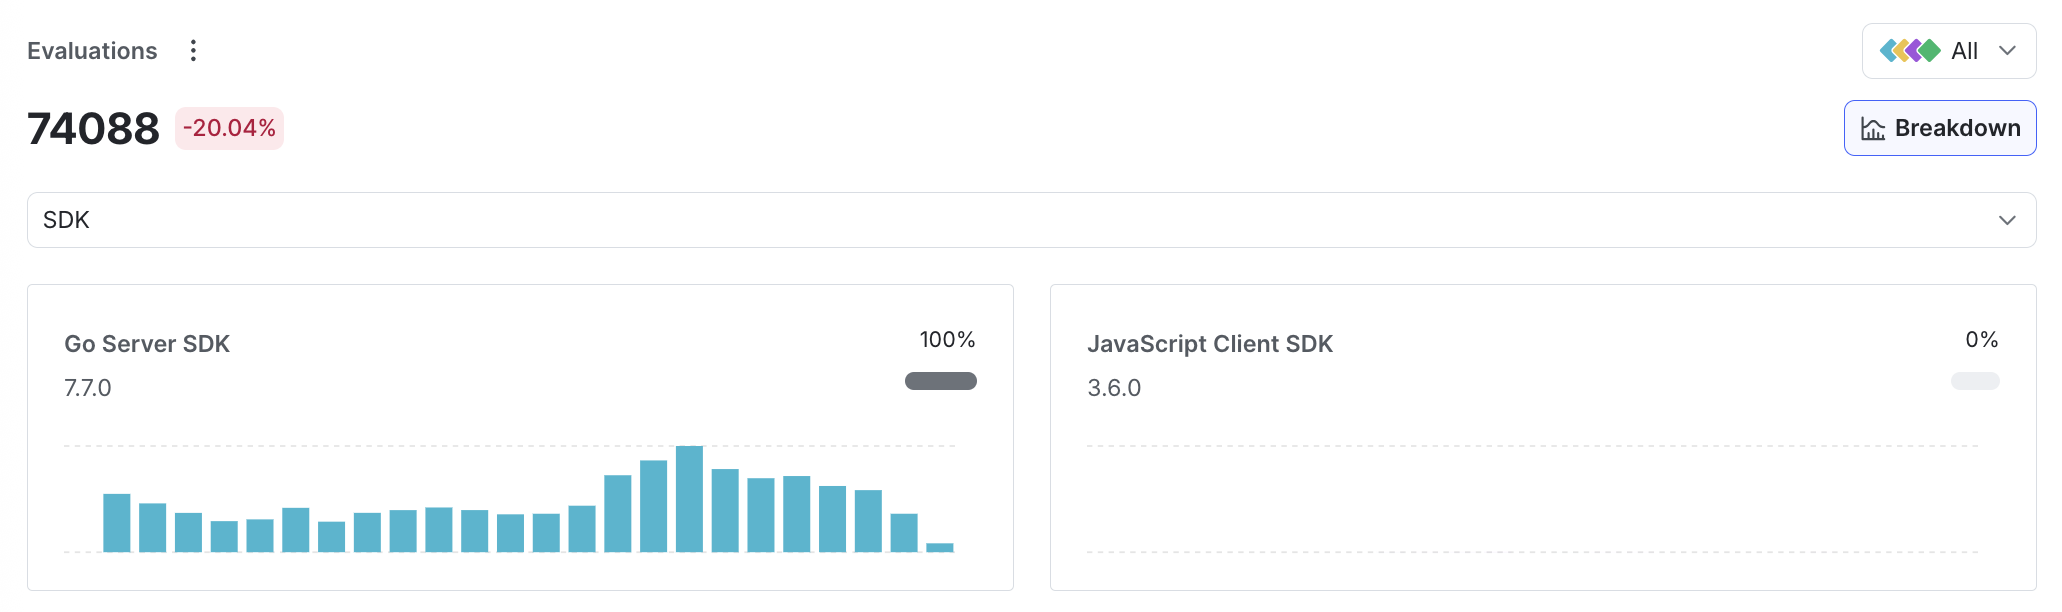
View evaluations by application or SDK
Depending on your SDK and its configuration, you can view flag evaluations by specific applications or specific SDKs. To do this:
- In the evaluations chart, click Breakdown.
- Select Application or SDK.
Individual charts appear for each application or SDK that is sending flag evaluations to LaunchDarkly. Each chart lists the percentage of overall evaluations coming from that specific app or SDK.
To learn how to configure your SDK to send application metadata to LaunchDarkly, read Automatic environment attributes and application metadata configuration.