

Guarded rollouts are available to customers on select plansGuarded rollouts are available to customers on an Enterprise plan with the Guardian add-on. To learn more, read about our pricing or contact Sales.All LaunchDarkly accounts include a limited trial of guarded rollouts. Use this to evaluate the feature in real-world releases.
Monitor a guarded rollout
You can monitor a guarded rollout on a flag’s Monitoring tab. The Monitoring tab shows the rollout progression, the sample size for the new variation, and how each metric is performing.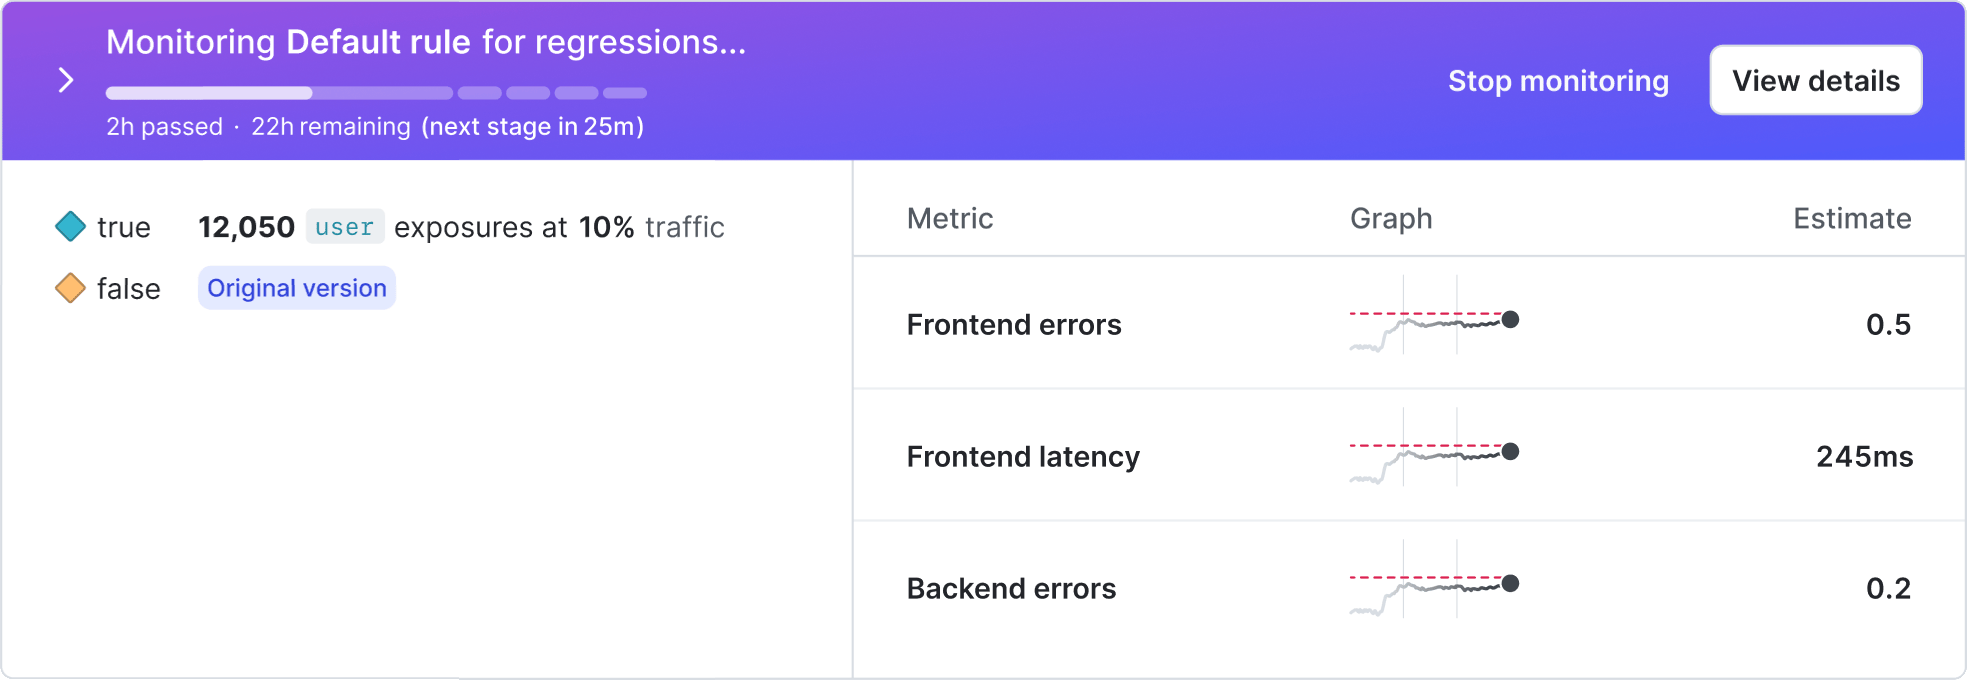
Monitoring a guarded rollout with analysis pending.
- Hover over a graph to view details about the selected metric
- Use the date range picker to view results over a selected period of time
- Manually roll back the release
- Dismiss a regression alert and continue with the rollout
- Stop monitoring the rollout early
- Use the metric selector to switch between metrics
Monitoring charts
In a guarded rollout, each metric appears in its own tile. Each tile contains a difference chart. Each metric tile includes:- Header: Identifies the metric and shows the current difference estimate. Hover over the metric name to view its definition, description, environment, and last-seen timestamp.
- Chart: Shows the absolute difference between the new and original variations over time. The dark gray line represents the observed difference. The shaded gray area represents the confidence interval. If sequential testing determines that the observed absolute difference represents a statistically significant negative impact on a monitored metric, LaunchDarkly identifies a regression. When this occurs, the tile highlights the regression, and if you enable automatic rollback, LaunchDarkly rolls back the release.
- Footer: Summarizes the most recent results and displays the latest values for both the new and original variations.
Difference charts availabilityDifference charts are available only for guarded rollouts. Progressive rollouts and experiments use other visualization methods.
Why metric results might differ across rollouts
Why metric results might differ across rollouts
In January 2026, LaunchDarkly began using sequential testing to evaluate mean and percentile metrics in guarded rollouts.If all data points in a rollout were collected after this change, including for newly created guarded rollouts, LaunchDarkly displays results using this frequentist sequential testing approach.If any data points in the rollout were collected before this change, LaunchDarkly displays results using the original Bayesian method. In that legacy method, results were based on estimating whether the new variation performed worse than the original variation using a probability-based model.As a result, metric behavior and hover details may differ across rollouts depending on when the underlying data was recorded.
Interval of evaluation
During a guarded rollout, LaunchDarkly recalculates metric results on a regular schedule called the interval of evaluation. At each interval, LaunchDarkly processes recent metric events, recalculates the absolute difference between the new and original variations, and evaluates whether the result is statistically significant using sequential testing. These evaluations occur approximately every 10 seconds. If metric events arrive more frequently, LaunchDarkly aggregates them into the next interval. These regular updates ensure that the monitoring charts reflect the most recent metric data throughout the rollout.Monitoring window
Each guarded rollout has a monitoring window that spans the full rollout duration. LaunchDarkly uses all metric data collected within that window to evaluate performance. If performance degrades late in the rollout, LaunchDarkly weighs that new data against earlier data. Larger degradations are detected more quickly, while smaller changes may require additional data before statistical significance is reached. To improve responsiveness, use shorter stage durations or metrics that emit data more frequently.New variation estimates
New variation estimates are point estimates of the metric value for the new variation. A point estimate uses sample data to calculate a single value that approximates the metric’s true value. For metrics that use a percentile analysis method, such as latency at the 99th percentile, the estimate of new variation cell shows the estimated percentile value based on the sample size for the new variation. For metrics that use the average analysis method, the estimate of new variation cell shows the average metric value for contexts served the new variation.Difference from original variation
The difference from the original variation measures how much the metric value for the new variation differs from the original variation. LaunchDarkly calculates this value as the absolute difference between the two variations using the metric’s unit:Roll back releases
To manually roll back a release after LaunchDarkly has detected a regression:- Navigate to the flag’s Targeting or Monitoring tab.
- Click Roll back. The “Stop rollout early” dialog appears.
- Choose which Variation to serve to all contexts after you stop monitoring. The field defaults to the original variation.
- Click Stop.
Automatic rollback behavior
LaunchDarkly automatically rolls back a guarded rollout in these scenarios:- If LaunchDarkly detects a regression at any time during the rollout and you have automatic rollback enabled.
- If LaunchDarkly detects a sample ratio mismatch (SRM) any time during the rollout. LaunchDarkly rolls back a release with an SRM whether or not you have automatic rollback enabled. To learn how to fix SRMs, read Sample ratio mismatch.
- If the sample size for the new variation is too small by the end of the rollout, LaunchDarkly cannot detect a regression and rolls back the release, even if automatic rollback is off. To improve results, try the rollout again with a longer duration.
- A Slack, Microsoft Teams, or PagerDuty notification, if configured.
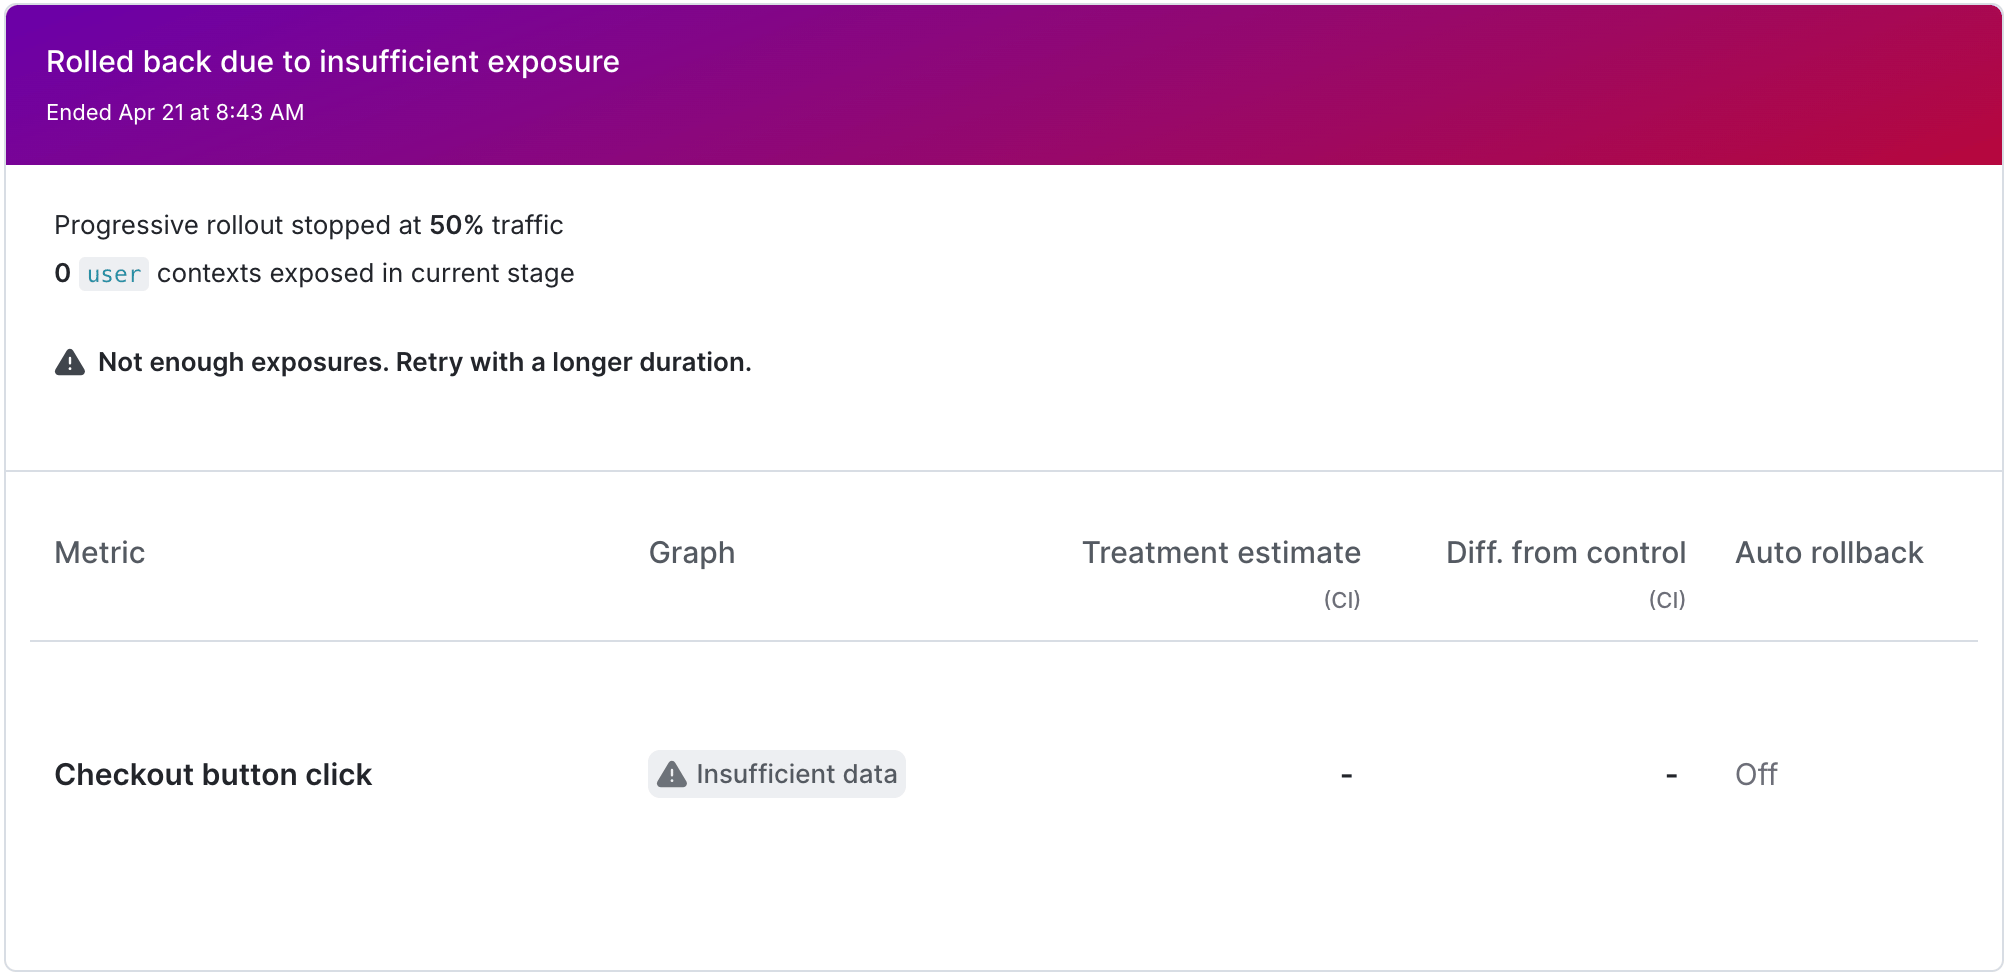
A guarded rollout with insufficient contexts served.
Dismiss regression alerts
If LaunchDarkly detects a regression on a metric but you want to continue with the release, you can dismiss the regression alert for that metric. You can have multiple regressions on the same rollout if you have more than one metric attached to the rollout. To dismiss an alert:- Navigate to the flag’s Targeting or Monitoring tab.
- Next to the metric with the alert you want to dismiss, click Dismiss. The “Dismiss regression” dialog appears.
- Click Dismiss regression.
Stop monitoring early
To stop monitoring before the monitoring window is over:- Navigate to the flag’s Targeting or Monitoring tab.
- Click Stop monitoring. The “Stop monitoring” dialog appears.
- Choose which Variation to serve to all contexts after you stop monitoring. The field defaults to the original variation.
- Click Stop.

You can also use the REST API: Update feature flag