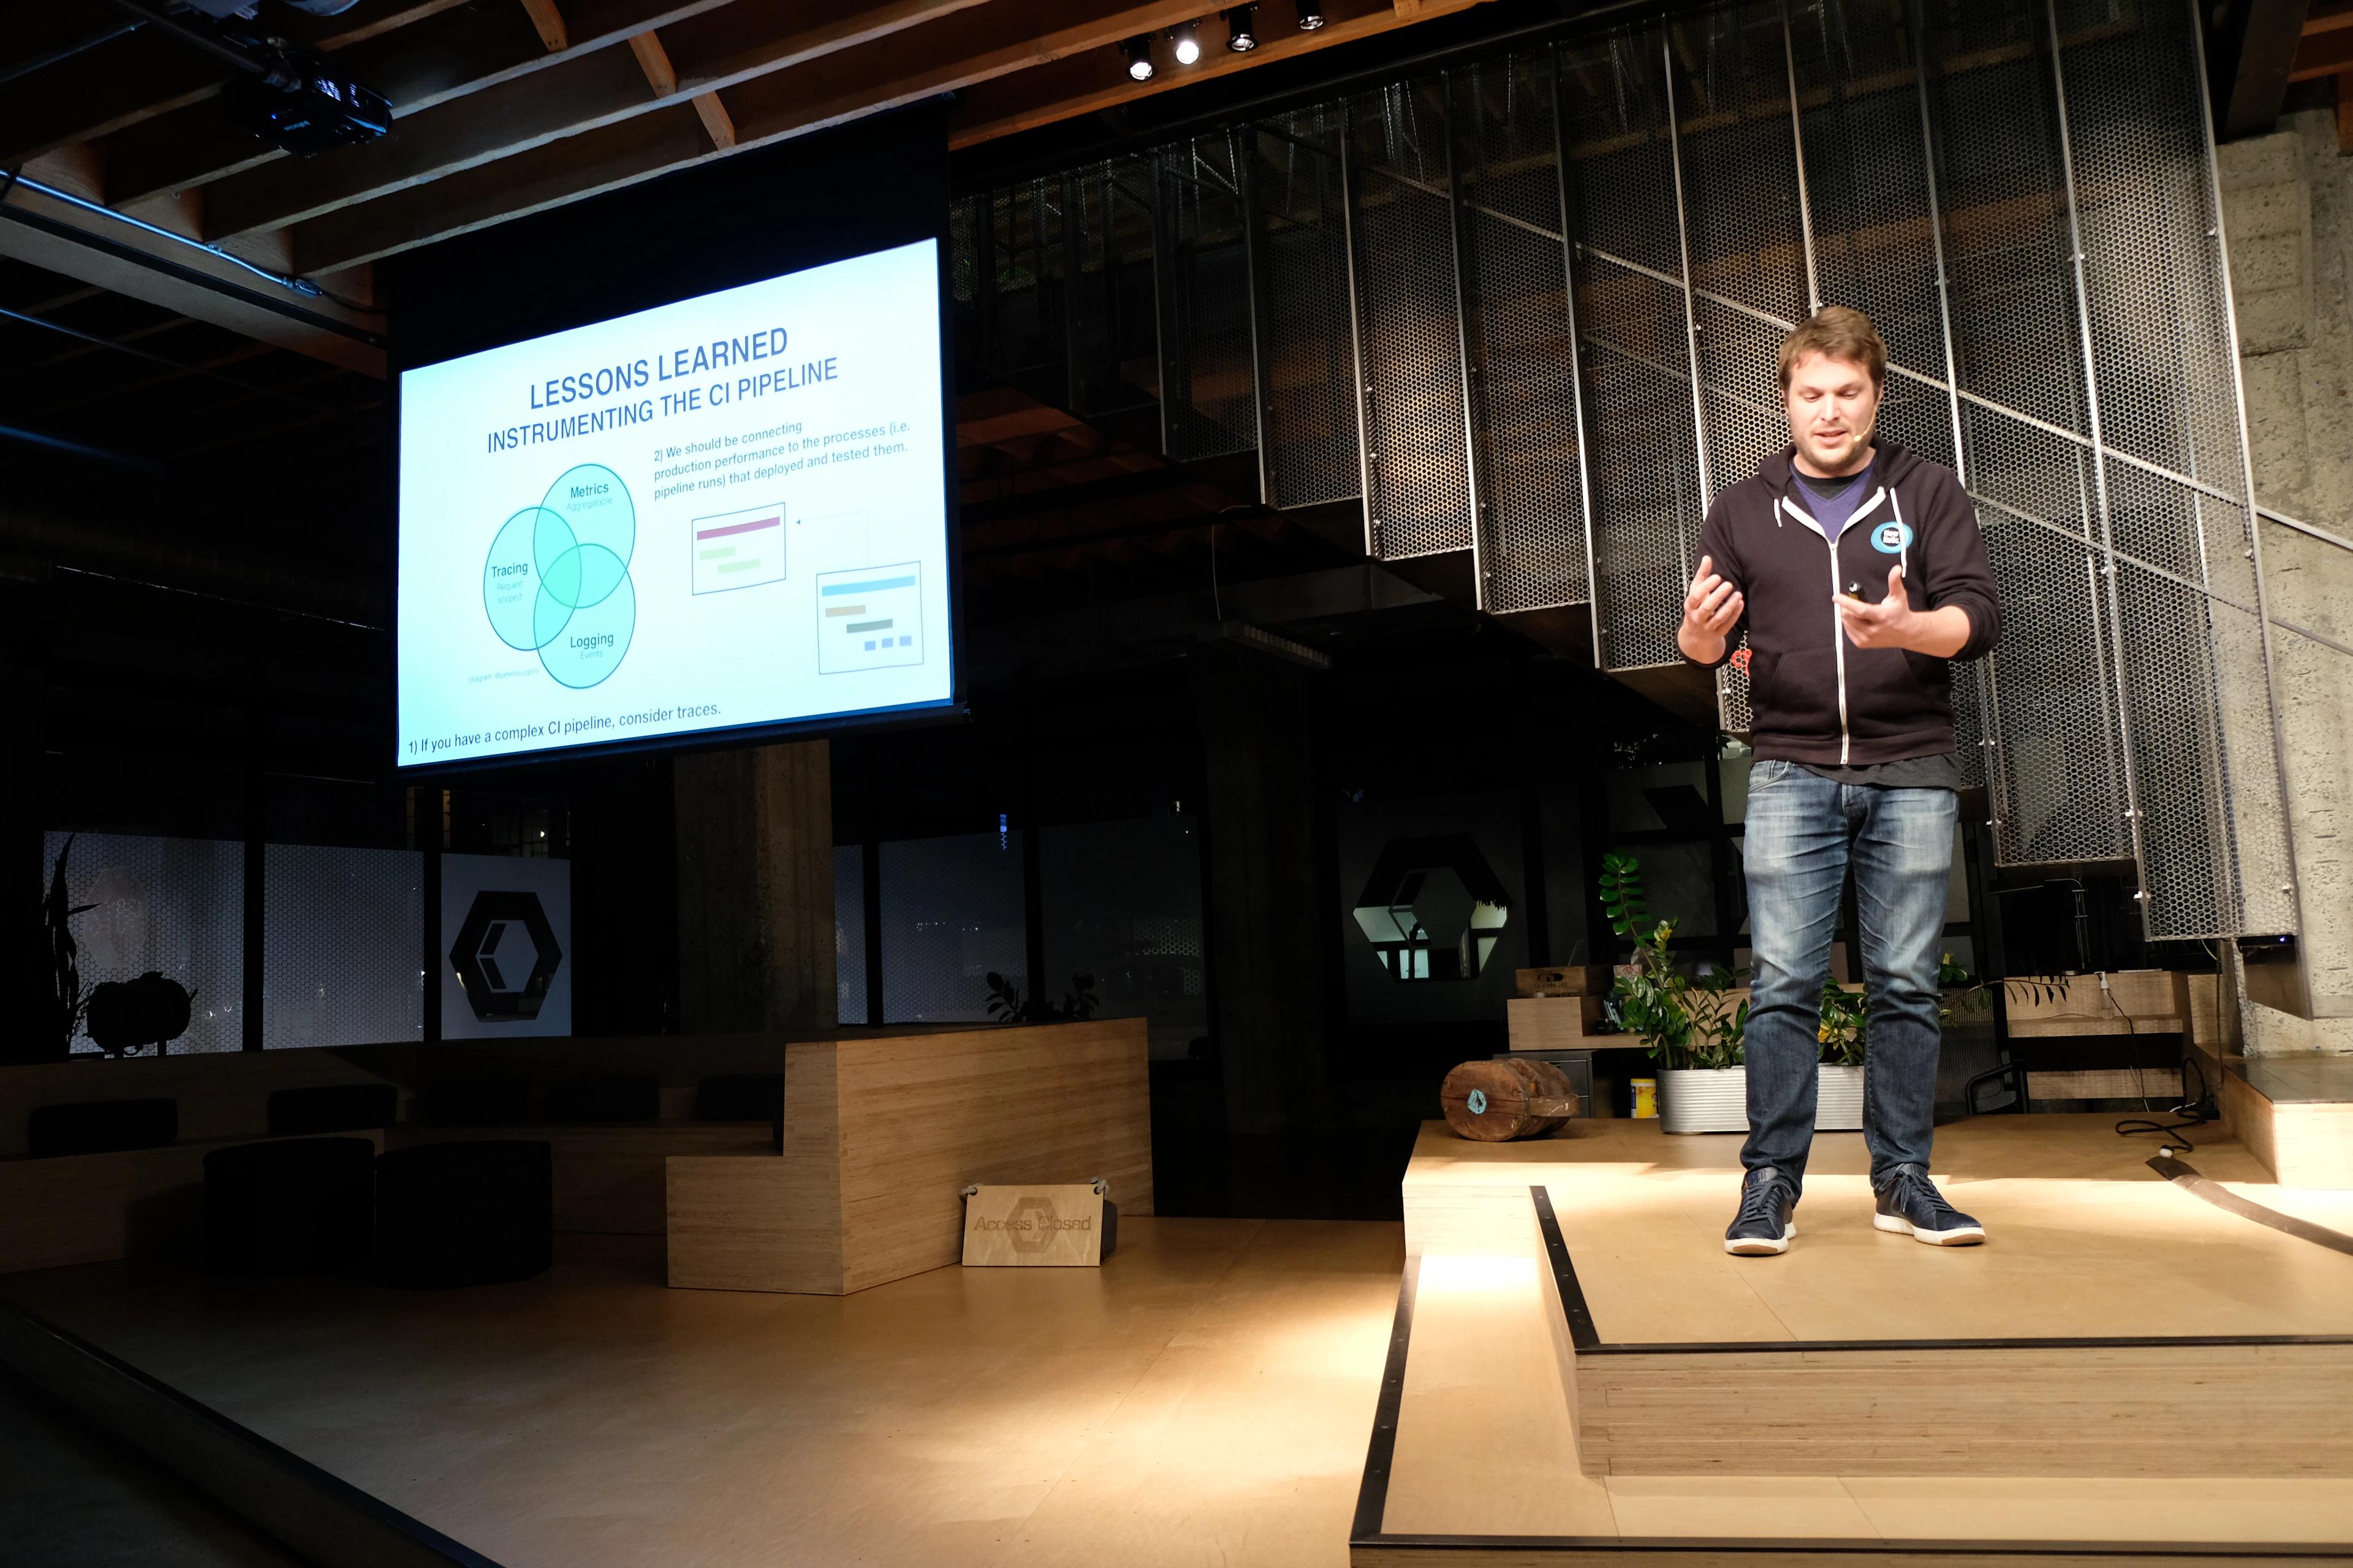
In February, we invited New Relic Developer Advocate, Clay Smith, to our Test in Production Meetup to talk about instrumenting CI pipelines. If you're interested in joining us at a future meetup, you can sign up here.
Clay took a look at the three pillar approach in monitoring—metrics, tracing, and logging. He wanted to explore what tracing looks like within a CI pipeline, and so he observed a single run of a build with multiple steps kicked off by a code commit.
“I wanted to try and apply some of this stuff to understanding AWS CodePipeline that I was using to build some Docker images. The question that I wanted to explore and kind of get into and try to learn more about observability by trying to build something is, if we take this really interesting ideas that were outlined in these posts and apply them to a CI tool, what can we learn and what does that actually look like?”
Watch his talk below.
TRANSCRIPT
Clay Smith:
I've had this very long and checkered history with attempting to build CI pipelines. My background's engineering, not release or operations. It's been a mixed bag of trying to build pipelines most disastrously with iOS and the Xcode build server. Trying to build something fast and reliable to do these checks that makes it easier to actually deliver software.
I revisited that fairly recently after spending a lot of time in 2017 reading a lot about this notion of observability and just going over some really interesting material on that. The inspiration for this was basically three things I read, kind of what was my reading list in 2017 for observability.
The really interesting thing is a lot of the really interesting posts and thought leadership I guess you could call it, has been very much centered in San Francisco. I think we can more or less blame Twitter to some extent for it.
Back in September 2013, they described the situation where Twitter was undergoing rapid growth. They were having issues managing and understanding their distributive systems. They introduced this notion of observability, which isn't necessarily something new, but it was new in this kind of IT distributive systems context.
In 2017, there were two really great posts I highly recommend you read. They were pretty widely circulated. The first was from Copy Construct's Cindy Sridharan, she wrote a really amazing post that kind of described that these three things, metrics, logs, and traces are really central to the notion of understanding the work your system does.
We had the three pillars conversation or post, and then slightly before that this Venn diagram from Peter Bourgon. I thought these posts were super cool because again my background isn't necessarily in operations and caring really deeply about log, or metric, or trace data. I thought the way they presented these ideas was super interesting.
In particular, this Venn diagram that was presented in this post, I thought was really interesting because it got this idea that when we're talking about metrics, or logs, or traces, which we heard about in the previous talk, there is some sort of relationship between all of them.
I had a couple days right before New Years, and I wanted to try and apply some of this stuff to understanding AWS CodePipeline that I was using to build some Docker images. The question that I wanted to explore and kind of get into and try to learn more about observability by trying to build something is, if we take this really interesting ideas that were outlined in these posts and apply them to a CI tool, what can we learn and what does that actually look like?
I was at Re:invent this year, which was very, very large, I think around 50,000 people. There was a really cool dashboard that Capital One was showing off. I took a photo on my phone, it's open source. I think they were calling it something like the single view of the DevOps pipeline.
They have some really interesting metrics and graphs around things like build failures, what's the ticket backlog, what's the build speed in success, things you would expect. Typically, if you use Jenkins or all these other tools, there's almost always a way to inspect log output.
Taking the three pillar approach, it seemed like in this view and in other common systems and tools, there wasn't much necessarily going on with getting a trace of what work is actually going on inside some sort of CI pipeline.
I really wanted to explore that and try and build something in a day or two. The one thing that I kind of changed from the Venn diagram, instead of scoping a trace to a request, what if we just scope it to a single run of a build. Multiple steps kicked off by something like a code commit.
I was using AWS CodeBuild at the time, this is managed infrastructure from AWS. How it works is you have a YAML file, you can give it a container, and you basically give a script. It can do things like build an image, compile code, you can configure it in a lot of different ways.
The infrastructure itself, like a lot of AWS services, is fully managed so there's nothing to SSH into. You don't have access to the host, no root privileges. You're kind of just locked into that container environment, similar to SaaS based CI tools.
What I wanted from that, as it goes it through it's build steps, I want the trace view. One of the things that I had a lot of fun doing was I realized there was no way I could really natively instrument the code build process. It's fully managed by AWS, they're not going to give me access to the code.
Inspired by the diagram, if you can log an event and if you can log the relationship between different events, you can get something that kind of approximates traces. I just wrote a really stupid thing, there's a verb at the front, you capture different events, and you're writing it to a file.
The idea there is you're writing this formatted log, you're doing this as each build step progresses. You can have write access to the file system in CodeBuild so nothing big there. From there, we can actually build these traces. There was also a huge hack, so you could actually capture those events in real time. It would just hail the log file that you're writing events to, and send it up to the back end, which in this case is just New Relic APM.
Once all that's in place, you can actually get this tracing specific view of different events inside the AWS CodeBuild pipeline. It's really interesting because all of this stuff was designed very much for an application. I think this view has been around in New Relic for more than seven years.
When you apply it to the pipeline, you actually still get some pretty interesting views of what's going on. First is just the frequency and duration, but then you actually see the breakdown in time between each step. Not surprisingly, the build step which is actually building the Docker image takes the most time.
From there, because we're actually building a Docker container, we know from what commits and source control actually builds the image, and we use that to actually connect it to production performance.
The hack, or the trick, or the thing here with instrumentation is when it's actually building the Docker image, we tag that trace with the get commit hash of what's actually being built. When we run that code in production, we also capture that as well so we have traces of how the code is behaving in production. We also have a trace of how that build artifact, that Docker container that's running in production, was actually being built.
Here you have this interesting view of you see code running, this is different deploys, there's a spike as [inaudible 00:07:50] scales up and down and all that. You also see next to it what was actually happening when that Docker image was being built in the first place.
An interesting connection between connecting these potentially complicated processes of actually building the image that you're going to get gradually deployed to production. If you can annotate both traces with something like a git commit hash or a version number, you can connect them together, which I think is kind of interesting.
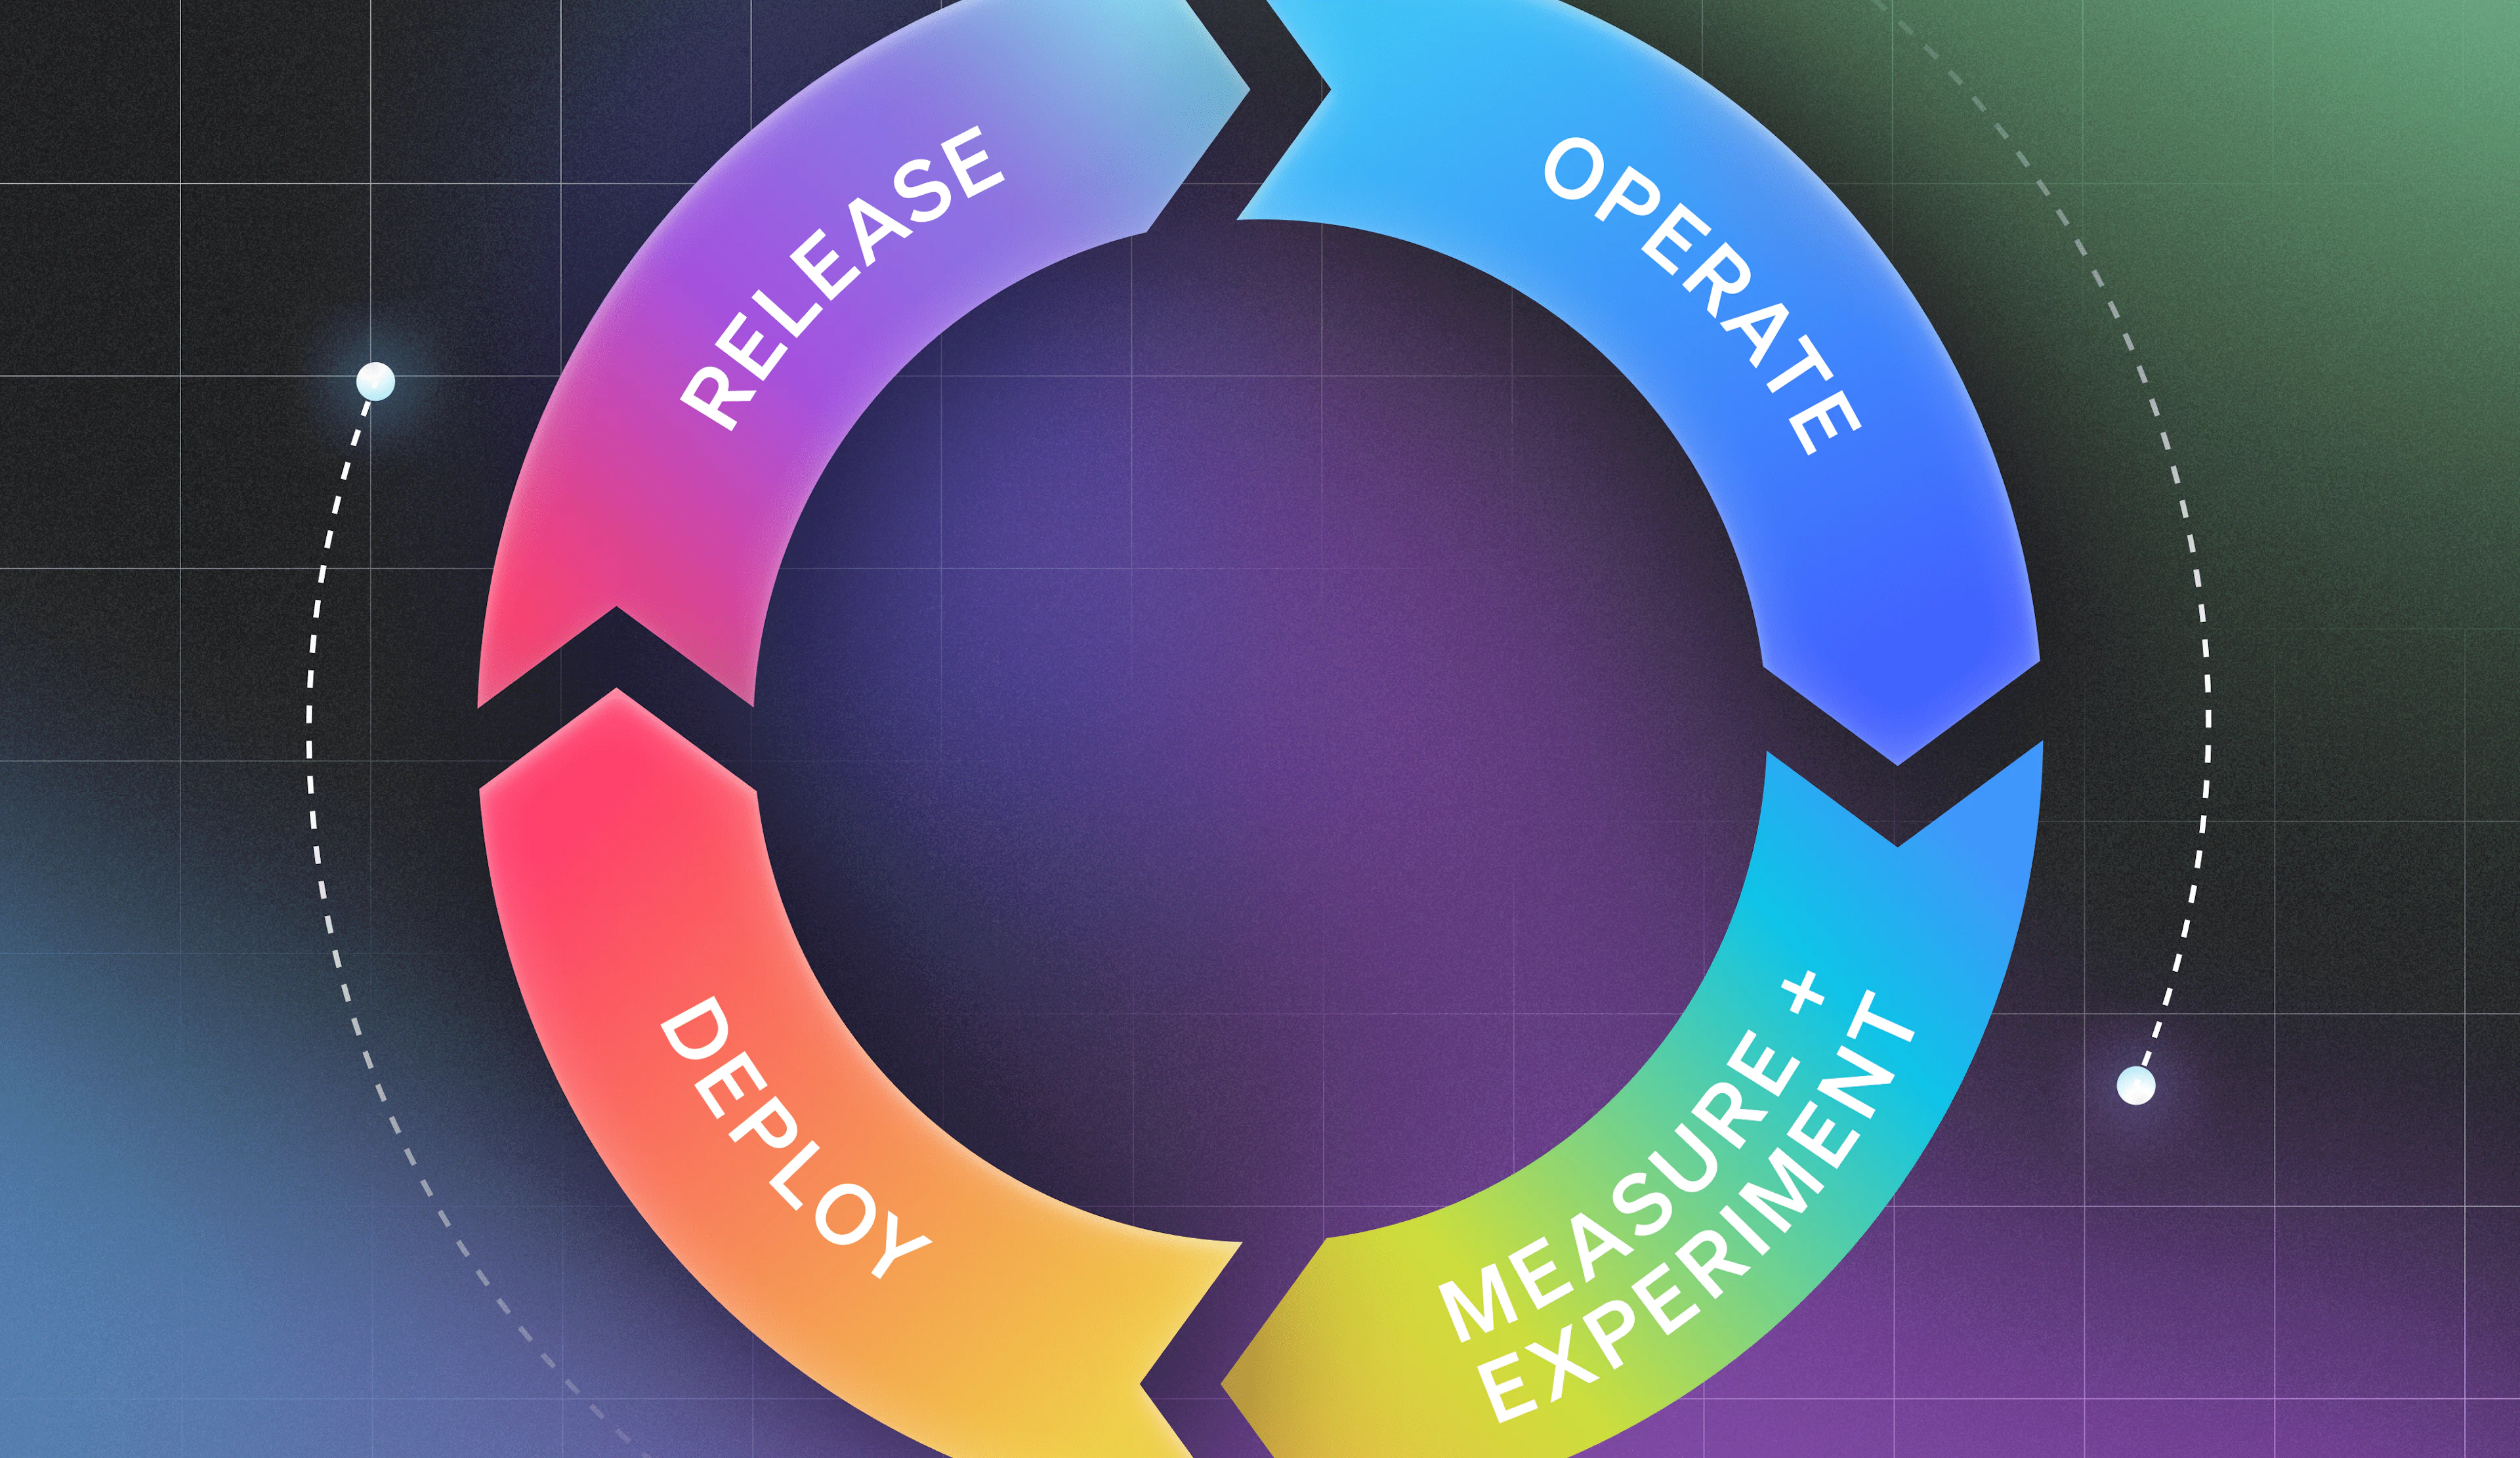
To wrap up this experiment, I think we talk more and more to different customers and people that are building very complex pipelines. Often at the end of that pipeline, there's a very complex deploy strategy. Blue green, I read a really interesting post the other day that was talking about, this is a blue green rainbow deploys, 15 colors, or 26 colors. Canary deploys, lots of different strategies.
With that complexity, it feels like the stuff that we all know and are hearing about managing systems who need services could potentially apply in some respects to complex pipelines too. I think this idea of understanding and monitoring your production performance and then being able to have some relationship where you connect it back to whatever it was that built it, ideally ran through some automated tests, test suites, that seems pretty interesting too.
It was a really fun exploration. It was fun to get my hands dirty with these ideas around observability. So many people that go through this to learn about it, it seems really important and also really interesting. Looking forward to continuing the conversation about how people are attacking this and applying it to things we're all building.
On that note, thanks very much.