LLM observability analyzes how models behave across development, testing, and production. It extends traditional observability by tracking model outputs alongside metrics such as quality, safety, cost, and user impact.
Because LLM outputs are probabilistic and can drift over time, teams need visibility into both system performance and model behavior. This helps detect anomalies, reduce hallucinations, and maintain reliability in production systems.
The following sections focus on the architectural patterns and runtime integration points that make this practical in real-world environments.
Summary of key LLM observability concepts
Concept | Description |
|---|---|
Metrics | Quantitative signals (e.g., latency, token usage, error rates, and accuracy scores) and qualitative signals (e.g., faithfulness checks, context grounding, and hallucination detection) that capture LLM system state and quality over time |
Logs | Detailed, structured event records (inputs, outputs, context documents, errors, and parameters) used for debugging, auditing, and replaying user journeys |
Spans | Individual timed events (such as “OpenAI API call” or “RAG retrieval step”) that record start/end time, duration, and metadata, serving as the building blocks of traces |
Traces | End-to-end request journeys showing prompts, tool calls, outputs, and feedback, enabling root cause analysis |
Prompt and context tracking | Recording user queries, retrieved documents, and instructions to debug hallucinations, context failures, and prompt drift |
User interaction tracing | Capturing explicit and implicit user feedback (thumbs up/down, edits, retries, comments, etc.) to refine prompts, retrieval, and fine-tuning over time |
System metrics | Tracking infrastructure and runtime signals (latency, token costs, error rates, cache hits, throughput) for capacity planning and performance optimization |
Automated Evaluations | Running synthetic queries or test suites with both automated and human scoring to catch regressions and validate changes to models, prompts, or pipelines. LaunchDarkly AI Configs has built-in online evaluations (“LLM as a judge”) that can automatically score outputs on accuracy, relevance, and toxicity for sampled outputs without separate infrastructure. |
What is LLM observability?
LLM observability is the continuous process of monitoring, analyzing, and improving how large language models behave in real-world use. Unlike in traditional deterministic systems, where performance is defined by uptime or latency, LLM observability focuses on understanding how a model thinks, responds, and evolves. Because LLMs are stochastic and opaque, their outputs depend on hidden reasoning and probabilistic sampling, so observability becomes crucial in understanding why the model behaves as it does. By systematically tracking inputs, outputs, latency, and other key metrics, teams can detect anomalies early, refine prompts, and maintain model reliability.
In essence, observability builds trust and accountability, ensuring that the system aligns with both business objectives and ethical standards.
Why observability matters in production AI systems
Traditional monitoring tools capture infrastructure metrics such as CPU load or memory usage, but LLM-based systems also need visibility into what the model is saying and why. LLM observability fills this gap by enabling teams to do all of the following:
- Track both technical and semantic performance, including latency, token consumption, accuracy, relevance, and safety
- Detect misuse or adversarial behavior, identifying anomalies, prompt injections, or data leakage attempts before they escalate
- Support compliance and auditability by providing traceable logs and lineage for sensitive or regulated applications
- Identify misinformation and hallucinations, flagging factual inconsistencies that could harm credibility
- Provide end-to-end tracing across retrievers, vector databases, model calls, and post-processing chains
- Incorporate user feedback loops, turning feedback into continuous prompts or retrieval optimization
- Visualize key metrics through LaunchDarkly AI Configs dashboards, including token usage, cost, latency, and quality scores per variation, making it possible to directly compare different model/prompt versions and pinpoint regressions or drift.
Ultimately, observability transforms the LLM from a black box into a transparent, measurable, and improvable system—a foundation for building trustworthy AI in production.
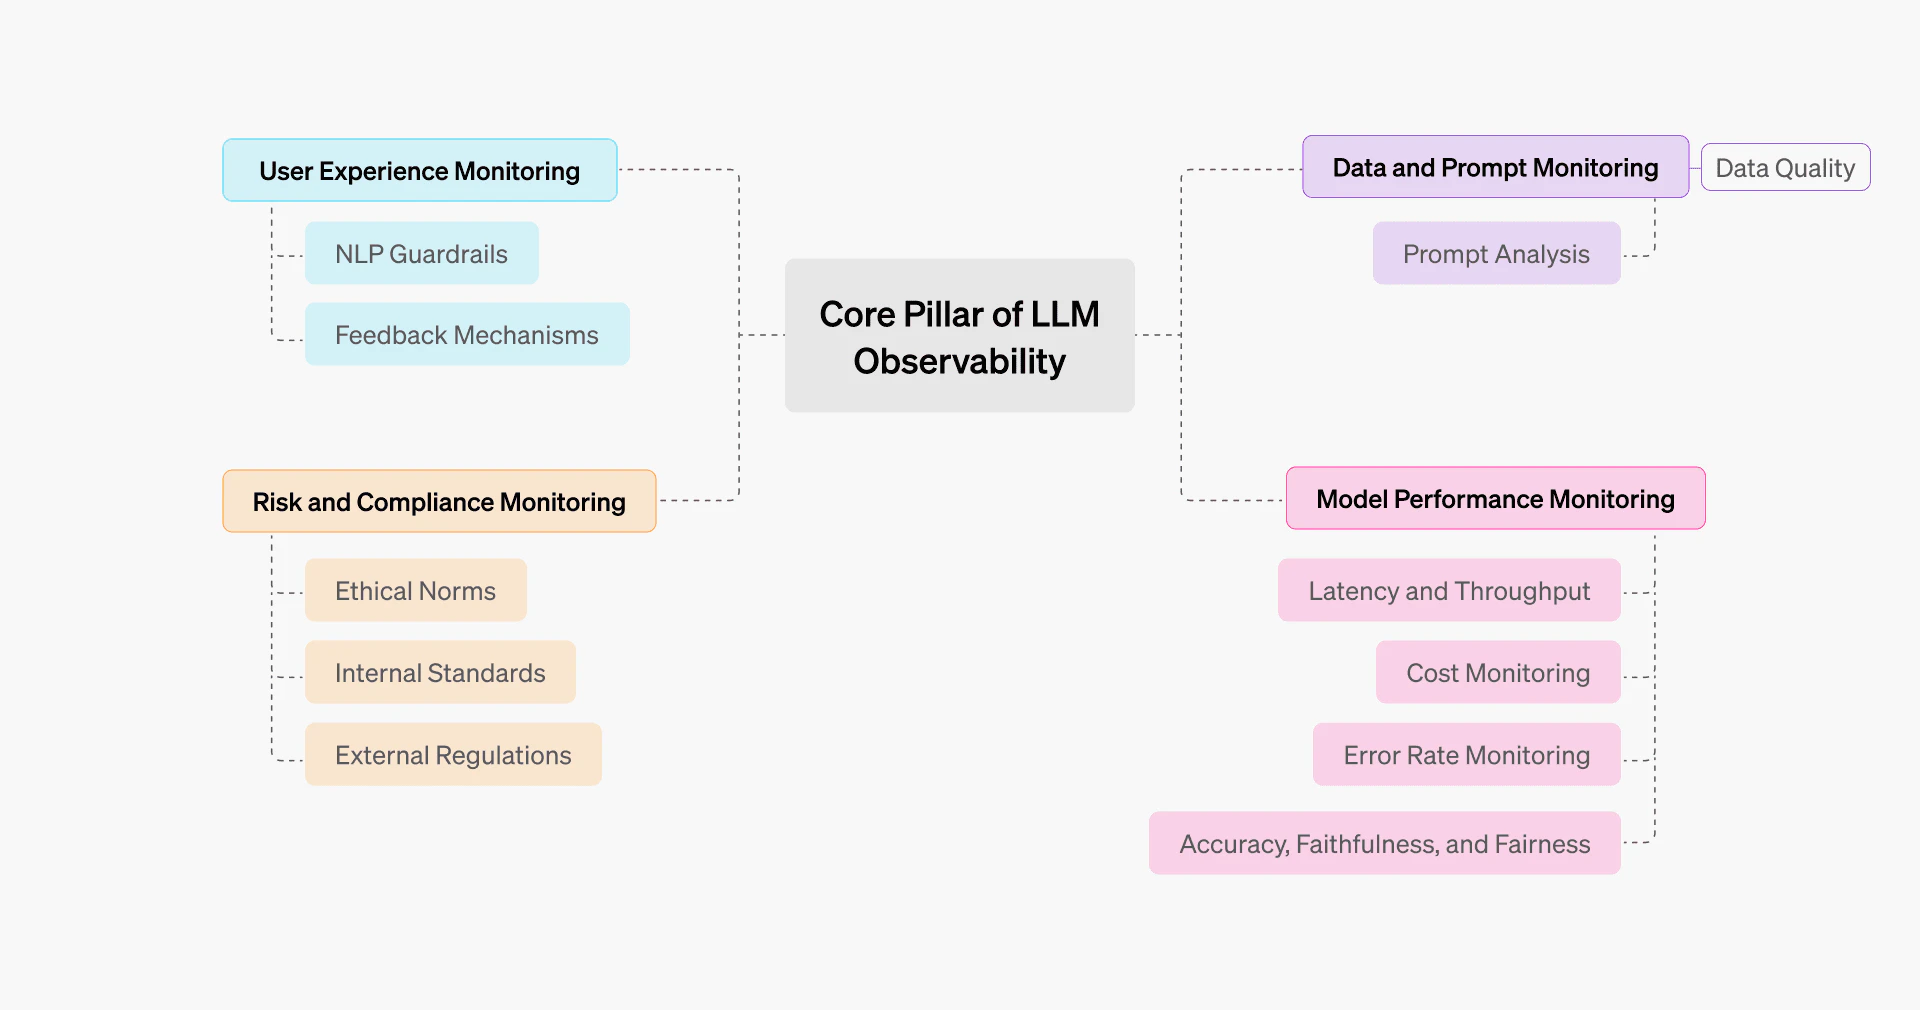
The core pillars of LLM observability
Data and prompt monitoring
The old computer science adage of “garbage in, garbage out” applies strongly to LLMs, so it’s necessary to monitor what you feed them, not just what they produce. You need to track, analyze, and validate everything that goes into the model, including embeddings, prompts, input data, and even context for RAG.
LLMs are extremely sensitive to the phrasing of their input, the length of their context, and the quality of their retrieval. Even minor changes (e.g., prompt rewording or context order) can alter the output’s accuracy, tone, or factual grounding.
Let’s explore this concept through an example.
Let’s say a system is initially prompted with “Answer concisely using the provided context. Don’t include additional info.” However, after a few development iterations, engineers have modified the prompt to something like “Provide a detailed and comprehensive description using all relevant details from the context and your general knowledge.” The addition of this single piece of general knowledge can make the prompt verbose and open-ended, which may lead to not only hallucinations (a substantial issue in itself) but also increased token costs.
This drift behavior can also result from changes to model parameters, which act as hidden variables from the perspective of the prompt text. For example, a prompt may behave consistently when the temperature is set low, but if that parameter is later increased during experimentation and not reverted in production, the same prompt can produce noticeably different outputs. This type of inconsistency is an example of parameter drift rather than prompt text drift.
Prompt drift is rarely intentional; it results from small changes made by engineers, including edits to the prompt text as well as adjustments to parameters, context, or retrieval logic, which collectively shift an LLM’s behavior, tone, or factual accuracy over time. LaunchDarkly AI Configs helps prevent unintentional drift by versioning all prompt configurations with full audit trails. Change are tracked with who/when/what, making it easy to identify exactly when drift was introduced and roll back if needed.
In both cases, observability tooling (not the LLM itself) records prompt versions and runtime parameters (such as temperature and max tokens) and compares the current production configuration against previous versions to identify exactly what changed and where issues were introduced.
Model performance monitoring
Once you have checked that your inputs are of high quality, you need to verify what comes out of the LLM as well. Model performance monitoring focuses on measuring how well the LLM performs once deployed. Questions like “How fast and cost-efficient are those answers?” or “How is the performance after the API update?” can be answered by model performance monitoring.
Most ML models are usually robust, but LLMs can drift silently without much notice (like as a result of a model update from GPT-4o to GPT-4.1). Data and prompt design directly influence model performance metrics such as accuracy, tone, cost, and hallucination rate, while performance signals such as evaluation scores, error patterns, and user feedback reveal weaknesses in prompt structure, retrieval quality, or parameter choices. Model performance monitoring has several layers to it, as discussed below.
Accuracy, factuality, and relevance
Model performance monitoring ensures LLM model factuality and relevance by comparing it to benchmarks or evaluating datasets. Accuracy is measured by checking whether the output is correct or aligns with the given user prompt.
Accuracy varies by task type. Deterministic metrics are used to validate structural correctness (such as valid JSON format), while semantic metrics assess content quality like faithfulness and relevance. For generative tasks like summarization or creative writing, accuracy becomes subjective and is measured by comparing outputs against golden datasets (verified ground truth examples) rather than using binary correctness checks.
Latency and throughput
Latency measures the delay to generate the response for each request. Latency increases due to larger numbers of user requests or longer input; in this case, monitoring on various levels will assist in determining any bottlenecks. Measuring latency is useful for determining a model's responsiveness and usability. In cases where the user is working with real-time data, high latency may have an impact on his or her experience with the system.
Throughput measures the number of requests a model can handle per unit of time. Throughput tracking helps with determining whether to scale up or down the required resources; poor throughput indicates an issue with the models' implementation.
Cost monitoring
Observability helps teams track how resources (like tokens or model calls) are used, so costs don’t spiral out of control. By monitoring usage across features or workflows, teams can see which parts of the system consume the most tokens and optimize them for efficiency. Keeping this visibility high helps prevent budget overruns and ensures that the system scales cost-effectively.
Error rate monitoring
Error rate monitoring tracks deviated responses, including infrastructure errors (e.g., API timeouts, rate limits, 5xx responses), business logic errors (such as tool call failures or JSON parsing issues), and semantic errors (like factual mistakes, hallucinations, and malformed outputs). It is important to monitor the error rate to support the model's reliability, as this is useful in detecting when the performance of the model begins to deteriorate. AI Configs SDK provides automatic tracking via tracker.track_success() and tracker.track_error(). For OpenAI, track_openai_metrics() captures tokens, duration, and success/error in one call.
User experience monitoring
An LLM system has a significant human side beyond technical specifications; user experiences involve subjective attributes such as confidence and ease of use. For instance, while some AI agents are specifically designed for coding (like Copilot), a user might personally prefer a tool like ChatGPT for coding, finding it more trustworthy and user-friendly.
To monitor the user experience, teams can implement simple feedback mechanisms, such as reaction emojis, ratings, or comments used by platforms like ChatGPT. AI Configs supports feedback tracking via tracker.track_feedback() with positive/negative signals. This data flows to the dashboard for correlation with model variations. Advanced techniques such as NLP classifiers or “LLMs as judges” can also be employed to conduct sentiment analysis on user feedback, thereby assessing the user's mood.
Risk and compliance monitoring
Risk and compliance monitoring is the fourth pillar of LLM observability. Often mistakenly treated as an afterthought, it can be the most critical observability facet of a system because it ensures that LLMs comply with:
- Policies and internal standards: company guidelines, security rules, allowed content, tone constraints
- External regulations and legal requirements: privacy rules, record retention, auditability, and sector-specific regulations
Ethical goals (fairness, inclusivity, avoiding discriminatory language) often overlap with policy, but they are not the same thing as regulations; treat them as separate concerns with separate checks.
Some of the key risk and compliance monitoring key mechanisms are:
- Guardrails and filters
- Adversarial prompt detection
- Drift and policy alignment checks
- Audit logs and traceability
- Automated compliance scoring (which uses regex for PII detection, toxicity classifiers, or policy engines to auto-flag risky outputs before they reach users)
Techniques and tooling for observability
There is no best tool or a single do-it-all tool; instead, an ecosystem of tools is required for effective LLM observability. That said, while there are a lot of techniques, the main methods include logging and tracing as well as metrics and dashboards, with additional approaches discussed shortly.
Observability also benefits from dynamic prompt composition. Using variable substitution (e.g., {{user_tier}}, {{context}}) lets you tailor prompts at runtime without code changes, improving both monitoring fidelity and prompting flexibility.
Logging and tracing
Logging and tracing form the backbone of observability, creating a detailed timeline of everything that happens within the model’s inference path. There are two types to consider:
- Centralized structured logging: This means tracking every inferred event, including request inputs, generated outputs, cost, delay, errors, and token use. A span is a record of one single event (like “OpenAI API call”) that captures when it started, when it ended, and how long it took. To facilitate querying and analysis across production systems, these logs are kept in a structured format (such as JSON).
- Distributed tracing: Connect spans (a span is a single timed unit of work inside a requestor or a trace) across services so you can see the end-to-end journey. For example, a single user request might pass through retrieval, reranking, LLM inference, and post-processing. Distributed tracing (often via OpenTelemetry) stitches these spans into one trace for root cause analysis.
Metrics and dashboards
Almost any system generates large quantities of logs. Metrics transform these logs into quantitative indicators that can be visualized and monitored over time.
Key metrics include:
- Latency percentiles to detect lag or capacity issues
- Error rates and retry counts that show model reliability problems
- Token consumption per request to track the cost efficiency of each request
- User satisfaction or moderation flag rates, which indicate the quality and safety of generated content
These measurements are combined into real-time dashboards using visualization tools such as Datadog, LaunchDarkly, Langfuse, and Grafana. They provide cost and performance trends, highlight abnormalities, and indicate regression patterns, such as increasing latency or higher hallucination rates.
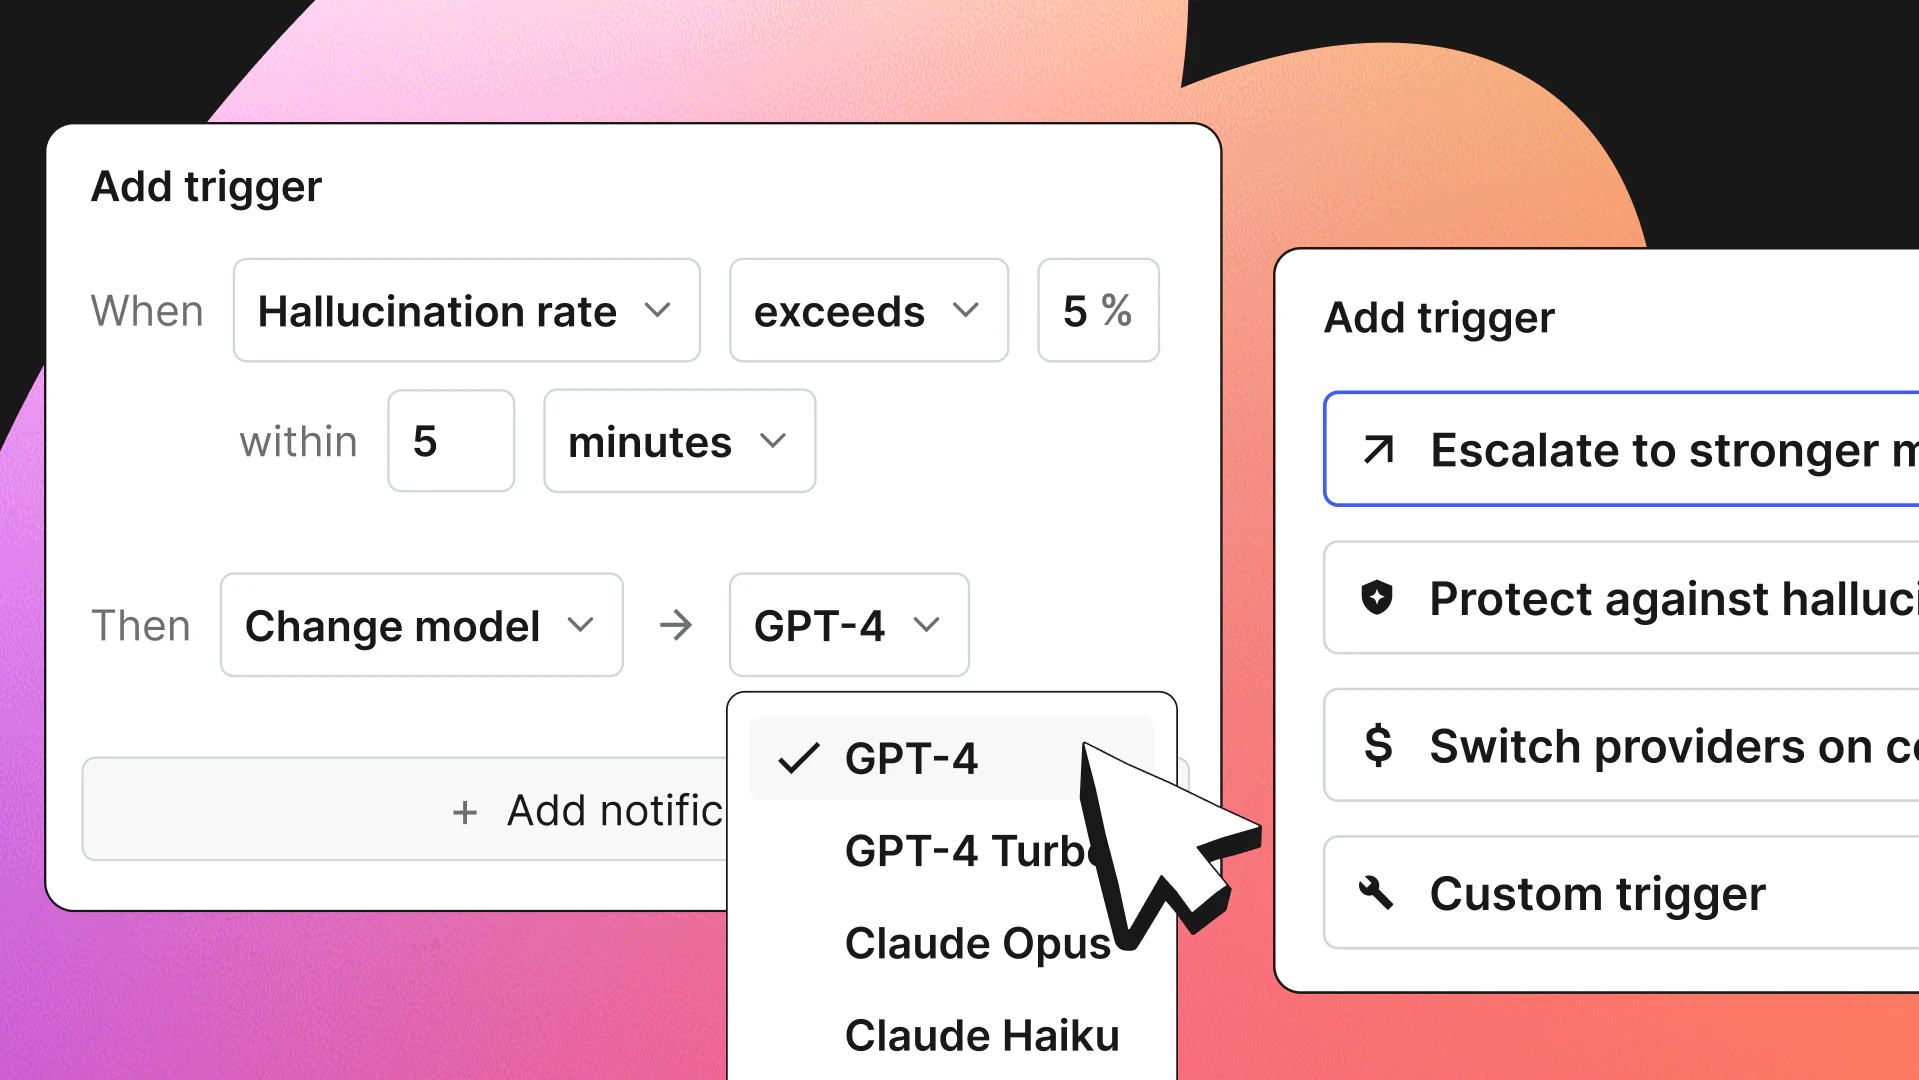
Dashboards not only visualize data but also send automatic alerts to teams when key metrics exceed their important limits, e.g., latency over 5 seconds, token costs surpassing budget limits, or error rates above 2%. These alerts help teams react quickly to issues. LaunchDarkly dashboards track token consumption and error rate over time, while Grafana dashboards based on Open Telemetry traces may split performance by model version or prompt type. In the end, these visual insights help with implementing fixes like rollbacks or retraining.
Evaluation frameworks
Evaluation metrics translate an LLM’s subjective performance into objective measurements, allowing teams to compare models, prompts, or rollouts using consistent standards. These metrics enable the assessment of LLM performance across various dimensions, including accuracy, coherence, and safety. Evaluation frameworks bring semantic awareness into observability.
Common approaches used in LLM evaluation frameworks include the following:
- Automated evaluation (LLM as a judge): Tools like OpenAI Evals, TruLens, G-Eval, and LaunchDarkly Online Evaluations automatically assess model outputs using scoring rubrics such as factuality, coherence, or toxicity. LaunchDarkly Online Evaluations are built into AI Configs, requiring no additional infrastructure, using scoring rubrics such as factuality, coherence, or toxicity.
- Quantitative metrics: These include lexical metrics (like BLEU and ROUGE) or some semantic similarity (like cosine distance). There are some advanced metrics like factuality, coherence, etc, scores as well.
- Human feedback integration: Human in the loop is probably the best evaluation mechanism here. Hybrid setups enable blending automated and human scoring pipelines.
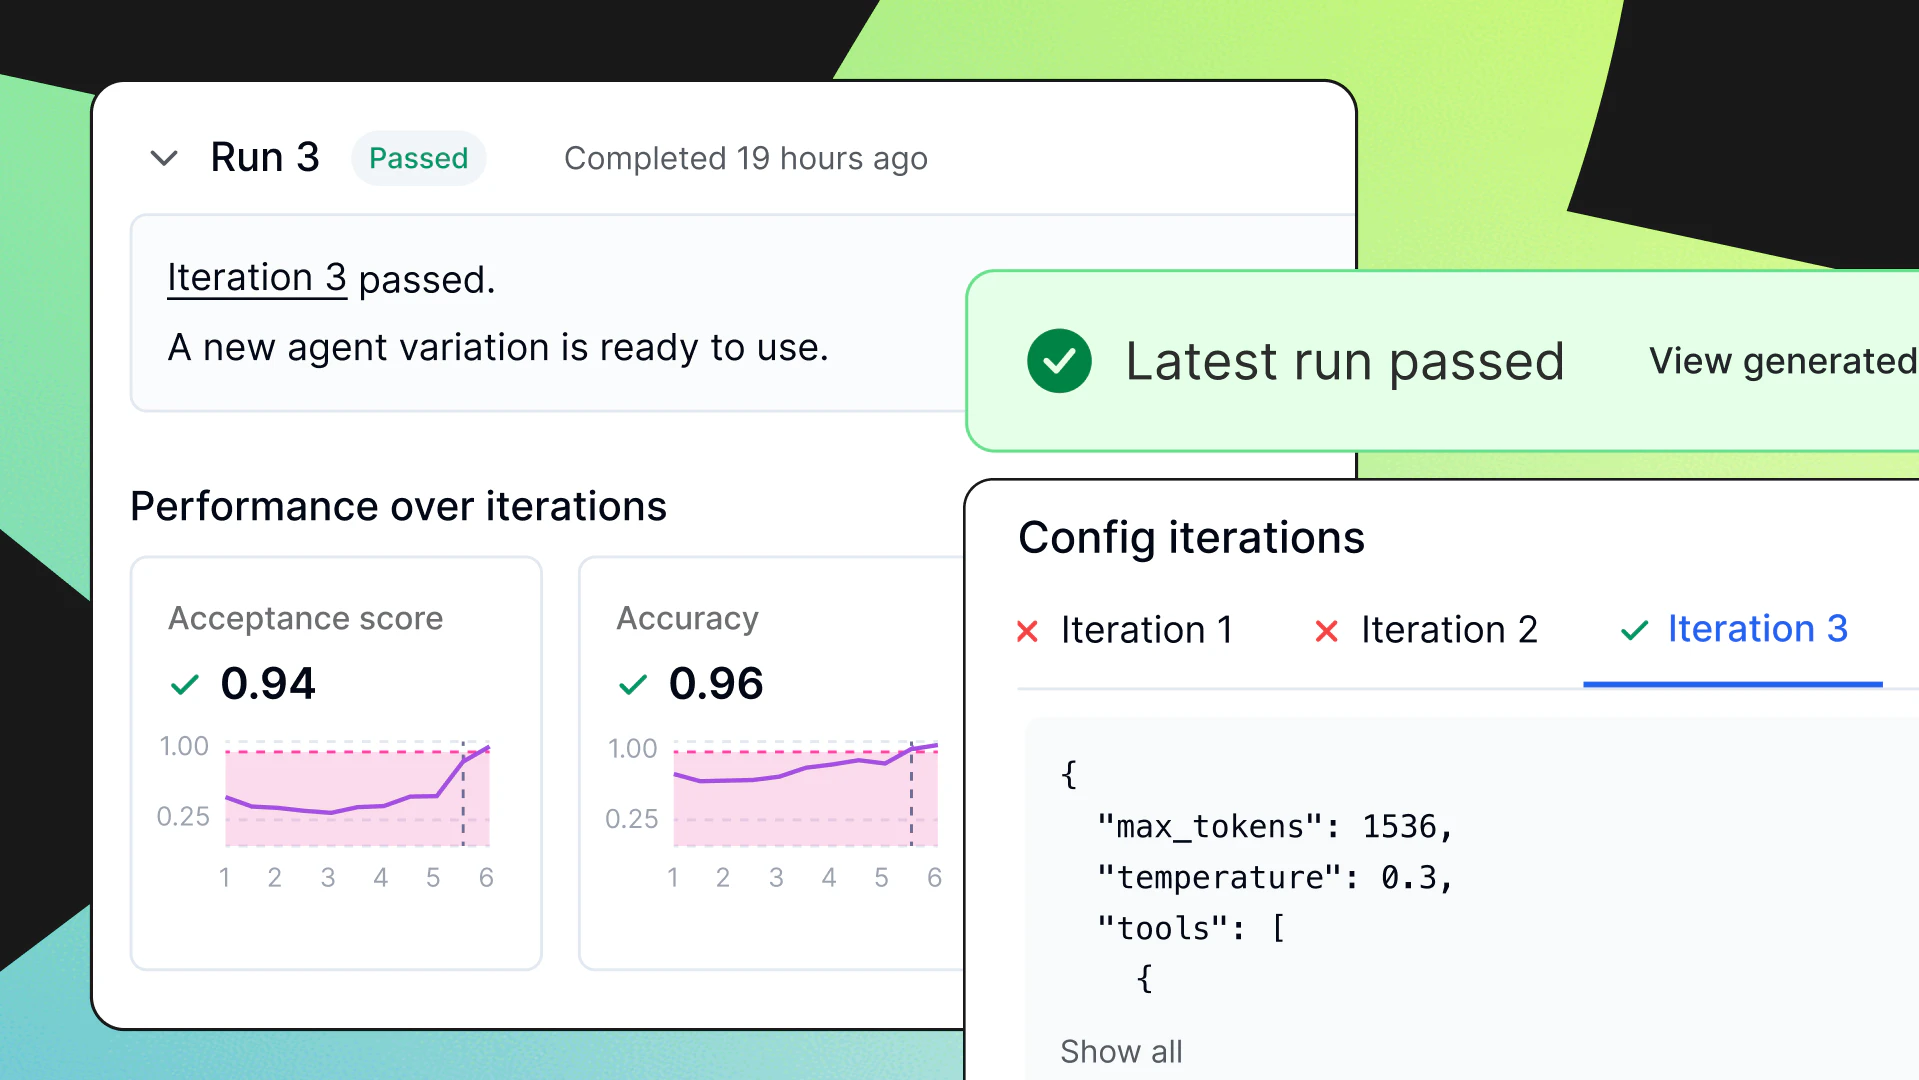
These evaluation methods are deployed operationally through structured workflows. Golden test cases (manually curated high-priority queries with verified correct outputs) are maintained and run in nightly regression suites to catch model drift. Pre-deployment gates block releases if evaluation scores (from automated or quantitative metrics above) drop below thresholds, while canary deployments validate new prompts on a small percentage of traffic before sharing with all users.
Token usage tracking
Every token has both computational cost and contextual value, so tracking tokens is fundamental for cost and efficiency optimization. All generated or consumed tokens are directly mapped to cost and strongly correlated with performance. LangSmith, Langfuse, and Helicone provide token-level tracking of all API call outcomes, including the number of inputs and outputs. Analytics are used to identify prompt overlength, large volumes of output, and cost trends.
Sampling strategies
LLM systems can generate huge volumes of traces and logs. Storing and evaluating everything is expensive and often unnecessary, so teams use sampling to retain the most useful data while controlling observability cost.
Here are some specific sampling strategies:
- Random sampling: A small, fixed percentage of traces can be randomly selected for further analysis; for example, you could opt to sample every 20th trace (5%).
- Tail sampling: All traces can be evaluated upon completion, retaining only those deemed significant, such as traces indicating suboptimal retrieval-augmented generation (RAG) retrieval.
- Rule-based sampling: A set of predetermined rules can be implemented, such as those specifying sampling for prompts exceeding 1,000 characters in length or those utilizing the gpt4o model.
- Adaptive sampling: Here, extra rules can be implemented using a piecewise function approach. For instance, the sampling rate could be set at 5% during high load periods, 12% during medium load, and 50% during off-peak times.
- Semantic Sampling: This technique leverages embeddings to group similar samples together, which is particularly valuable for chatbots that frequently receive identical or highly similar prompts.
- Trigger-based sampling: Sampling can also be triggered by specific events, such as the activation of a drift detector, a spike in similarity mismatches, or the detection of a safety violation.
A hybrid approach, combining some of these strategies, is typically utilized.
Drift detection
Model drift occurs when a system’s behavior changes over time in ways that degrade quality. Drift detection continuously monitors the model’s outputs and input distributions to catch performance issues early, especially during or after rollouts.
Drift analysis becomes more actionable when coupled with AI Configs audit trails that record who changed prompt configurations and when, making it easy to correlate performance degradation with configuration changes.
There are several types of drift:
- Data drift occurs when incoming data shifts from what the model was originally trained or evaluated on. For example, user queries start using new slang, new product names appear, or the topic distribution changes. Even if the model is unchanged, its performance may decline.
- Concept drift happens when the meaning or relationships in the data change. For example, if a new flight routing rule, API format, or market convention appears, the “correct” output for the same input may evolve over time.
- Embedding drift occurs due to changes in upstream embeddings (e.g., from an updated embedding model, tokenization changes, or vector normalization differences). It can subtly shift input representations, leading to changes in reasoning quality.
Changes in accuracy, tone, and reasoning patterns are signs of model drifting: a drop in performance due to upgrading or environmental change. When a system is updated, it compares the updated version with the previous one by using a benchmark to check that the quality is not declining. KPIs such as BLEU scores, sentiment alignment, or human feedback scores are used to monitor this type of drifting in the system.
When drift is detected, teams apply fixes based on how serious the issue is. Prompt adjustments or few-shot example updates are tried first to realign model behavior. If data or concept drift is found, retrieval sources or knowledge bases are updated with updated information. For ongoing performance drops, the system either retrains the model or rolls back to the last stable version.
Monitoring how a model's behavior shifts over time constitutes qualitative drift. This involves a specific analysis of factors like its conversational relevance, the quality of its reasoning, and its overall tone. Behavior drift includes changing user feedback patterns, and hallucination rates might be detected by changes in user satisfaction scores. Frameworks use statistical metrics like Wasserstein distance, Population Stability Index (PSI), or Kullback–Leibler (KL) divergence to compare fresh input or output data distributions with the model's initial training data.
Experimentation and controlled rollouts
Before going live with full production, it's often wise to treat your LLM-powered system as a feature you can test, monitor, and manage dynamically. Controlled rollouts let you adjust the behavior of the model, evaluate real-world impact, and respond to anomalies before full exposure.
These techniques are commonly used for controlled rollouts:
- Feature flags: Use runtime switches to enable or disable the new model version (or prompt variant) for specific users, segments, or traffic. AI Configs variations are purpose-built for this: Each variation can include different models, prompts, parameters, and tool definitions. Switch between them instantly without redeployment.
- Gradual rollouts (percentage rollouts): Release to a small percentage of traffic, monitor, then ramp up as confidence grows.
- A/B testing: Simultaneously serve two or more versions of your prompt/model pipeline (control vs variant) to distinct groups of users, and compare accuracy, latency, cost, hallucination rate, user satisfaction, etc.
- Canary deployments and kill switches: Run a new version on a small slice of traffic (the “canary”). If metrics regress, use a kill switch (often implemented as a flag) to disable the new path immediately without redeploying.
In essence, by integrating observability (traces, metrics, user feedback) with controlled release mechanisms, you can see how the model behaves in production and control how it’s exposed. LaunchDarkly AI Configs is purpose-built for this workflow, combining feature management with AI-specific capabilities like Online Evaluations, automatic metrics tracking, and prompt versioning. Allowing you to tie feature flags into your monitoring, automatically roll back on threshold breaches, and manage rollouts with minimal developer friction.
LaunchDarkly for LLM observability
LaunchDarkly improves LLM observability by handling feature flags at scale, running A/B tests and studies, and gradually delivering software.
Why feature flags matter for LLMs
Feature flags are instrumental in enabling the safe testing or rollback of LLM prompts and models in a production environment, eliminating the necessity for redeployment. LaunchDarkly AI Configs stores model configurations, prompts, and parameters as versioned variations that can be updated instantly without redeployment. The SDKs or the REST API of LaunchDarkly enable engineers to modify flag values, allowing runtime control over application behavior.
Real-time experimentation
Accuracy, latency, and user satisfaction indicators are measured using observability methods to assess LLM performance. You can test new models or prompt variations on limited user subsets and continuously monitor performance indicators. If the results show improvement, then you can gradually scale up exposure. AI Configs Online Evaluations can automatically score outputs during this process, letting you configure accuracy, relevance, and toxicity judges with sampling rates to monitor quality without manual review. This approach reduces risk and validates changes using real production data without impacting all users at once. Feature flags also enable instant rollback if any issues arise.
Progressive delivery for safety
A few safety precautions help teams identify and resolve issues such as increased hallucination rates, latency regressions, or cost spikes before full deployment.
Deploy guardrail updates gradually
When a new prompt configuration or guardrail rule is introduced, LaunchDarkly can initially expose it to a small, randomly selected subset of users. If no anomalies are detected based on metrics such as latency, error rate, hallucination frequency, or user satisfaction, the rollout automatically expands to a larger percentage of production traffic. Monitoring systems like Grafana and Sentry may automatically disable flags when an error rate or delay occurs. This helps in ensuring that guardrail updates—such as prompt logic, safety filters, or content moderation rules—do not result in regression or performance degradation.
Control who sees experimental AI features
Users are given access to the new system progressively, based on contextual attributes like user_id, user tier, role, organization (org_id, plan), and even device context (platform or version). Fine-grained rules can combine these attributes to expose experimental features to precisely defined segments.
Closing the loop with observability
LaunchDarkly creates a continuous improvement loop for LLM systems with observability data:
- Every model request has flag metadata (e.g., model version or prompt ID). This information is entered into data collection analytics.
- The impact of changes like the latency, moderation rate, and user feedback is observed using observability tools (e.g., logs, metrics, evals) to demonstrate the actual impact of the feature changes.
- If performance degrades, flags are disabled or reverted automatically.
- The findings of metrics are used as inputs into the process of prompt or model iteration, and this is a closed loop: rollout→ observe→ analyze→ iterate.
LLM observability example using LaunchDarkly
In this example, a text summarization application is being transitioned into a production system with comprehensive observability. The user submits text to the application, which forwards it to an LLM provider for summarization. At runtime, the application evaluates a feature flag to determine which prompt configuration and model parameters should apply to the request.
Each request is traced as a structured workflow: request handling, configuration lookup, LLM invocation, and response handling. These steps emit structured logs and spans that capture latency, token usage, cost estimates, and generation outcomes. The traces are correlated with the feature flag variation used for that request, allowing teams to analyze how different prompt or model configurations affect performance, cost, and quality.
In production systems, configuration is fetched per request so that targeting rules and user context are applied correctly. Observability hooks sit at the LLM invocation boundary, capturing request metadata, latency, token usage, and evaluation signals before forwarding them into the broader telemetry pipeline. This keeps business logic decoupled from any specific provider or SDK implementation.
Here's what LLM observability looks like in the LaunchDarkly dashboard:
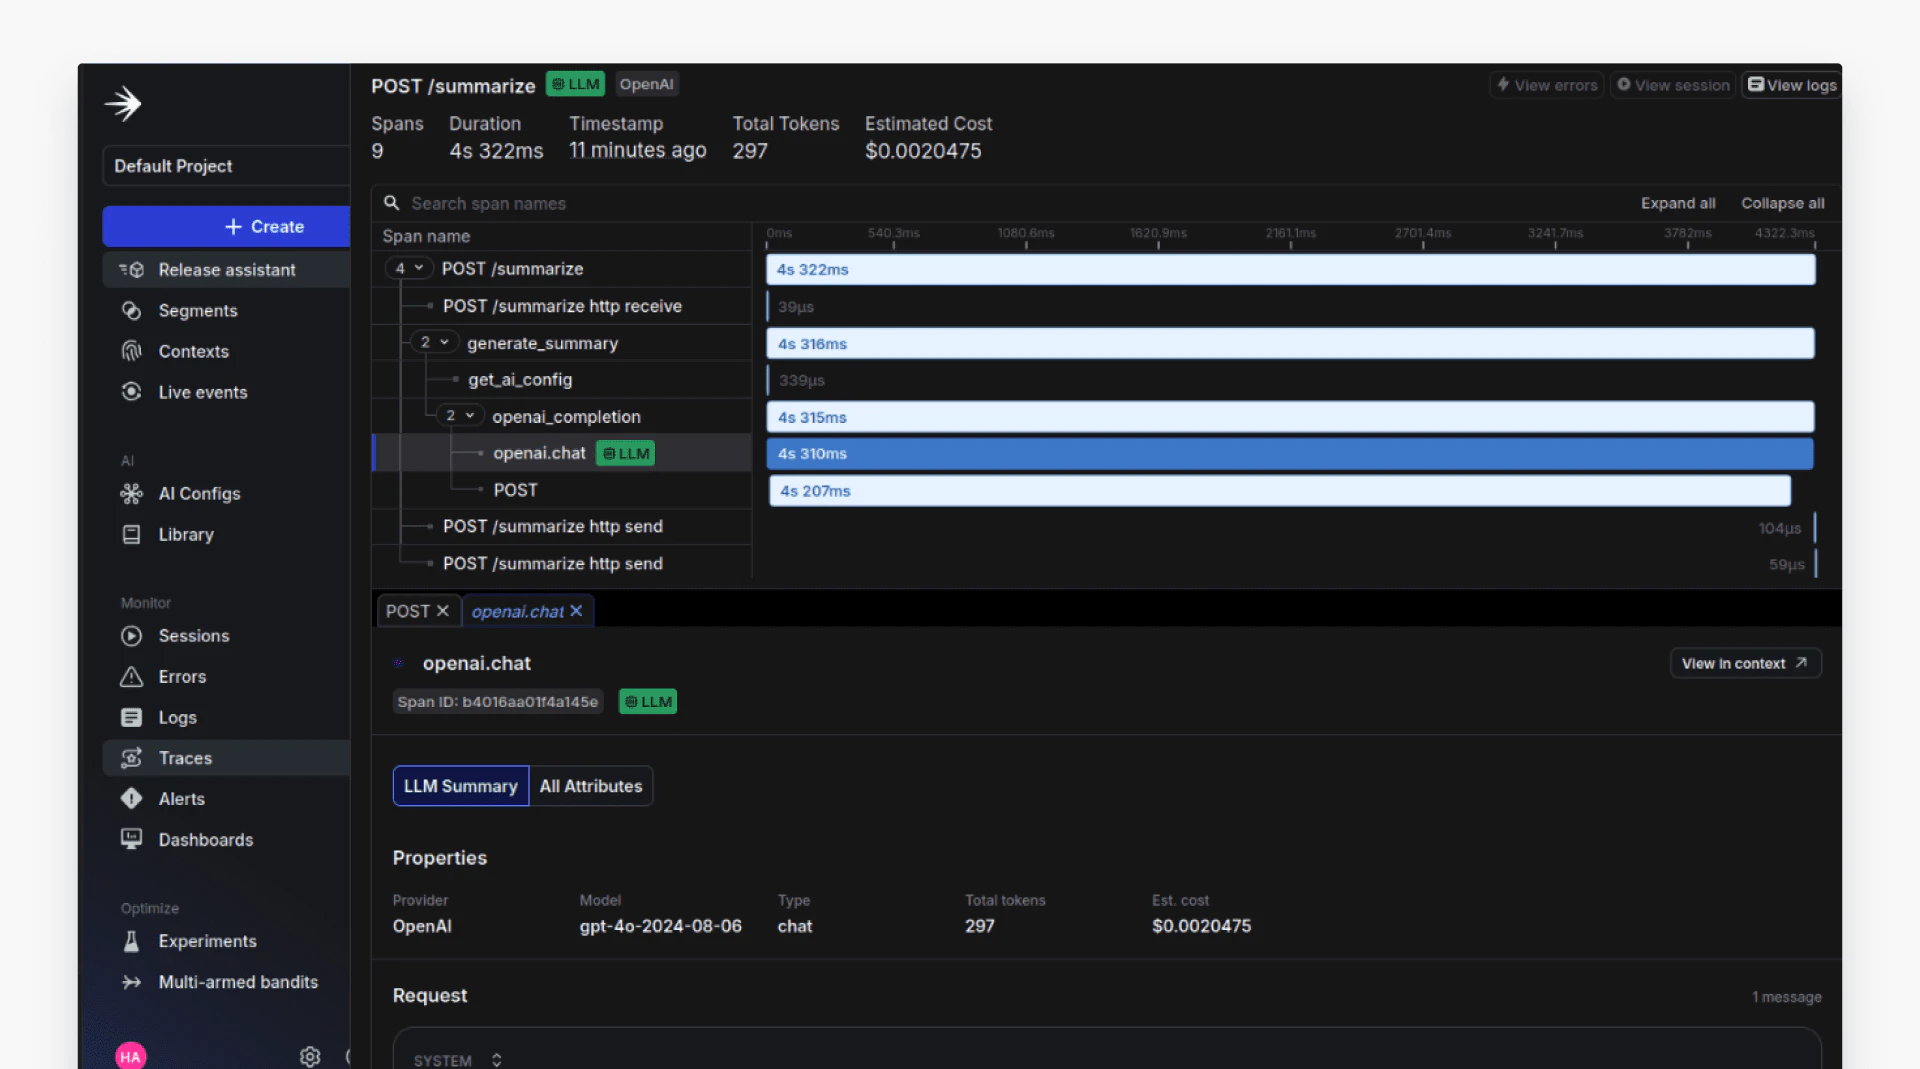
The view shows a single user request broken down into spans such as request handling, configuration lookup, and the OpenAI chat completion call. Each span includes its execution time, token usage, and estimated cost, allowing teams to see where latency is introduced and which steps contribute most to cost.
Best practices for LLM observability
Maintaining observability throughout the LLM lifecycle ensures that systems remain scalable, reliable, and easy to manage. Here are the key best practices to follow.
Log before, during, and after rollouts
Comprehensive logging provides end-to-end visibility into system and model behavior. Detailed logs create a reliable history that supports comparisons, debugging, and post-mortems:
Before rollout: Establish baselines for metrics such as accuracy, latency, token cost, and safety violations under the current setup. Here’s an example baseline log:
During rollout: Record the exact time when a feature flag changes or a new code path activates. Track metrics such as error rate, latency, throughput, and hallucination frequency using tools like OpenTelemetry, Datadog, or Elastic APM. This helps enable quick correlation of anomalies with rollout events.
After rollout: Use tools like MLflow or Datadog Notebooks to verify that new changes meet KPIs before retiring older versions. Continue monitoring aggregated metrics (e.g., accuracy delta, user feedback) to detect drift or degradation over time.
AI Configs automatic tracking handles much of this by default: Requests are logged with variation, tokens, duration, and success/error status without custom instrumentation.
Link observability dashboards with feature flags
LaunchDarkly AI Configs unifies feature management and observability: The dashboard shows both configuration state and performance metrics in one view, reducing the need to correlate data across separate tools to understand how specific changes affect performance. You can associate metrics with flag context, such as model type, prompt version, or rollout percentage. You can also use real-time alerts to detect anomalies tied to new flags and trigger automated rollbacks when needed. Integration offers a data-driven view of how incremental releases impact model quality and stability.
Involve cross-functional teams
LLM observability is a team sport. Collaboration ensures that decisions are informed, aligned, and ethically sound:
- Engineering and DevOps manage CI/CD pipelines, feature flagging, and system metrics (latency, error rate, token cost).
- Data scientists monitor data drift, model evaluation, and hallucination analysis.
- Product, UX, and QA teams use user feedback and engagement data to assess model performance and usability.
Compliance and safety teams review audit logs for toxicity, bias, and factuality, ensuring ethical and regulatory compliance.
Conclusion
Effective LLM observability requires:
- Continuous, contextual logging across all rollout stages
- Integration between monitoring dashboards and feature flags
- Close collaboration across technical, product, and compliance teams
Together, these practices create a reliable, interpretable, and resilient AI system.
For contemporary AI systems to be transparent and dependable, LLM observability is essential. Tracking how models behave and change over time enables teams to identify problems like bias, drift, and hallucinations. When combined with feature control tools like LaunchDarkly, observability enables safe experiments, manages rollouts, and allows rollbacks in context when problems occur, turning insights into action. Observability serves as the framework for reliable, data-driven development as AI systems get more adaptable and autonomous, connecting monitoring and continuous improvement.