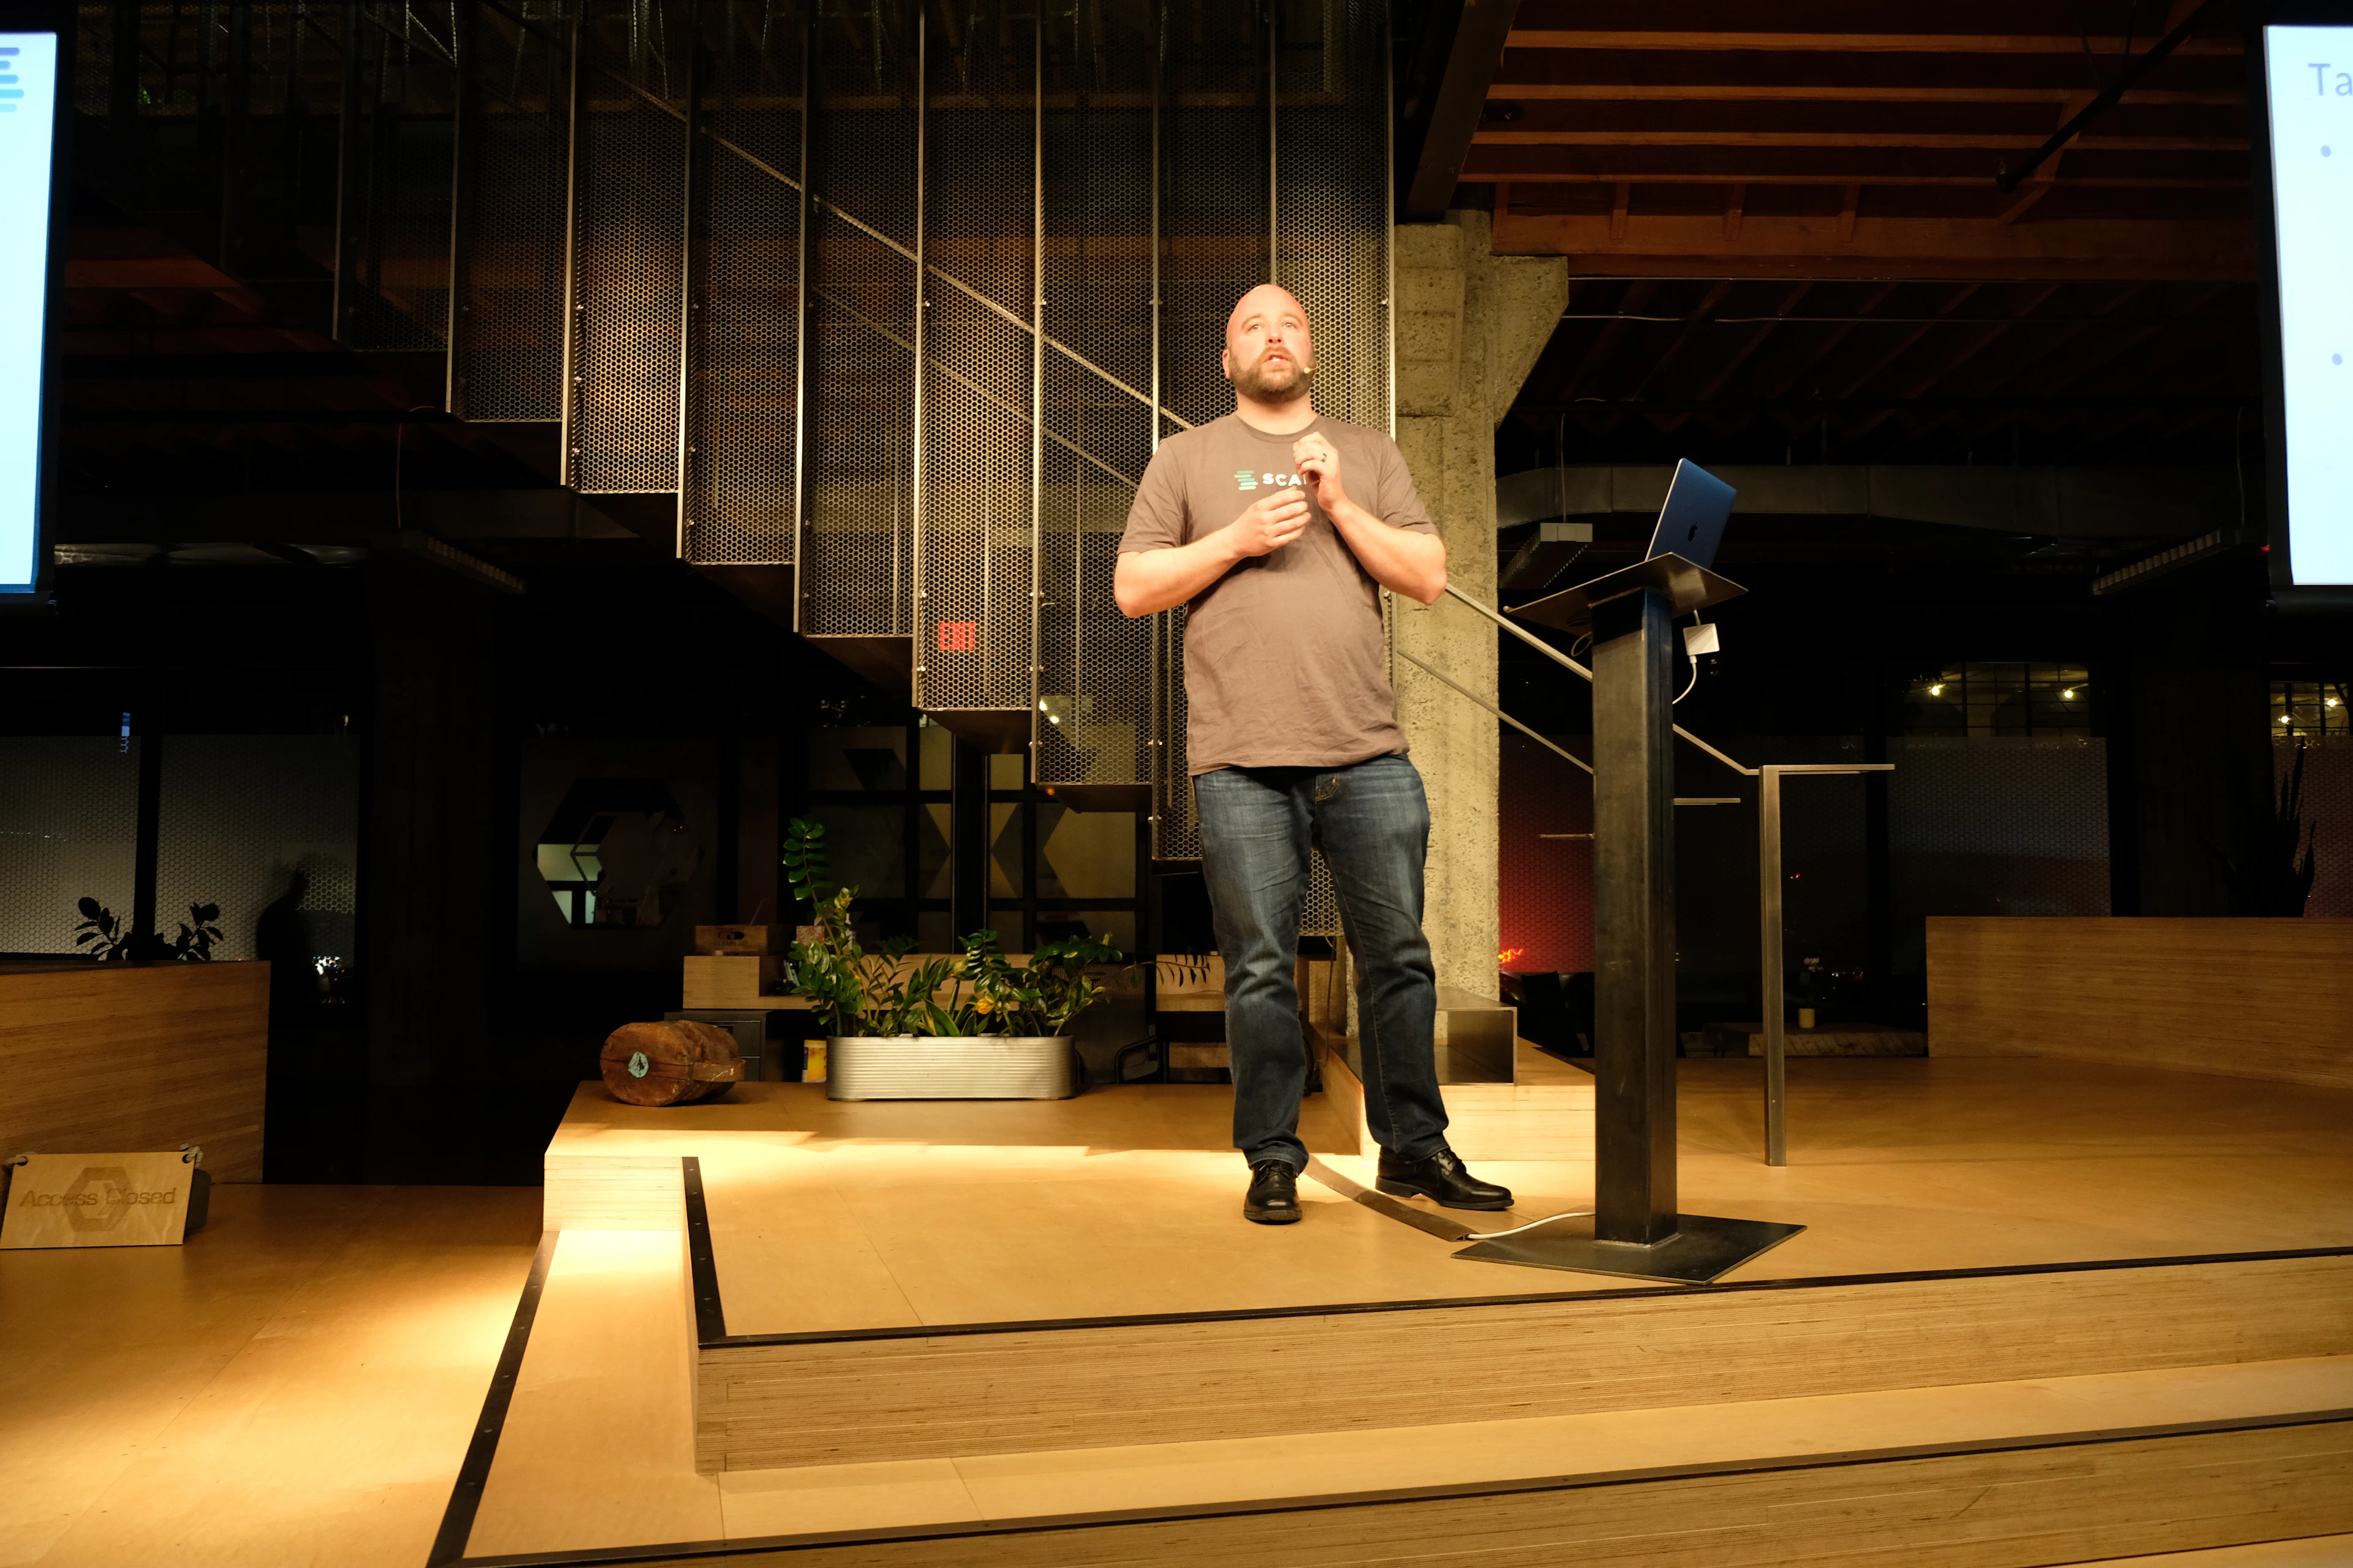
In February Steven Czerwinski, Head of Engineering at Scalyr, spoke at our Test in Production Meetup. This session was focused on monitoring and observability while testing in production, and Steve shows why he feels monitoring is an important element within that process. If you're interested in joining us at a future Meetup, you can sign up here.
Steve presented a case study around latency issues a Scalyr customer recently faced. He shares how his colleague, John Hart, explored the issue, and then reviews some key learnings realized after the event.
“Monitoring is so important to testing in production. I want to evoke the idea that you need to get your monitoring in place before testing in production. If you're not really monitoring, you're not really testing—you're just hoping that things go right.”
"If you're not really monitoring, you're not really testing—you're just hoping that things go right."
Watch his talk below.
TRANSCRIPT
Thanks both to Andrea and Heavybit both for organizing this. This is a topic near and dear to our hearts at Scalyr. As Andrea said, my name is Steven Czerwinski, I'm Head of Engineering at Scalyr. Tonight I'm actually going to be presenting some work done by my colleague, John Hart.
In particular tonight, I'm going to talk about some, essentially lessons that John uncovered while he was performing the deep dive into some query latency issues that one of our customers was facing. And, with this, I'm not going to focus on the particular performance issues that he uncovered. What I'd rather like to do is talk about how our monitoring impacted that investigation. Often our monitoring actually helped out with the investigation, as you would hope it would. It helped make the investigation smoother, uncovered some interesting things. However, there are other times where our monitoring actually got in our way, where it actually hindered and misled us in the investigation. And those are the more interesting examples. In retrospect, those issues were because we violated some known best practices with monitoring. And this happens. So what we want to do is go down to the specifics of those examples to better reinforce that it's a good idea to follow good practices in monitoring.
And, in general, monitoring is so important to testing in production. The little bit of mashup title that I used that Andrea was referring to, I really want to use that to invoke the idea that you really have to get your monitoring in place, before you do testing in production. If you're not doing monitoring, then you're not really testing, you're just hoping that things go right. John Hart also likes to talk about this idea of performance dark matter. When you're running a complex distributed system, like we do, there's a lot of performance dark matter that's just kind of hidden in the system. And it's only through best practices in monitoring that you can really shed light on that dark matter and figure out what's going on.
This slide here illustrates the problem that John was looking at. One of our customers, I'm going to refer to them as Acme Corp, just to protect the innocent, was facing bad query latency for certain class of their queries. And here in this graph, you can kind of see that. The blue line is the average latency for Acme Corps queries for this class of queries over time. The red line is for all customers other than Acme Corp. You can see that for Acme Corp, we had times where the latencies were picking over five, ten seconds. And for us, that's unacceptable. We really strive to make sure that 99% of our query ... customer's query latencies are answered in less than 1 second. For us, this is a challenging problem. We have some very large customers. This customer, in particular, sends us tens of terabytes of logged volume every day. We have hundreds of their engineers logging in every day, issuing queries in order to see what's going on in their system.
Now before I dive into the details of the best practices, I want to give a little bit of overview of our backend system, because it's going to give you a little bit of information to put the rest of the best practices in context. One of the fun things that we've done at Scalyr, is we've actually built our own no SQL database from scratch, that's optimized for this particular problem domain. And for us, this is one of our competitor advantages. It is what allows us to give orders of magnitude better performance than a lot of our other competitors. And, for our no SQL design, we followed a lot of the normal way that other no SQL databases are structured like Bigtable, Cassandra, that sort of thing.
For us, we take all of a particular account's data, which is essentially the logs coming in for that account and we break it up into small five minute chunks, which we refer to as Epochs. Each Epoch is assigned to a particular shard of servers in our system. And we sprinkle these Epochs for an account all across all of these Shards that we have in our infrastructure. To answer a query, we ... at the account master, receive the query from our customer. We ... the account master knows where all the Epochs are stored, what Shards are ... hold all the appropriate data. And the account master forwards the query to the appropriate Shards in order to execute the query on the appropriate Epochs. Now, in our world a basic Shard of servers has both masters and slaves. And a given query can be satisfied at either a master or a slave.
The right side of the diagram blows up the query engine of a particular slave or master. And, in here, you can see that there's a few block diagrams in the flow of executing a query. One of the first things that happens when a ... the server receives the query, is to do some admission control policies. So this is enforcing rate limits, in order to make sure customers aren't abusing our system, acquiring account blocks, that sort of thing. After the query passes admission control, then it gets farmed off to the query execution engine, the query execution engine essentially tries to execute the query over data in a RAM cache. In order to satisfy that query, often you have to pull in Epochs or the data blocks that make up Epochs into that RAM cache. So that's why you see us pulling in blocks off disk into the RAM cache.
Just to briefly talk about some of the things that did work well for our monitoring. First of all, we actually already have an A/B testing framework for our queries. On a per query basis, we can apply different execution strategies in order to experiment with effects of small modifications. We actually have this integrated with our logging, as well. So, very quickly, we can be able to analyze the difference of ... the effects of different execution strategies on query latencies. One of the other things that we do is we're very careful about how we run our experiments. John is a big believer on markdown files, so every time he starts up a new investigation, starts up a new markdown file along with a new dashboard. Everything that he does during the experiment, gets dumped in there. He uses our dashboards and our Scalyr command line interface extensively in order to populate information to that markdown file and to add results to the dashboard.
And finally, one of the other things that we have in our system, is the ability to modify the server configuration on the fly. So all these experiments that we're running, all these things that we're doing in order to test our strategies on our real users queries, we can adjust over time, through some simple updates.
Alright, let's talk about the more interesting points. The monitoring lessons that we essentially had to relearn. So the first lesson I want to talk about is the importance of consistency. And the other way I like to think about this lesson is that, there should be no surprises in how information is communicated. When you look for a piece of information, it should exist where you expect it to exist. It should exist in the form that you expect it to. And, the performance issue that really reinforced us for this, was the discovery of an RPC rate limit gate issue that we had. In our system, I kind of eluded to earlier, we have rate limits that are applied to all incoming queries to make sure that there's no abuse. We don't want to have too many queries from one particular customer executing on the query engine, because they're getting unfair advantage of the system then.
So, normally what happens is the gate keeps track of the number of current queries that are being executed per second. If it exceeds a certain threshold, then the gate will artificially block a given query in order to slow it down. Now, it turned out for Acme Corp, we were actually experiencing wait times of multiple seconds or more at the gate. And this was a big contributor to their latency. It was slowing them down. But, we didn't notice the issue that quickly, which is surprising because actually all the information that we needed was in the logs, we just didn't see it. Let's talk about why.
Essentially it boils down to multiple issues with consistency. First of all, we had inconsistency with how our metrics were laid out. We already did have a good model for reporting query latencies broken down by various sub components. We had a systematic way of reporting that. But for this feature, this RPC rate limit, it was not part of the query system. It was part of the RPC subsystem. So we actually reported it in a different way. And, when it came down to it, we were looking at the breakdown of the query latencies, we were just missing the fact that there was time stalled out while we were waiting for the gate.
Now, we actually did have the gate wait latency in the logs. In fact, John even thought to check it out. He had a long list of all the places where we could be missing performance. And he did some manual checks. He knew what he was looking for in the logs in order to check to see whether or not this was an issue or not. And he did some scans and saw numbers like four and five and he's like, "Oh, okay, four or five milliseconds, that's fine". That's not contributing to the multiple seconds that we're seeing.
But, the problem here was that latency was actually being reported in seconds and it was inconsistent with how we report most of our latencies. Everywhere else in the system, we report them in milliseconds. But here we were being misled by our results, because we were just inconsistent with units.
Okay. This is just kind of before and after actually. So John, after figuring this out, did some fixes to how we handle the gate and the red bars are essentially the counts or number of times that the waits at a gate are exceeded one second. That was before the fix. And the blue are the number of times we waited after the fix. So you can see there's a significant reduction.
The next lesson. The second lesson we learned. Essentially it boils down to what I like to describe as you have to analyze based on what matters. You have to have ... when you design your monitoring, you really have to think about what really matters in terms of the behavior of your system. Another way people talk about this is averages versus distributions. And I'll explain that more in a minute. The performance issue that reinforced this lesson was an issue we were having with our RAM block cache utilization. I mentioned earlier that in order to execute a query for a given Epoch, all the blocks for that Epoch have to be read into a RAM cache.
Well, it turned out that because of an odd interaction with how we decide what Epochs should be executed on what ... on the master versus the slave and how we had architected this structure of our RAM cache, we were only using half of the cache at the time. And essentially, just to give you a little more detail, our RAM cache was actually composed of numerous two gigabyte pools. And it turned out that if we had an odd number of RAM pools, then only the even RAM pools were being used on the masters and only the odd RAM pools were being used on the slaves. And it was just because of this odd interaction. And, but it resulted in the fact that we were effectively using only half of our RAM for RAM ... I'm sorry, half of our RAM for our cache. We had 50 gigabytes delivered to that cache, we were only using 25.
And so, why did it take so long for us to figure this out. It comes down to the fact that we were measuring the wrong thing. We had some metrics that we were looking at that would have uncovered this sooner. We had a dashboard that essentially talked about the cache fill rates. How many blocks were we inserting into the cache of the second? If there was a problem, if we weren't really utilizing the cache, this would have dropped to zero. And so we look at this graph. We look at the average of the cache fill rates across all the RAM pools. Everything looks fine, okay, we're inserting blocks at a pretty decent rate.
However, this graph tells a different story. And what this graph shows, is it's the graph fill rate for all the odd number RAM pools, that's the one in blue. And the even is in the red. You can see right there, that there's a huge difference between the fill rates for the even RAM pools and the odd RAM pools. And what this really gets down to, is what really matters? It doesn't matter that we're inserting blocks into the cache at a decent rate. What matters is that we're inserting blocks in for all the RAM pools. All the RAM pools were effectively having blocks added. And so this is where I get ... you get to the idea of averages of distributions. You can't take the average across something. You really, in some cases, have to look at the distributions where that matters.
Okay. After 20 hours of investigation, basically this boiled down to a single character fix for John. The easy fix was just actually changing the shared RAM pool count down from 26 to 25 to give an odd one. And so, in effect, it ended up reducing the total RAM that we're using for our cache, but actually resulted in more blocks being cached as anti-intuitive as that is. And that's it. Those are the lessons I wanted to go over.
If you want to learn more about our system, feel free to visit our blog. The obligatory, we're hiring. And that. So ...