Dashboards
Overview
This topic explains how to use the product analytics Dashboards tab, and what information that tab contains. The Dashboards tab shows you analytics and information for different types of activity. You can also use this tab to create new dashboards.
The Dashboards tab is where you can start performing deep analysis of your product data. You can create dashboards to track user behavior and other information, and you can see the dashboards created by other people in your organization.
The Dashboards tab
Click any existing dashboard to open it. You can also search by typing in the box to find a specific dashboard.
The Dashboards tab is displayed with multiple columns. They are:
- Dashboard name: The name of a specific dashboard.
- Last modified: Shows how recently the contents of this cohort changed.
- Created by: Shows who from your LaunchDarkly account created this dashboard.
Click the three-dot overflow menu to delete a dashboard.
Create a dashboard from charts and blocks
Create new dashboards from the Dashboard tab. Dashboards are comprised of charts. There are different types of charts:
- Trends: Let you track trends in event data over time.
- Funnels: Let you track how users progress through a series of events.
- Retention: Let you track how users stay or do not stay engaged with your product over time.
- Stickiness: Let you track if users repeat a specific action over time, which indicates which events bring users back to your product.
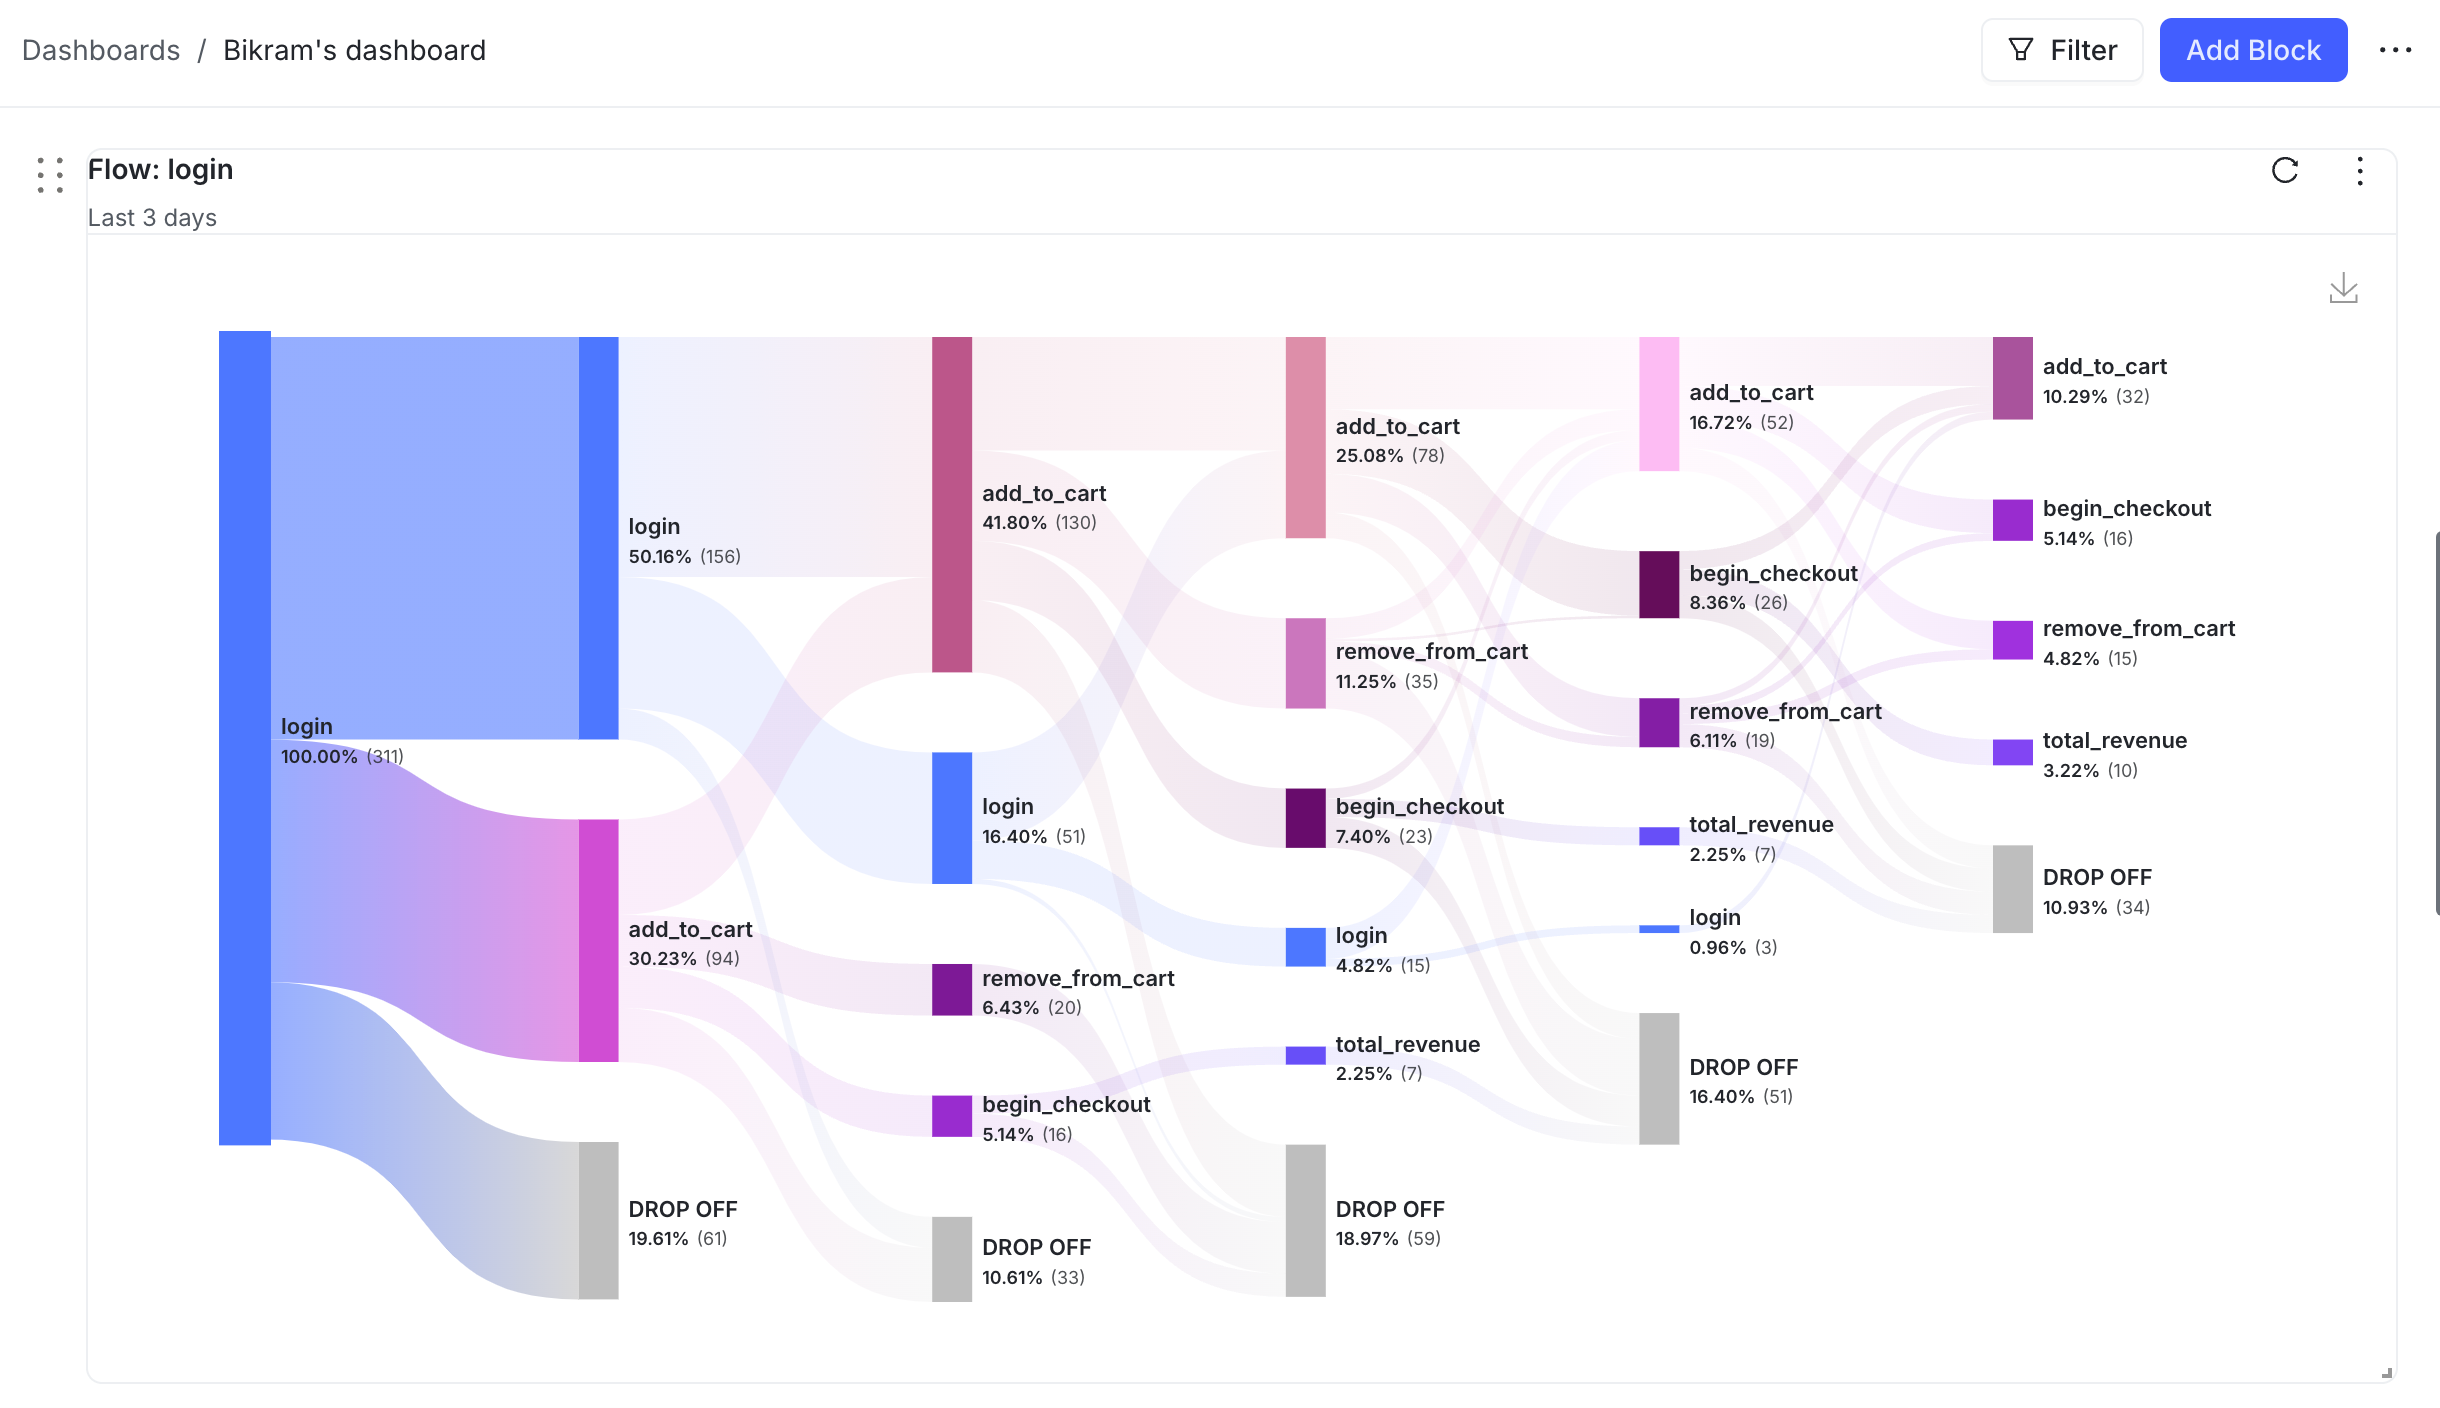
- Flows: Let you track the most common sequences of events your users perform.
You can also customize your dashboard’s UI by adding blocks of text, embedded content, or data from another dashboard.
The process for creating new dashboards varies based on which type of dashboard you want to create. Here’s how:
Trends
To create a dashboard with a trends chart:
- Click New dashboard. The “Untitled dashboard” page opens. Click the dashboard title to give it a unique name.
- Click Add block and choose the “Trends” type from the dropdown that appears. The “Events” configuration menu appears.
- Click in the “Events” search bar and choose an event to track. Optionally, update the “Calculation” type.
- Optionally, choose more events to track.
- In the “Breakdown” section, click the plus icon to expand menu options. Choose an event property to use for the breakdown.
- In the “Filters” section, click the plus icon to expand menu options. Choose a filter to apply to the data.
- Click Apply configuration. The new dashboard block appears.
Funnels
To create a dashboard with a funnels chart:
- Click New dashboard. The “Untitled dashboard” page opens. Click the dashboard title to give it a unique name.
- Click Add block and choose the “Funnels” type from the dropdown that appears. The “Events” configuration menu appears.
- Click in the “Events” search bar and choose an event to track. Optionally, choose more events to track.
- Optionally, update the “Conversion criteria”.
- In the “Counting” section, click to specify if you want to count Uniques or Total events.
- In the “Breakdown” section, click the plus icon to expand menu options. Choose an event property to use for the breakdown.
- In the “Filters” section, click the plus icon to expand menu options. Choose a filter to apply to the data.
- Click Apply configuration. The new dashboard block appears.
Retention
To create a dashboard with a retention chart:
- Click New dashboard. The “Untitled dashboard” page opens. Click the dashboard title to give it a unique name.
- Click Add block and choose the “Retention” type from the dropdown that appears. The “Events” configuration menu appears.
- Click in the “Starting event” and “Return event” search bars to choose events to track.
- In the “Breakdown” section, click the plus icon to expand menu options. Choose an event property to use for the breakdown.
- In the “Filters” section, click the plus icon to expand menu options. Choose a filter to apply to the data.
- Click Apply configuration. The new dashboard block appears.
Stickiness
To create a dashboard with a stickiness chart:
- Click New dashboard. The “Untitled dashboard” page opens. Click the dashboard title to give it a unique name.
- Click Add block and choose the “Stickiness” type from the dropdown that appears. The “Events” configuration menu appears.
- Click in the “Events” search bar and choose an event to track. Optionally, update the “Calculation” type.
- Optionally, choose more events to track.
- In the “Breakdown” section, click the plus icon to expand menu options. Choose an event property to use for the breakdown.
- In the “Filters” section, click the plus icon to expand menu options. Choose a filter to apply to the data.
- Click Apply configuration. The new dashboard block appears.
Flows
To create a dashboard with a flows chart:
- Click New dashboard. The “Untitled dashboard” page opens. Click the dashboard title to give it a unique name.
- Click Add block and choose the “Flows” type from the dropdown that appears. The “Events” configuration menu appears.
- Click in the “Events” search bar and choose an “Anchor event” to track. Optionally, specify how many steps before and steps after that event you want to track.
- Optionally, choose a “Goal event” to specify which events you want to see overall conversion for.
- Choose “Events of interest” to specify which events you want to measure that take place during the flow.
- Optionally, choose “Highlight events” to bring certain events to the top of the flow UI so you can track their performance.
- Optionally, set how many “Rows” of events you want to display.
- In the “Conversion criteria” menu, choose a period of time over which to track user activity in the flow.
- Optionally, click to expand the “Filters” menu and specify which criteria to include or exclude from the flow.
- Click Apply configuration. The new dashboard block appears.