
Key Takeaways
- ML experiment tracking spans four distinct concerns: experiment tracking at the run level, model tracking at the version level, data tracking at the input level, and prompt tracking for LLM systems.
- Prompt templates, tokenizer versions, and sampling settings (temperature, top_p, top_k, max_tokens, seed) are run inputs just like learning rate, so leaving them in application code removes them from the experiment record.
- Retraining is triggered three ways: on a schedule, by drift detection, or by manual experimentation, and the trigger type should be logged as a run parameter.
- Externalizing prompts and model parameters into versioned runtime configs lets an experiment run link to the exact config version served in production.
The vast majority of teams working on large language models (LLMs) and machine learning (ML) systems diligently track hyperparameters. However, very few keep track of all the components (e.g., prompt templates, tokenizer versions, fine-tuning configs, etc.) that enable models to work effectively in production. In part, this is due to the complexity of tracking in practice.
Logging a learning rate is simple. Logging prompt templates is more difficult. The template is stored as a string, a JIRA ticket, or a doc, and no one has developed the habit of logging them. Bugs that are created when these inputs deviate across the range between training and production are among the more insidious to locate.
If a model's performance degrades in production, the investigation begins anew, unless the original data snapshot, code commit, and evaluation criteria were saved as a single unit.
This article will help prepare you to address that problem by going deep into ML experiment tracking and how to close the loop from offline experiments to production. We'll explore the key elements of an ML experiment tracking system, the architecture that enables it at scale, common holes in teams' pipelines, and how runtime configuration management with LaunchDarkly AgentControl links the model and code validations from offline to production.
Summary of key ML experiment tracking concepts
ML experiment tracking involves both what is recorded for each experiment run and how it relates to the overall lifecycle of the machine learning process. It's difficult to tell which rows apply to offline record-keeping and which apply to online controls. The table below separates the two and summarizes elements that every training or evaluation run should capture.
Concept | Category | Description |
|---|---|---|
Parameters & Configs | Per-run configuration | Hyperparameters, seed, model configuration, prompt template, and sampling configuration were recorded for each run to ensure reproducibility and allow comparison of results. |
Metrics | Per-run configuration | Signal levels at the step and aggregated levels (loss curves, accuracy, latency, domain KPIs) are used to decide which model to select. The signal level tells whether training was stable; aggregation tells whether the result is good. |
Artifacts | Per-run configuration | Checkpoints, evaluation reports, dataset snapshots, and sample output per model run are saved to facilitate rollback and debugging. |
Code Version | Per-run configuration | SHA1 hash of the commit in Git associated with each run to know precisely what code state generated an artifact. |
Environment | Per-run configuration | Dependency version, CUDA driver version, and container image hash used to re-run the execution environment exactly as before. |
Data Lineage | Per-run configuration | Snapshot of the dataset, schema version, and feature transformation used to generate consistent training inputs. |
Resource Usage | Per-run configuration | Cost per GPU hour, per memory unit, and per other compute resource, per run. Very important for LLM fine-tuning or multistage pipelines. |
Registry Integration | Pipeline Integration | Mapping from an experiment execution run to the model entry with a version number and to its lifecycle phase (staging, shadow, production). |
Tracking Server | Pipeline Integration | Single source of truth for all executions. Should be able to manage concurrent writes, access controls, and be considered infrastructure with ownership. |
CI/CD Integration | Pipeline Integration | Training executions within CI automatically log in to the central server. Failed training executions are also logged, including partial metrics and stack traces. |
Feature Store | Pipeline Integration | Feature versions used during each training execution are captured with the execution. First line of defense against training-serving skew. |
Production Feedback Loop | Pipeline Integration | Production issues such as drift, latency degradation, and service-level objective (SLO) violations trigger triage and, when appropriate, a new training or evaluation run, forming a closed loop. |
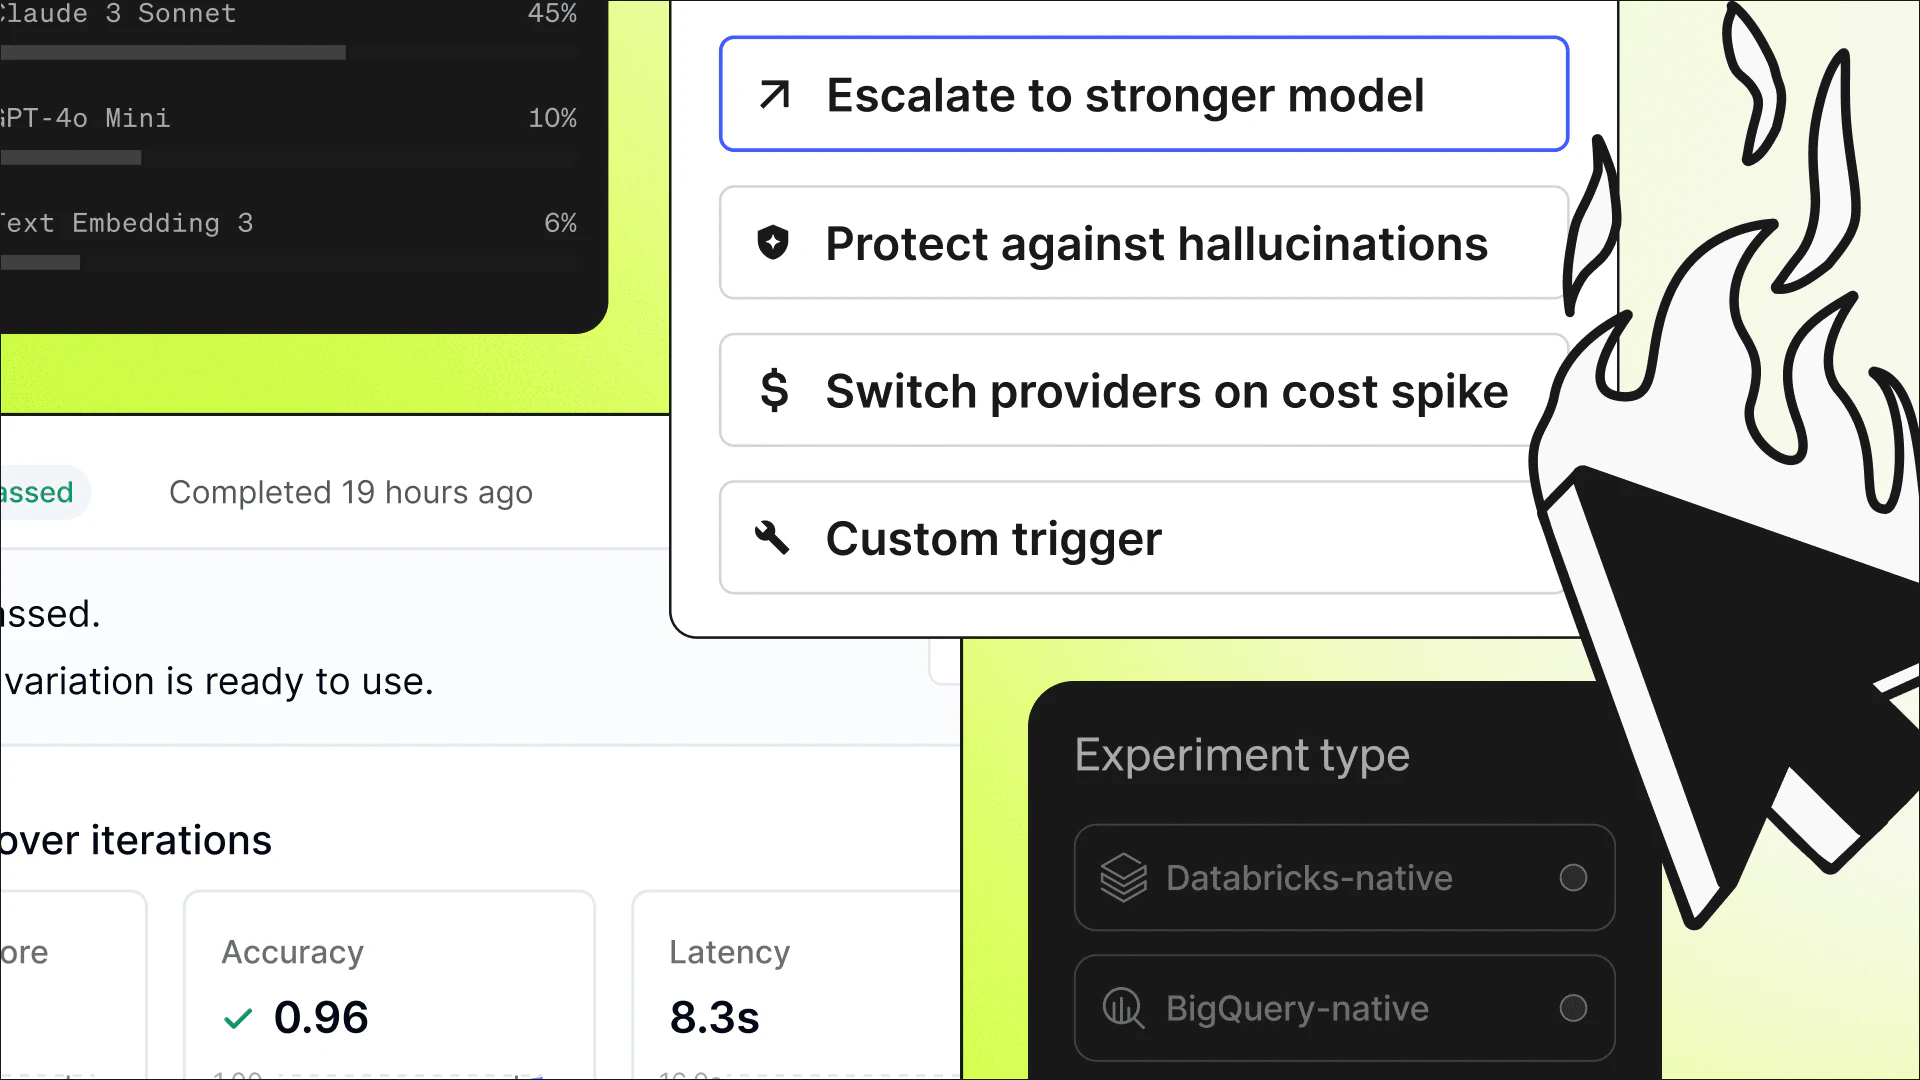
Rollouts | Runtime Control | Progressive exposure of a new variation to 1% → 100% of traffic by percentage or segment, with no redeployment. Each variation carries the full model spec (name, parameters, prompt, tools). |
Kill Switches | Runtime Control | Runtime mechanism to route requests to the previous stable model on detection of regression via monitoring, without redeploying. |
Online Experimentation | Runtime Control | Perform A/B testing on different versions of a model against live traffic to observe its effects on quality, latency, and cost. |
Prompt & Config Versioning | Runtime Control | Prompt messages, model selection, temperature, max_tokens, and tool definitions are versioned AgentControl configs outside the application code, enabling deployment-independent updates to LLM workflows. |
Understanding ML experiment tracking: Experiment tracking vs. model tracking vs. data tracking
Experiment tracking, model tracking, and data tracking are three concerns that are intertwined but occur at different points in the lifecycle. Teams need to understand these different tracking types, and conflating them can result in operational gaps and issues in production.
Experiment tracking is run-level. It tracks what was done during a training run: hyperparameters, performance metrics, artifacts produced, code state, environment, and data. The question is "what did we do, what did we get?"
Model tracking is version-level. It tracks which runs produced an artifact and which lifecycle stage a given model is in: staging, shadow, or production. The question is "which run was this deployment created from, and was it validated?"
Data tracking is input-level. It associates a run with a particular version of the data, schema, and preprocessing. The main question is "what did you train the model on?"
There's a fourth for LLMs specifically: prompt tracking. A prompt template is a structure of instructions paired with placeholders that are reused in an instruction that specifies how the model is instructed during inference time. It is similar to variable substitutions in that it is an input to the run along with model parameters, and like the learning rate, it is not stored in the run file. However, developers manipulate prompts in the user interface or coding and leave holes in the experiment record, making it difficult to understand what it was used to test. Like a feature store, AgentControl configs provide versioned configs for managing prompts and model parameters.
These four tracking types are interconnected. Without data lineage, the experiment record is untrustworthy. Without an experiment record that links to the registry, deployment audits can't occur. And without prompt tracking, the LLM experiment record doesn't start right. The diagram below shows which concern is linked to which lifecycle stage.

Core components of an ML experiment tracking system
The illustration below depicts how data inputs, configuration, code, and execution context contribute to the generation of an experiment record. A run goes through an evaluation gate before it is promoted to the model registry.
The evaluation gate is a set of checks that a run must pass before it can be promoted to the model registry; these might include accuracy thresholds, latency bounds, and fairness tests. It then streams to the production control plane.

Parameters and configurations
Record all variables that might give different results if they change. That includes all hyperparameters, optimizer settings, learning rates, batch sizes, preprocessing steps, random seeds, etc. The most common cause of "I can't reproduce this" is subtle default differences.
Explicitly pass parameters with a hierarchical configuration system like Hydra or OmegaConf, instead of relying on defaults. Compare runs using the parameter diff, not side-by-side configs. The difference is the signal; the whole config is context.
For LLMs, include prompt templates, model version, tokenizer version, and sampling parameters (e.g., temperature, top_p, top_k, max_tokens, and seed). Changing a prompt is a config change. Putting prompts in Python dicts or in the application code keeps them out of the experiment record and the deployment process, making it impossible to pin down evaluation results.
AgentControl configs
AgentControl configs externalize the prompt, model name, model parameters, and tool definitions into a versioned config that applications can pull at runtime. It's diffable and versioned, and experiment runs can be tied to the config version they used.
This distinction matters. If the prompt is revised in code and the experiment record refers to a previous version, the experiment result is no longer valid: the model was evaluated against a config that is no longer used in production. AgentControl configs solve this problem by externalizing the config, versioning it, and making it available to the training pipeline and the application.
Metrics
Track both step-level events and summaries. Step-level signals, such as batch loss, perplexity, and gradient norm, show whether training was stable. Aggregated summaries - accuracy, F1, latency, and domain KPIs show if the result is satisfactory. Neither is less important than the other.
Log training events. Early stops, NaN losses, and gradient explosions are all reasons a particular run's checkpoint may be bad. Without logging these events, it is impossible to investigate their occurrence.
The tool should be able to compare metrics across runs. If the tool is being used properly, then it should not be necessary to export the data to a spreadsheet and compare two runs.
The Python code below demonstrates how MLflow logs a run for a training or evaluation job with an LLM. The prompt template is tracked as a run parameter (since it is an input to the run, just like the learning rate), and a sample model output is logged as an artifact to aid debugging and comparison.
Artifacts
Save checkpoints, evaluation results, confusion matrices, and export embeddings - not only the checkpoint with the best result. Checkpoints are the main place to debug a model that has regressed in production.
Log the dataset hash with all artifacts. This allows the checkpoint to be served, but the training run that produced it cannot be repaired, which is essential when reproducing a training run weeks or months after a regression occurs.
In LLM training, adapter models (LoRA) and reward models (RLHF) can be several gigabytes in size. This needs to be supported by a scalable storage architecture with rules that differentiate between high-value checkpoints used in production and intermediate checkpoints commonly used for iterative development.
Code version, environment, and data lineage
Effective versioning and data lineage are essential for ML experiment tracking at scale. There are three key pillars teams should keep in mind to get it right.
Record the Git SHA for each run. The SHA is necessary to identify the code that produced the artifact if a bug is found in production months after deployment.
Record the environment. Examples of an environment record include a pip freeze output or a Conda environment file, the CUDA driver, the GPU, and even a Docker image digest. The same model can behave differently across environments, especially when the CUDA or framework version changes.
Record which snapshot of the dataset, the schema version, the version of the feature store, and the version of the preprocessing pipeline it used. How a filtering change will affect a model can't be known in advance. Teams can only determine this afterward if the version is recorded.
Resource usage and registry integration
Track the GPU usage, memory, time, and approximately how much a run costs. With LLM fine-tuning, cost is often a major constraint and should be captured from runs to prioritize what to scale up.
If the training run is promoted, it should be connected with the model registry. The link from a run to a production model version should be a look-up, not an inference after something goes wrong.
Teams should also document the reasons for promotion such as a range of acceptable accuracy, fairness tests, and acceptable latency. This practice proactively enables governance and auditability.
Architecture of an ML experiment tracking pipeline
A reliable ML experiment tracking pipeline requires a robust architecture. It sits alongside the MLOps pipeline that moves data through ingestion, feature engineering, training, and evaluation, recording what each stage produced. In the sections that follow, we’ll look at the four pillars of a reliable ML experiment tracking pipeline.
Tracking server and storage backends
The tracking server is the registry of metadata for all runs. It must be able to track parameters, metrics, artifacts, and lineage for each training job from local runs and CI jobs. It should also support many concurrent writes from distributed training jobs without overwrites or data loss.
Data is typically stored by type. Metrics are typically stored in a relational database because they need to be sliced by run, step, and metric key. Artifacts are stored in object stores like S3 or GCS. Environment and code are tracked as immutable references (Git SHAs and Docker Content Trust digests, instead of copies, keeping the record small and references authentic).
Consider the tracking server to be infrastructure, not an add-on. It needs access control, backups, and operational ownership. Research teams, platform teams, and production teams shouldn't all have the same permissions on the same store.
CI/CD integration and feature store
CI should automatically log training jobs. If a run is not logged in the tracking server, it did not occur. Not logging run calls in notebooks creates a visibility gap that teams cannot retroactively fill.
For example, a GitHub Actions workflow can invoke mlflow.start_run() at the beginning of each training job and automatically log the Git SHA, environment, and parameters. This creates a traceable experiment record for each merge to main without relying on engineers to remember manual logging steps.
You also need to record failed runs. The stack trace, partial metrics, and checkpoint failures help to contextualize the failures from a run. Failure is just as important to include as success.
The version of the feature store and the version of the prompt template are two sides of the same coin for training a model. They define the training and test data used to train and test the model. Both cause training-serving skew when they mismatch between the experiment and the product. Both should be logged by reference - as version IDs in external versioned stores, rather than directly into the run record.
This distinction is important: LaunchDarkly AgentControl configs are, in this regard, the prompt equivalent of a feature store. Just as a feature store records the version of a feature being used in training and serving to close the version gap, AgentControl configs record the version of a prompt being used in development and production to close the version gap. Logging the AgentControl config key and tracking token as parameters for training and evaluation runs means the run that tested the configuration can be traced back to the runtime configuration served in production. That trace is what most ML teams need when production behavior changes and they need to compare the validated run against the active config. That's the audit trail most ML teams see when things go wrong.
Production feedback loop
If there is any drift, latency degradation, or SLO violations in production, triage should be the first step. Retraining is one possible outcome, not a default one. It should be possible to specify the trigger type as a run parameter, creating a traceable record of the reason for initiating the run rather than reconstructing the decision after the fact.
In the case of LLMs, however, teams must handle prompt changes carefully. If prompt updates are treated like usual code changes, committing, reviewing, and deploying as part of the release cycle, it introduces latency and creates version gaps. Sometimes prompts are modified directly in the UI or during a live demo, bypassing version control entirely and leaving no trace of the model actually used in production.
To address this risk, teams should ensure prompts are retrieved from an external versioned store, and the version ID is logged as a parameter in every training and evaluation run. Changes may take effect immediately or go through an approval step first, depending on the workflow. In either case, the prompt tested offline and the prompt running in production remain traceable to one another.
This is handled by AgentControl configs at runtime, which serve the active prompt variation based on user context without any redeployment. Token usage, latency, and cost are tracked per variation and fed back into the monitoring loop that triggers triage and, when appropriate, a new training run.
The diagram below shows this as a cycle, not a sequence. Each stage passes information to the next, and production monitoring always closes back to the experiment tracking layer.

ML lifecycle loop: each stage feeds the next; production monitoring always closes back to Track.
Scheduled retrains, drift-triggered retrains, and manual experimentation
Retraining isn't always reactive. A typical team runs three types of triggers simultaneously:
- Scheduled retrains that run on a regular schedule, regardless of performance, keeping the model up-to-date with gradual drifts in distributions
- Drift-driven retraining that executes automatically when monitoring indicates a statistically significant change in the input distributions, confidence of predictions, or key business metrics crossing a threshold.
- Manual experimentation that can occur when engineers are testing a new model architecture, data set version, or prompt strategy.
All three trigger types result in a logged experiment run. The trigger type should be logged as a run parameter so users can see at a glance what triggered the run.
Closing the Loop with LaunchDarkly AgentControl configs
Experiment tracking determines whether the model is ready. AgentControl configs determine which users receive the approved model or prompt variation. These are two different considerations, and confusing the two results in pushing out an untested model or going through the entire deploy process whenever the prompt changes.
The chart below provides a complete visualization, including:
- The offline path from experiment tracking through evaluation to the registry
- The production path from AgentControl configs through progressive rollout, online experimentation, monitoring, and retraining
The registry handoff bridges the two paths and provides feedback from monitoring, initiating another run.

Progressive rollouts
Use the proven model for an AgentControl config deployment; begin with a small segment of the population, which is usually 1%, and observe quality, latency, and cost performance indicators before expanding. Each version includes all the model's attributes, such as the model name, model parameters, prompts, and tools. Gradually exposing more users is simply a configuration setting, not another deployment.
Targeted rollouts
The new version can be routed to a specific geographic location, user segment, or internal test group, while everyone else can use the existing stable version. In this way, the development team will have the opportunity to check its behavior on a controlled sample before rolling it out more broadly.
Runtime model switching
Since different variations of AgentControl configs contain the full model specification, changing models at runtime is a variation change rather than a code change. The app will fetch the current variation based on the user context, and whatever the variation contains is used in that specific request.
Kill switches
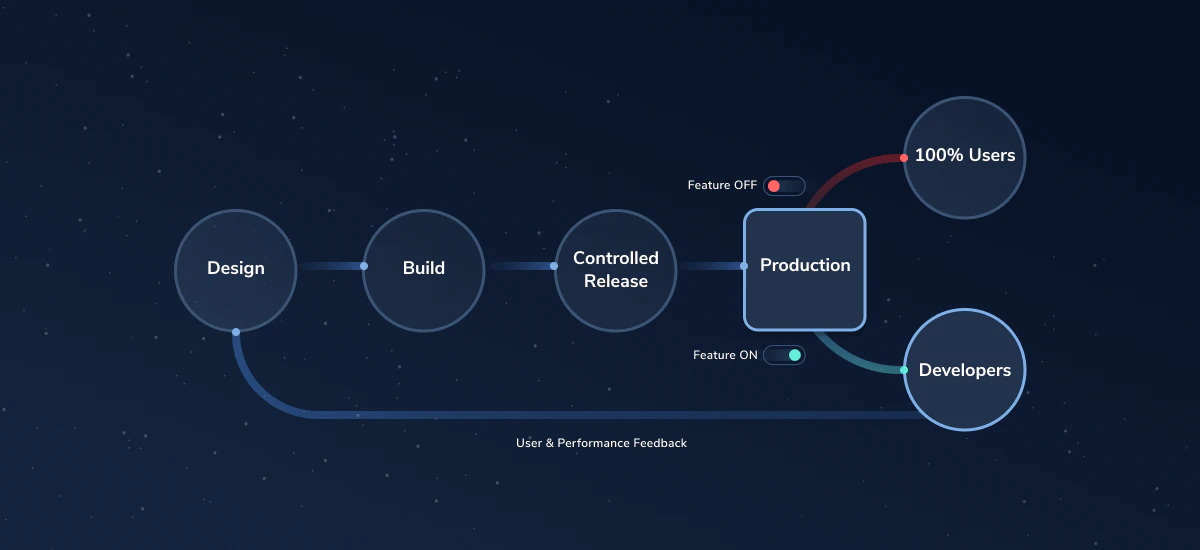
If production performance metrics are deteriorating, a kill switch can ensure the new model version is turned off immediately. After a kill switch is triggered, traffic will revert to the older stable version of the model without requiring redeployment or engineering support. In practice, this behavior is usually implemented through LaunchDarkly targeting or flag/config evaluation, so the application receives the stable variation without requiring a redeployment.
Online experimentation
Online experimentation uses techniques such as A/B tests to compare different model configurations or prompts against actual traffic to assess their performance in terms of quality, speed, and cost. Your AI SDK tracks token consumption, execution time, and success or failure for each model variation.
Code Example: Retrieving an AgentControl config
The following code snippet shows how to retrieve an AgentControl config in LaunchDarkly using the LDAIClient wrapper from the LaunchDarkly Python AI SDK (launchdarkly-server-sdk-ai).
Refer to the LaunchDarkly Python AI SDK documentation for full setup instructions and supported model integrations.
The last two MLflow parameters record the AgentControl config key and tracking token. Together, they link the offline validation run to the live AgentControl evaluation used in production, so teams can trace which runtime configuration was tested and which configuration was served.
Conclusion
Experiment tracking is more than metrics logging. It gives teams a traceable path from production behavior back to the run record, data snapshot, code version, model artifact, registry entry, and runtime configuration that produced it.
That trace is most valuable during production incidents. Instead of guessing which model, prompt, dataset, or configuration caused a regression, teams can inspect the validated run, compare it with the active runtime configuration, and decide whether to hold the rollout, roll back to a stable version, or start a new evaluation run.
Tools such as MLflow, Weights & Biases, model registries, and LaunchDarkly AgentControl configs each cover different parts of this lifecycle. The important practice is connecting them clearly: log prompts and model parameters as first-class run inputs, link experiment runs to registry entries, and connect validated configurations to production exposure decisions.
Teams that build this chain of custody can diagnose regressions faster and release model changes with more control. The real sign of ML and LLM maturity is not just a higher offline score; it is the ability to prove what was tested, know what users received, and recover safely when production behavior changes.