
A machine learning model that performs well on day one will not remain stable by default. Performance can degrade over time due to data drift, changes in user behavior, evolving feature sets, or updates to upstream systems. These changes rarely cause immediate failure, but they reduce reliability and make model behavior harder to understand.
The core issue is not model quality, but a lack of coordination across the lifecycle. Decisions made early in the lifecycle affect every stage that follows. When stages operate in isolation, traceability breaks down. For example, code versioning may capture model changes, but not dataset lineage, feature definitions, or runtime behavior.
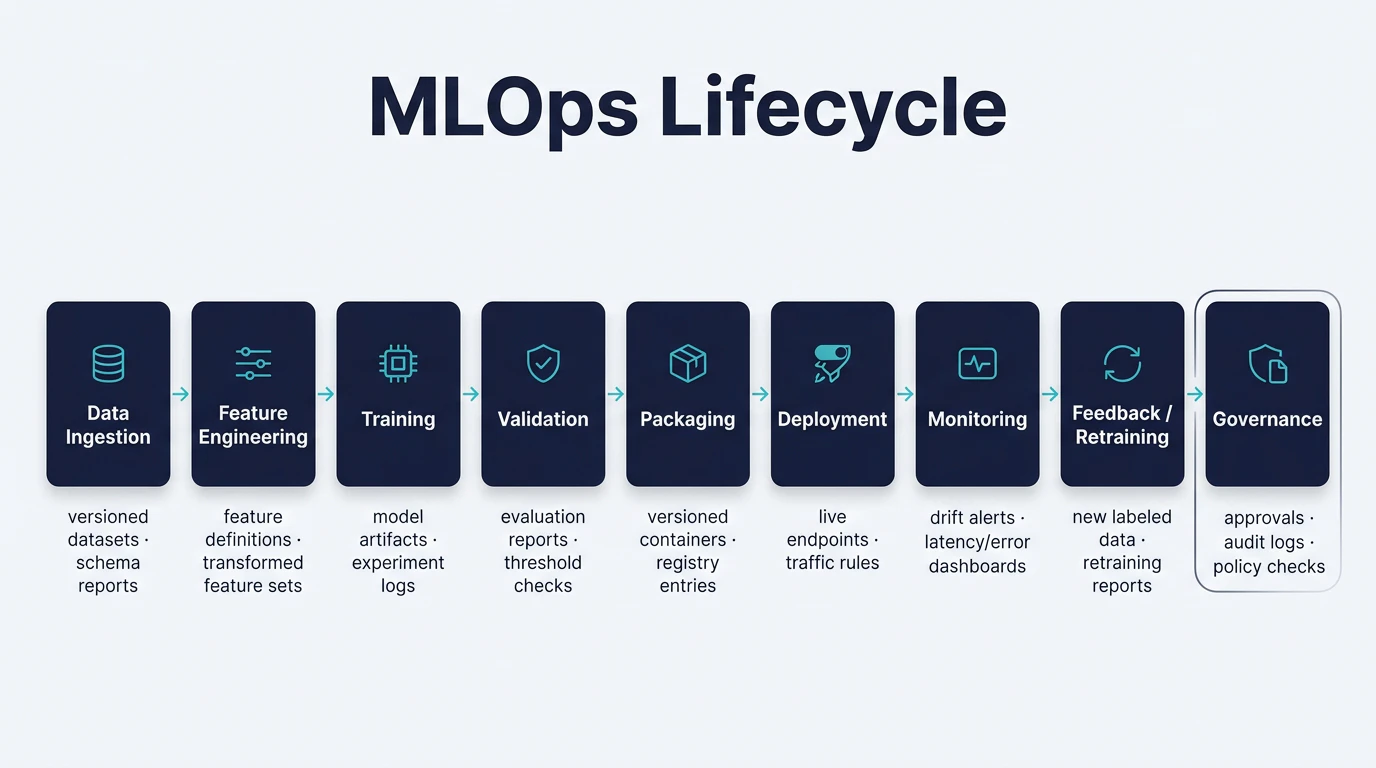
MLOps addresses this by treating machine learning as a continuous, end-to-end lifecycle. It connects data, features, training, deployment, monitoring, and governance into a single operating model. Each stage introduces its own assumptions and dependencies, from training and validation to deployment, monitoring, and governance.
Summary of key MLOps lifecycle concepts
Stage | Activities and Outputs |
|---|---|
Data Ingestion and Labeling | Collect raw data (logs, databases, APIs, and sensors), annotate or label it if necessary, and clean it. The output will be versioned datasets or snapshots. |
Feature Engineering | Take raw data and transform it into features (e.g., normalization, encoding, and aggregation) and register these features in a feature store. |
Model Training and Experimentation | Perform training jobs and hyperparameter tuning. The output of this stage will be trained model artifacts like weights and checkpoints. |
Validation and Testing | Test new models against holdout or test data. The output will be accuracy, loss, fairness metrics, and validation reports. |
Packaging and CI/CD | Package the model into a deployable artifact or container and push it to a model registry or a container registry. |
Deployment and Rollout | Deploy the model to production (REST endpoint, batch service, etc.). Manage traffic with canary releases and/or blue-green deployments. For LLM applications, Configs extends these capabilities to prompt versioning and model provider management |
Monitoring and Observability | Monitor system health: latency, error rates, etc. Monitor machine learning health, including elements like prediction quality and data drift. |
Feedback and Retraining | Collect new labeled data and initiate the process of retraining the model. Schedule retraining runs using the newly collected data. |
Governance and Approval | Conduct human-in-the-loop reviews and compliance checks before deploying the model. Maintain documentation of the models (e.g., model cards and data sheets), and implement automated policy checks. |
The following diagram shows how the major MLOps lifecycle stages connect in practice, from data ingestion through deployment, monitoring, and retraining, along with the operational outputs produced at each step.
Data ingestion and preparation
Data as a first-class production artifact
Most ML systems do not make data ingestion a control boundary, instead treating it as a background process. Initially, everything looks good, but then some issues creep in, such as missing columns, silent null propagation, schema changes, late arrival of upstream data, or unknown outliers. There is no catastrophic failure, just a gradual degradation of model performance, making it hard to debug and figure out exactly what the original data was used for.
Data ingestion should be a first-class citizen in the MLOps workflow. It’s essential to establish reproducibility, compliance, and reliability for models. Determinism and measurable data quality should be achieved.
Ingestion as a control layer
Data ingestion must be used to control the entry of all data being routed and validated. Data should be collected either in batches or streams before undergoing deterministic data cleansing transformations/processing. Before any data is saved, it is required that the schema requirements be validated. In addition, at each point in time that data is ingested, a snapshot or version will be created for future reference. Data lineages and quality metrics will be recorded at every point along the route through which the data is processed, so if there is an issue with validation, all training on that data will stop completely.
In MLOps, one of the key operational choices relates to whether a system should be fail-closed or fail-open. Fail-closed systems cease processing as soon as an anomaly is detected, maximizing safety; fail-open systems will continue to process with fallback logic, maximizing availability. The decision to implement either option should consider business risk, not the default implementation.
The pseudocode below shows a simplified ingestion control flow: load raw data, validate its schema, apply deterministic transformations, measure drift, and then store the resulting dataset version and metadata for downstream training.
For high-risk ML workflows such as regulated decisions, fraud detection, or safety-sensitive systems, ingestion pipelines should usually fail closed. In lower-risk cases, teams may choose fail-open behavior with explicit fallback logic, but that should be a conscious business decision rather than an implicit default.
Deterministic validation signals
Deterministic validation means data checks that always produce the same pass/fail outcome for the same data based on predefined rules. If a required column disappears, a null rate exceeds an allowed threshold, or a distribution shift crosses a defined limit, the pipeline should respond predictably every time. These checks are often the first reliable sign of upstream data problems, such as schema changes, silent null propagation, or newly introduced categorical values.
In addition to checking for whether the respective columns exist or not, validating data effectively should include the following aspects:
- Determining null counts and validating other attribute values
- Validating that attribute values fall into the correct range
- Limiting the number of categories available for categorical attributes
- Measuring distributional shifts in an attribute through either a PSI or KS test
- Measuring the number of duplicate records before any data goes into your model at all
Operational validation heuristics
In practice, ingestion validation is implemented as a set of operational heuristics that help teams interpret failures quickly. The signal itself matters, but so does what it usually implies operationally, because that determines whether the right response is to stop the pipeline, investigate upstream systems, or trigger a fallback path.
Signal | Interpretation |
|---|---|
Missing required column | Usually indicates that an upstream schema or API contract changed and downstream transformations may no longer be valid |
Null rate > threshold | Often suggests corrupted source records, partial extraction failures, or broken joins in the upstream pipeline |
Distribution drift > threshold | May indicate a change in user behavior, source population, collection logic, or rollout conditions |
High duplicate rate | Often points to replayed ingestion jobs, duplicate event delivery, or broken deduplication logic |
Unseen categories | Can break encoders or produce invalid feature mappings if serving logic was built against a fixed category set |
Data versioning and lineage
Having immutable dataset snapshots is critically important to ensure reproducible results. To allow for reproducible training runs, each training run must reference the dataset version ID, schema hash, transformation configuration, and associated quality metrics. Without versioning, any retraining will end up being non-deterministic.
In regulated environments, ingestion needs to automatically enforce PII masking, field-level anonymization, and retention tagging. These controls should be enforced automatically as part of the ingestion pipeline rather than handled through ad hoc manual review because manual compliance steps are hard to audit and easy to bypass under delivery pressure.
Configuration and feature flag controls
In mature ML systems, ingestion rules should be controlled through external configuration rather than hard-coded into pipeline logic. This allows teams to adjust schema strictness, null-handling rules, drift thresholds, and anonymization behavior without redeploying the pipeline. The YAML below shows one way to define those ingestion policies declaratively.
Feature flags can control behaviors such as strict schema validation, drift blocking, and auto-anonymization. This enables the gradual introduction of more stringent validation, and rollback in an instant should the rules block out production.
Ingestion-level operating metrics
The ingestion stage should expose a small set of operating metrics so teams can tell whether data is arriving on time, passing validation, and staying within expected quality bounds. These are stage-specific signals used to manage data intake, not a replacement for the broader production monitoring discussed later in the article.
Data intake needs to be measurable.
Key metrics:
- Batch success rate
- Ingestion latency
- Drift score per batch
- Null rate per critical feature
- Rejected batch percentage
- Schema violation count
Because ingestion is the first control boundary in the lifecycle, failures and drift detected here often surface before model-level symptoms appear in production. When ingestion is declarative, versioned, validated, and measurable, downstream training and deployment become far more reproducible.
Outputs
- Versioned dataset snapshots
- Validation reports and schema versions
- Recorded data quality metrics
- Metadata required for reproducibility
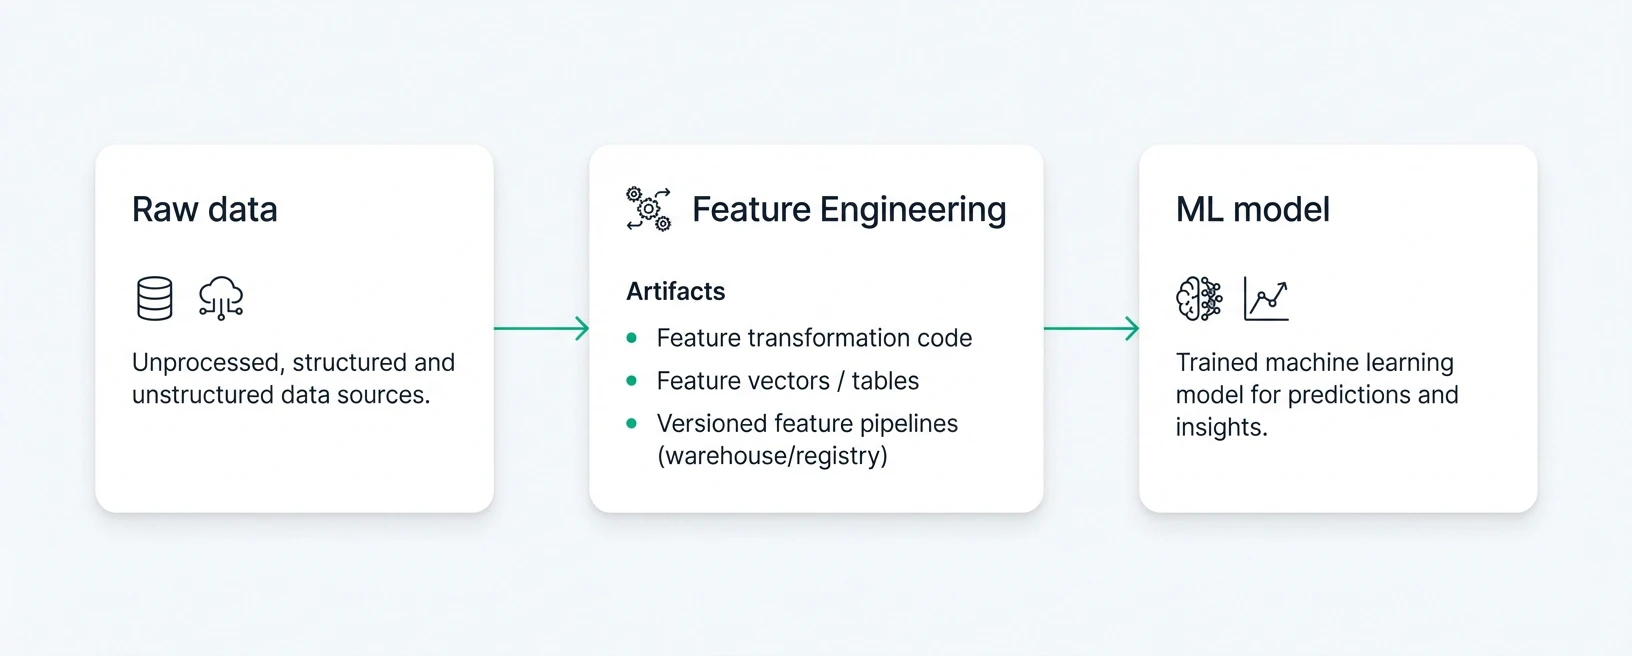
Feature engineering
Feature engineering is the lifecycle stage where raw, validated data is converted into the model inputs used during training and inference. In MLOps, this stage matters because feature definitions must remain consistent across offline training and online serving. If the transformation logic differs between those environments, the model may behave well in evaluation but degrade in production due to training-serving skew.
Defining the feature contract before transformation
With robust ML systems, feature definitions serve as the single source of truth; the transformation code simply implements them. The use of a feature-first approach helps make transformations deterministic (the same across training and serving), reducing the risk of training-serving skew. This consistency must extend across both offline feature stores (used for training and backtesting) and online feature stores (used for real-time inference). Aligning these environments helps prevent silent feature drift, invalid values, or data corruption in production.
Deterministic feature transformations
Feature transformations should be deterministic: The same input should produce the same output when the same feature definition and configuration are applied. This is what allows training, backtesting, and live inference to remain aligned. Tools such as Pandas, Spark, or feature platforms such as Feast can be used to implement that logic.
Unit tests and train-serving consistency
Unit tests help verify both transformation correctness and train-serving consistency. In practice, that means confirming that the same feature logic used during training is also used when live requests are processed in production.
Ensure that the same transformation logic is applied during both training and serving to prevent training-serving skew. Automate feature value validation before training, which can include range and null checks.
Monitoring feature distributions
Teams usually encode feature-level validation rules separately from transformation code so they can check whether important features remain within expected bounds over time. The example below shows a simple configuration for monitoring a few feature ranges.
Feature registry and versioning
Store feature definitions and pipelines in a feature registry to ensure consistency.
Use Git or a feature registry to track all changes. Versioned feature pipelines support reproducibility across both training and production.
Outputs
- Feature transformation pipelines
- Generated feature tables or vectors
- Versioned feature definitions in a registry
Model training and experimentation
Once feature sets are available, the next stage is to train candidate models and record the context needed to reproduce and compare those runs later.
Careful automation of training and experiment tracking helps improve reproducibility, consistency, and the ability to compare different models with each other at different times.
Automating model training
Whenever possible, the training process should be automated. This includes scheduling regular training runs, running hyperparameter sweeps, and retraining models when new data becomes available. Automated pipelines save time and reduce human error, especially when managing multiple models or experimenting with different parameters.
Tracking experiments
Every model training run should be tracked to ensure reproducibility and facilitate later comparisons. This means logging the hyperparameters used (such as learning rate and number of trees), dataset snapshots, code versions, and training and validation metrics.
For example, this can be done using MLflow in Python:
This method tracks all of an experiment, and you can repeat the model or compare it with any other run later.
Controls and best practices
To prevent problems during training, configure an early stopping rule and define a limit for the total number of training epochs to avoid excessive amounts of training (runaway training). In addition, you should perform integration tests after loading your trained model using sample inputs as input data for your trained model. Each of your trained models needs to be saved as versioned artifacts in your chosen artifact service (S3 or MLflow model registry). Finally, seed random number generators to ensure deterministic training and make sure to log the seed. Following these practices helps maintain consistency, reproducibility, and reliability across training runs.
Outputs
- Trained model artifacts (pickle, ONNX, TensorFlow SavedModel)
- Training logs and experiment metadata
- Hyperparameter and dataset configuration snapshots
Validation, testing, and evaluation
Model evaluation starts with the offline assessments of models using a hold-out test dataset. In this stage, the performance of the model will be measured using task-appropriate measures for the task. For example, for a classification task, the measures may be accuracy, precision, recall, F1 score, ROC curve, and confusion matrix; for a regression task, the best measures are RMSE, MAE, or R². It is also necessary to evaluate any domain-specific business metric (like conversion lift, cost of errors, or revenue impact) that will ensure that the deployed model will provide value to the business, in addition to the model’s statistical performance.
While the offline assessment of a model provides important guidance for deploying a model, an automated check that is used to check a model against any predetermined value—such as a threshold of performance or one that meets the record baseline level of performance—will be part of the gated validation before promotion. The checks will validate any fairness or bias issues along with validating through unit testing that known inputs will return known outputs. If a required threshold is violated, the pipeline will fail, preventing the model from being promoted to production.
To maintain reliability, automate checks that compare metrics against defined thresholds or baselines. For example, the pipeline should fail if a model’s accuracy falls below the previous version. The pipeline should also fail if a fairness metric for a protected group is violated. Include unit tests to confirm that the model produces correct predictions on known inputs. Only models that pass all these validation checks should advance to deployment.
Outputs
- Validation reports and evaluation metrics
- Metric visualizations (confusion matrices, ROC curves)
- Automated test logs and validation summaries
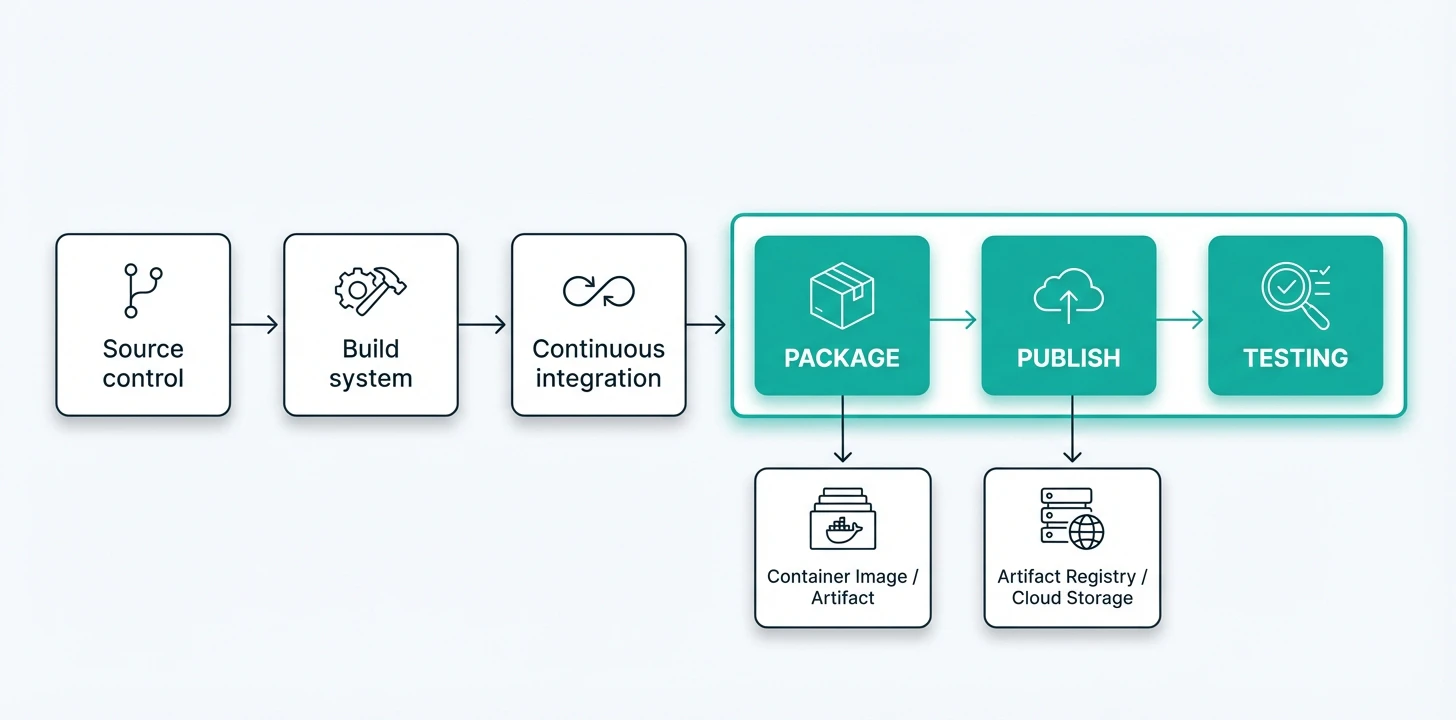
Packaging and CI/CD
Once a machine learning model is validated, it should be packaged for deployment. This usually includes creating a container image (Docker image) that includes the model and all code required to execute it. You can upload your model to a managed service like MLflow or Amazon S3.
Packaging is about more than just reproducing something; it is also about controlling its promotion. When a model artifact has been validated, it should have proper versioning, registry storage, and associated promotion paths (like staging and production) supported by defined approval and traceability workflows. The purpose of packaging is to ensure that the deployable unit is exactly the one that was validated, with its runtime dependencies, metadata, and configuration captured in a controlled and versioned form. When following the promotion path, you lower the risk of an unsuccessful release and make rolling back to a previous version an easier process if a problem does occur.
If you're using a continuous integration / continuous deployment (CI/CD) system like Jenkins, GitHub (Actions), or Azure DevOps, the deployment can usually be automated through the CI/CD pipeline. Typical steps involve retrieving the model from its storage location, building the Docker container image, running basic tests, and pushing the image of the model to a registry. Each image should contain a version number (tag) defined to identify what version of the model was deployed.
To maintain safety and reliability, the CI/CD pipeline should run automated checks, including code validation, test requests to the container, and Docker image security scans. Always use fixed version tags rather than “latest” to avoid accidental overwrites. If any test fails, the pipeline should stop immediately to prevent a faulty model from being deployed.
Proper packaging combined with automated CI/CD makes model deployment easier, safer, and more consistent.
Deployment and runtime controls
Deployment is the stage where a validated model is exposed to production traffic through an endpoint, batch workflow, or embedded application path. The operational goal is not just to make the model reachable but to release it in a way that limits user risk, supports rollback, and preserves observability during change.
One common runtime control is a feature flag, which is a configurable switch that changes application behavior without requiring a redeploy. In ML systems, feature flags can be used to route users between model versions, limit exposure to selected cohorts, or revert quickly to a known-safe model when problems appear. Tools such as LaunchDarkly provide this kind of runtime control.
Deployment strategies are designed to minimize the exposure of new models, whereas guardrails are designed to minimize risk. You can also have control over the users who will see the new model by using the feature flags found in tools like LaunchDarkly. One way to implement feature flags is by wrapping your inference code with a toggle that will allow you to either use the new model or fallback to the old model:
This approach supports gradual rollouts; you can start by directing a small percentage of real traffic to the new model and increasing exposure only if metrics remain strong.
Always have a rollback plan. Monitor the Canary release closely, and if errors rise or latency spikes, revert the feature flag and redeploy the previous model.
To maintain reliability, track latency and error rates for unusual patterns. Conduct integration tests in a staging environment before promoting a model to production. Log every deployment event, and to prevent user impact, trigger alerts or automated rollbacks if any service-level agreements (SLAs) are breached.
Outputs
- Running model endpoints (Kubernetes deployments or cloud inference services)
- Feature flag configurations controlling rollout
- Traffic routing and rollout policies
Monitoring and observability
Unlike the ingestion-level operating metrics discussed earlier, this stage focuses on production-wide monitoring of the live ML system after deployment, including both infrastructure behavior and model behavior under real traffic.
Once a model is deployed in production, it’s essential to continuously monitor both the system and the model, which allows for early detection of issues and ensures that the model continues to perform as expected.
Observing system and model metrics
Monitoring should include both infrastructure and model metrics.
Infrastructure metrics monitor the system’s health and performance. Here are some examples.
Metric | Purpose |
|---|---|
CPU and GPU usage | Ensure that compute resources are not overloaded |
Memory consumption | Avoid memory bottlenecks that could slow down inference |
Throughput | Track the number of requests the system handles per second |
Latency | Monitor response times to maintain consistent performance |
Model metrics track the model’s performance in production.
Metric | Purpose |
|---|---|
Prediction distributions | Detect unusual patterns or shifts in model outputs |
Live accuracy | Measure accuracy on recently labeled data to catch performance drops |
Error rates | Monitor mispredictions or failures to quickly identify anomalies |
Comparing these metrics against training baselines helps you detect data drift. For example, changes in input feature distributions can be measured using KL divergence or the population stability index.
Concept drift should also be tracked; this occurs when a model’s performance declines over time without code changes. Unexpected shifts in feature correlations or drops in model quality are strong indicators that something in the data or environment has changed.
Real-time dashboards and alerts
A key tool for monitoring is a real-time dashboard that displays prediction histograms, feature drift charts, and alert counts. Dashboards facilitate quick problem detection as they arise, providing automated alerts when thresholds have been exceeded and sending alerts (via email or text) for different levels of severity, for example, when there is a sudden shift in the behavior of a feature or a significant decrease in an expected value will trigger an alert. Alerts may have multiple levels of severity; minor drifts may generate a helpdesk ticket, while major anomalies will generate page-outs to the on-call technician.
Explainability and logging
For business-critical models, using explainability tools can help users understand predictions and investigate why a model may be failing or drifting. All logs and metrics should be preserved and correlated, ideally within dashboards or monitoring systems, so that any issue can be quickly traced, diagnosed, and made actionable.
Feedback loop and retraining
A well-developed machine learning system continues to evolve after deployment. Production usage generates feedback in the form of new data, user corrections, and observed model performance, which can be used to retrain and improve the model over time. Examples of the type of feedback received would be adjustments made by users through corrections, newly added labeled examples for retraining, or any additional incoming data that the machine-learning model has learned through actual usage over time.
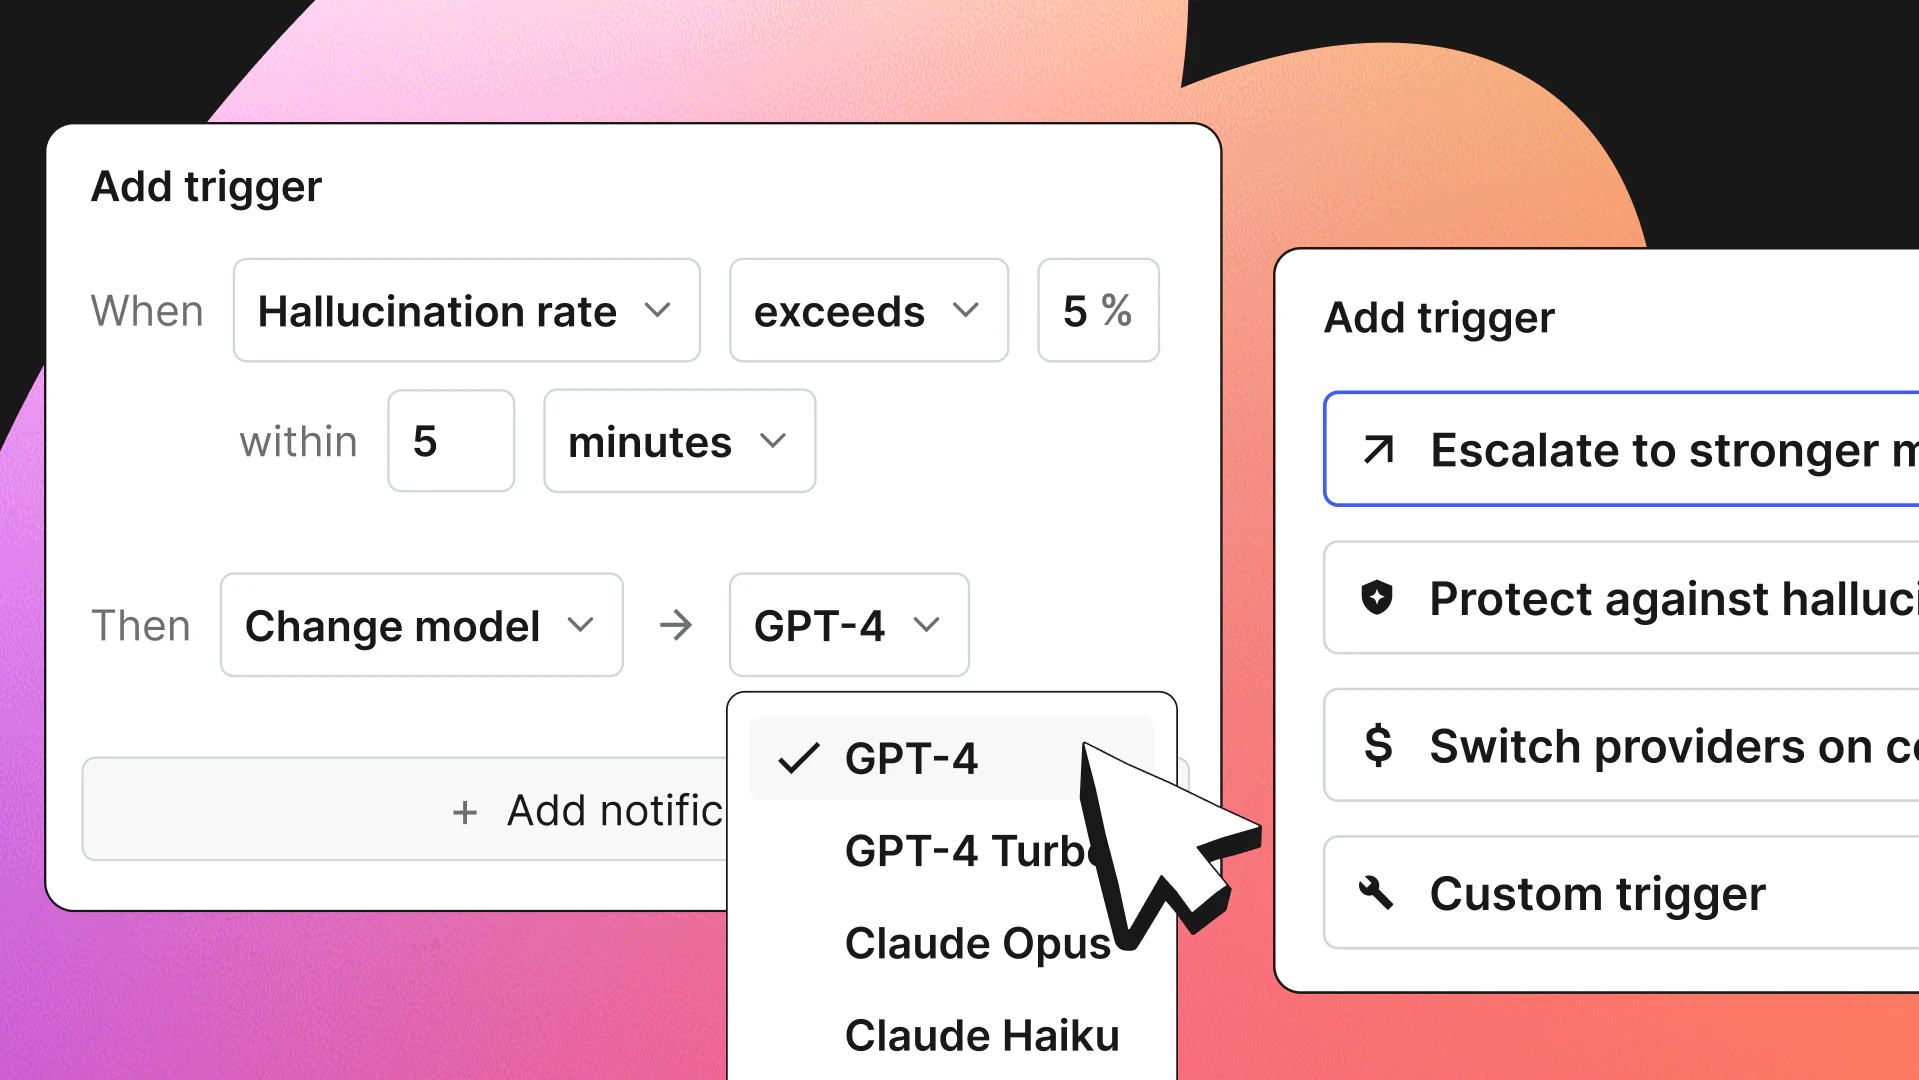
There are numerous options for initiating retraining for your model. A good example is that some teams utilize a scheduled approach, which may be to retrain their model every month. Another example is an automated trigger for any deviations of the data exceeding an established threshold or when the model’s performance levels drop below acceptable levels.
Once you have triggered the retraining, the same data processing pathway that was used originally to develop the original model should be utilized with the newly input data: Develop a new model, conduct an extensive amount of validation on the new model, and finally, deploy the new model to replace the original model only if it passes all of the relevant validation. Finally, before any model replacement, always conduct a model comparison between your new model and the existing model by utilizing a common form of data to conduct that comparison.
All retraining activities should be carefully documented, including the dataset version, model configuration, and performance metrics. This helps ensure full traceability and reproducibility.
Controlled retraining workflow
Retraining should be triggered by explicit conditions, such as scheduled cadence, measured drift, or degraded production performance, and each run should record the dataset version, feature set version, model configuration, evaluation results, and release decision. Before fully switching to a new model, deploy it in “shadow mode.” In this setup, both the old and new models run side by side on the same inputs, and their outputs are compared without impacting real users. This helps you identify unexpected differences early.
Business metrics should also be evaluated. For example, a small A/B test can confirm whether the new model improves conversion rates, reduces errors, or lowers operational costs. If the new model performs worse than the current one, immediately revert to the old model and investigate the issue. Deployment should not proceed if performance declines.
All retraining cycles should be recorded clearly with the following information added: what information changed, reason for the retraining, how improvements were noted, and who authorized the release. Maintaining this record of all cycles allows for greater transparency and makes audits easier.
Each retraining cycle produces important outputs, including updated training datasets, newly trained model artifacts, and retraining and evaluation reports. All of these artifacts should be securely stored and versioned so they can be reviewed, audited, or reproduced in the future.
Closed-loop learning
A well-integrated feedback loop links all the processes of monitoring, validating, deploying, and retraining together. This way, if a negative trend occurs or a deviation from expected performance occurs, retrieval of data can be triggered automatically. Once your retrieval data has been processed and altered based on collecting the recent data, the changed/new retrieval models can replace your existing deployed retrieval models with confidence.
Output
- Updated training datasets
- Newly trained model artifacts
- Retraining and evaluation reports
Governance and approval
When machine learning systems operate at scale, governance becomes essential. It is not enough for a model to function correctly from a technical standpoint; it must also be reviewed, documented, and formally approved before reaching users.
Strong governance frameworks establish a clear delineation of role expectations. An example could be a data scientist developing/training a model while an ML engineer is responsible for deploying the model. A governance/compliance officer will check documentation and approve the release of the model. After passing technical testing, models must complete formal review processes that include reviewing the model card, data documentation, bias analysis, and performance reports before receiving final approval.
Many organizations separate their environments into development, testing, and production. Models are promoted step by step, with each stage requiring sign-off from the appropriate team. This structured process helps ensure that no model reaches production without proper oversight and review.
Policy and compliance controls
Governance should not depend solely on manual reviews. Wherever possible, it should be reinforced through automation.
Policy as code involves defining governance rules directly in code. For example, the pipeline can automatically verify that the model card includes all required fields, performance metrics meet predefined thresholds, and bias evaluations have been completed.
The following YAML snippet defines policies for a model.
If any of these requirements are not satisfied, the pipeline should fail automatically.
All approvals and deployments must be recorded in an audit log. Model artifacts should be securely stored and protected with signatures or checksums to prevent tampering. In regulated environments, compliance reviews must occur before a model is allowed to serve real users. Only models that pass every governance check should be permitted to reach end users.
Outputs
- Model approval records
- Audit logs of model releases
- Governance and compliance reports
How LaunchDarkly supports the MLOps lifecycle
LaunchDarkly can act as a runtime control plane for MLOps, helping to enable safer releases, faster iteration, and measurable improvements in production. Its capabilities map directly to several lifecycle stages covered in this article.
A key practice in ML systems is the separation between deployment and release. With LaunchDarkly, teams can ship models or prompt changes behind feature flags and only release them when confidence is established. This means a new model version can be deployed to production infrastructure without any user seeing it until the flag is toggled on.
For safe model rollouts, LaunchDarkly supports progressive delivery and canary releases. It allows teams to expose a new model version to as little as 1% of traffic and scale up gradually to 100%. Rollouts can also be targeted to specific cohorts such as internal users, particular regions, or individual tenants, giving teams fine-grained control over who experiences the new behavior.
Feature flags enable the dynamic control of ML functionality at runtime. A single flag can switch between Model A and Model B without the need for redeployment, and it can provide the ability to revert to an earlier version when issues arise. Furthermore, multivariate flags allow teams to live-tune various parameters (e.g., confidence thresholds, temperature settings, top-p settings, and scoring cutoffs) without having to change code.
The ability to quickly roll back is crucial for minimizing potential risk when something goes wrong. LaunchDarkly includes kill switches, which are ways to stop providing access to a risky model or prompt immediately and without the need to redeploy. This capability can be extremely important during time-critical incidents.
For online experimentation, LaunchDarkly supports A/B testing on real production traffic. Teams can compare model or prompt variants and measure their impact on quality metrics, latency, and cost before committing to a full rollout. The example below walks through this in detail.
For GenAI and LLM applications, LaunchDarkly offers Configs, which manage prompts, model selection, temperature, and other parameters as versioned configurations. Configs provide:
- Prompt and model updates without redeployment
- Built-in metrics tracking (tokens, latency, cost per variation)
- Online Evaluations for automated quality scoring
- Variable substitution for dynamic prompts (`{{user_tier}}`, `{{context}}`)
To learn more, read the AgentControl documentation. Prompt and model updates can be rolled out progressively and safely, just like any other feature change.
Guardrails and governance are also built in. Guarded rollouts will automatically pause or roll back changes when monitored metrics regress. There is also an option for approval workflows, role-based access control, and audit logging. These capabilities can support compliance and traceability practices often required by regulated environments.
Example: A/B testing ML models with LaunchDarkly
The following example demonstrates how LaunchDarkly feature flags can be used to A/B test two ML model versions during deployment. A string-type feature flag named model-version is created with two variations (model-a and model-b) and a 50%/50% rollout. Each incoming inference request is routed to one of two models based on the flag evaluation for that user.
In the LaunchDarkly dashboard, create a feature flag with the following configurations:
- Name: model-version
- Flag type: string
- Variation 1: model-a (Logistic Regression)
- Variation 2: model-b (Random Forest)
- Default rule: 50%/50% rollout
Both models are trained on the same dataset (Iris), so the only variable in the A/B test is the model architecture. The code is shown below.
For each incoming request, the LaunchDarkly SDK evaluates the flag and returns the assigned variant. The application routes the request to the corresponding model, as shown below.
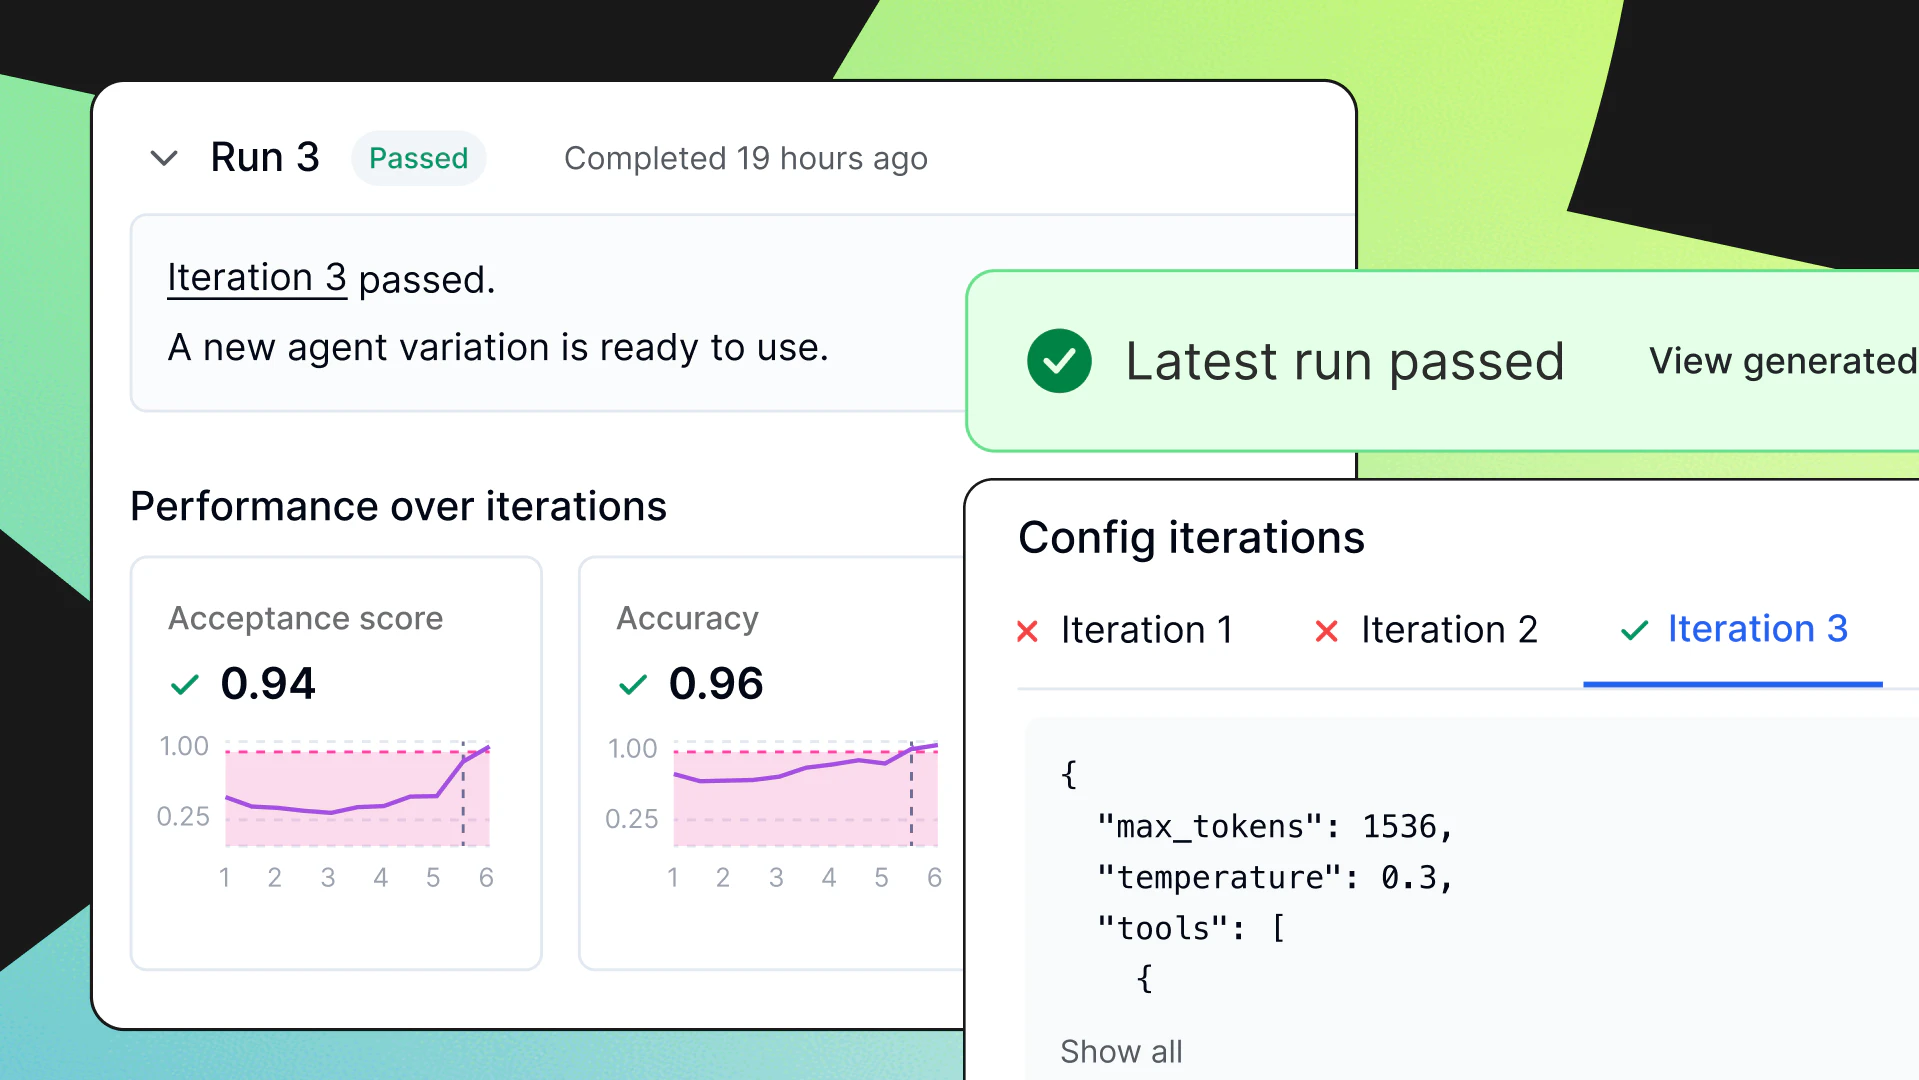
After simulating 200 inference requests split across both variants, you can compare accuracy and latency to determine which model to promote.
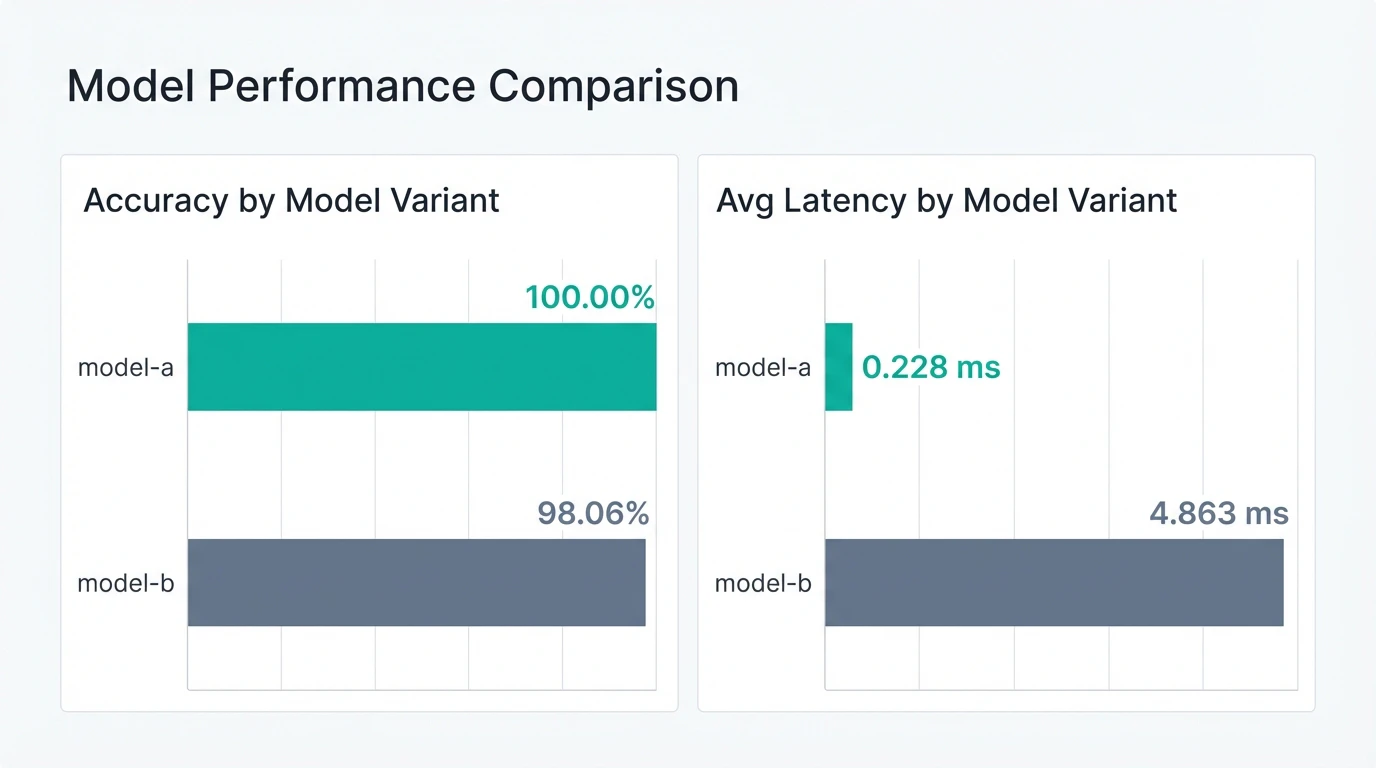
After routing requests between variants, you need to aggregate the resulting outcomes so the two models can be compared on shared evaluation metrics such as accuracy and latency. To analyze A/B test results, navigate to the experiment's Results tab in LaunchDarkly. The Results tab provides:
- Visualization options: Probability density, relative difference, and arm averages graphs
- Statistical analysis: Probability to be best, expected loss, and confidence intervals
- Filtering: Slice results by metric, variation, or user attributes
- PDF export: Download results for stakeholder review
Based on the results, an automated decision-making process determines whether the challenger should replace the baseline. If Model B outperforms Model A by a defined threshold, the flag default rule is updated to serve Model B to all users. If it underperforms, traffic stays on Model A.
LaunchDarkly Guarded Rollouts automate this decision-making. Configure a metric threshold (e.g., accuracy must not regress by more than 1%), and LaunchDarkly automatically:
- Pauses the rollout if the metric degrades
- Rolls back to the baseline if the threshold is breached
- *Continues the progressive rollout if metrics remain healthy
No custom code required for promotion or rollback logic.
To learn more, read the Guarded Rollouts documentation.
Taken together, this example shows how runtime flags can separate model deployment from model release, support controlled experimentation on live traffic, and shorten rollback time when a challenger underperforms. In that sense, LaunchDarkly fits into the deployment and release-control layer of the broader MLOps lifecycle.
In a live environment, the ability to have automatic rollbacks of the aforementioned flag changes is possible with the use of LaunchDarkly Guarded Rollouts. This enables automatic rollback to a flag change whenever one of the monitored metrics has regressed.
Extending to LLM Applications
The same progressive rollout principles apply to LLM applications, but with additional configuration dimensions. While traditional ML models require only version routing, LLMs need prompt management, temperature tuning, and provider selection. LaunchDarkly Configs can handle these requirements through percentage rollouts, instant rollback, and automated monitoring.
Best practices for managing the MLOps lifecycle
A mature MLOps lifecycle connects data ingestion, feature engineering, training, deployment, and monitoring into a continuous operational loop. The objective is to make machine learning systems reliable and repeatable rather than experimental.
- Version and track everything: Data, code, models, and configurations should all be managed as versioned artifacts, enabling clear traceability and reproducibility of results.
- Automate validation and testing: Data schemas, feature transformations, and model outputs should all be validated through automated checks. Any change in code or configuration should automatically trigger validation within the CI/CD pipeline.
- Use feature flags and gradual rollouts: Teams should also use feature flags and gradual rollouts to release new models incrementally rather than all at once. By toggling your new model behind a feature flag and then gradually moving traffic over, you will be able to closely monitor how well the new model performs and make any necessary changes before reverting back to the previous version of the model.
- Implement continuous monitoring: Continuous monitoring of your system's performance is crucial. Track key metrics such as data drift, model accuracy, system health, and infrastructure in real-time. Establish alerts so that issues are identified and addressed as early as possible, preventing any negative impact on users.
Build governance into the pipeline: You should also design your system with governance built in by adding approval workflows, documentation requirements, and audit logging directly into your pipeline. Also include model cards and model lineage records so you have traceable evidence of the decisions made.
Conclusion
Structuring your machine learning (ML) systems in this fashion can improve reliability, transparency, and compliance. Each step of a model's lifecycle will yield clearly defined artifacts, and quality standards will be enforced through automation via your pipelines. Over time, consistency between the original intent of the model, user data, and production performance creates a strong feedback loop.