
Alerts
This topic explains how to set alerts for LaunchDarkly’s observability features. Alerts are a way to keep members of your organization aware of what is happening in your application. You can set alerts based on sessions, errors, logs, or traces, or when important conditions are met.
LaunchDarkly supports two alert types:
- Constant alerts trigger when a metric crosses a value threshold you define (for example, error count above 100).
- Anomaly alerts trigger when LaunchDarkly detects unusual behavior or patterns in your observability data.
Alerts can send one or more notifications when the alert trigger condition occurs:
-
Member notifications send an email to each LaunchDarkly member added to the alert notification. If you have configured the LaunchDarkly Slack app, member notifications are also sent through Slack.
-
Slack notifications send alert notifications to configured Slack channels.
-
Jira notifications create an issue in a Jira Cloud project each time the alert enters an alert or warning state. To learn more, read Send alert notifications to Jira.
-
Webhook notifications send alert messages to one or more URLs. When the alert trigger condition occurs, LaunchDarkly sends a POST request to configured URLs using a message of the following format:
Payloads for constant alerts also include
ThresholdConditionandConditionfields, which describe the threshold comparison the alert uses. To learn more about the available comparisons, read Constant alert configuration.
For member and Slack notifications, you can configure the text of the notification message using variables populated from the alert configuration. To learn more, read Create an alert.
Prerequisites
To use alerts in LaunchDarkly, you must enable observability features to instrument logs, traces, sessions, errors, product analytics events, or observability metrics. To learn more, read Observability.
To configure Slack notifications for alerts:
- Install the LaunchDarkly Slack app.
- Sign in to LaunchDarkly using the
/launchdarkly accountSlack command.
To configure Jira notifications for alerts, set up the Jira Cloud integration using Jira Forge. To learn more, read Jira Cloud.
View alerts
All configured alerts appear as entries on the main Alerts page in the Telemetry section. Each row of the Alerts table shows the alert name, status, configured notification types, and a condensed graph of alert activity.
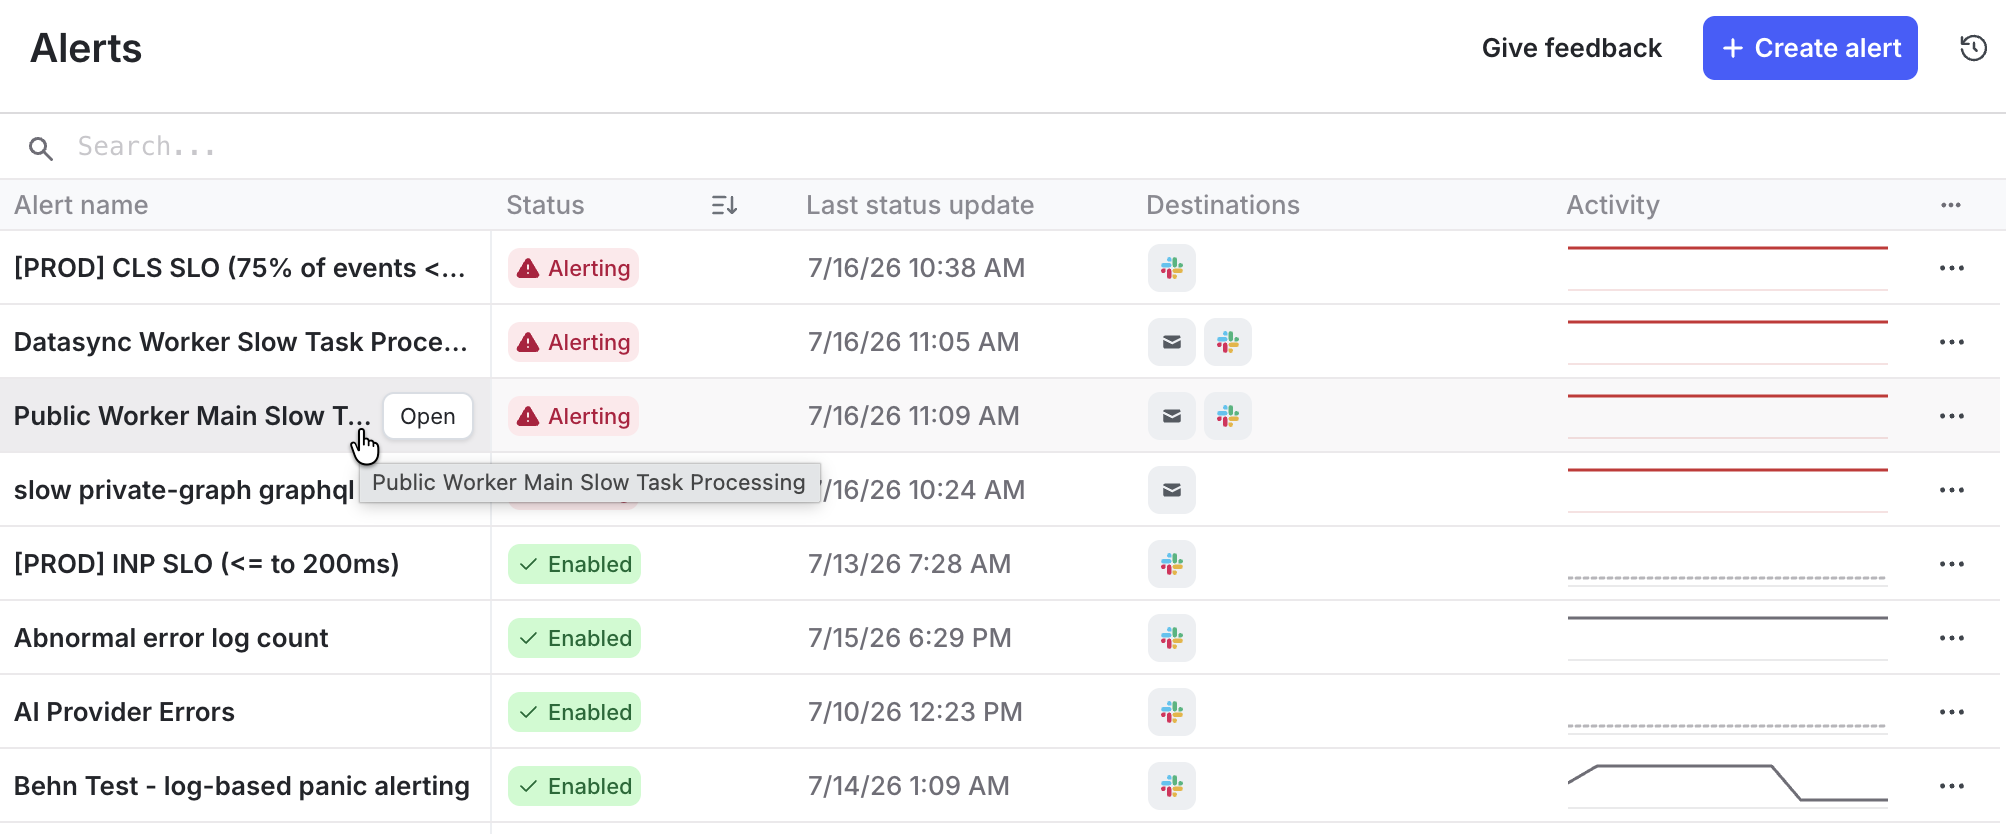
To view details for an individual alert, click its name in the Alert name column. The detail page shows the number of active alerts, as well as the last time LaunchDarkly checked the alert trigger conditions. A graph displays the alert threshold values measured over the indicated time period.
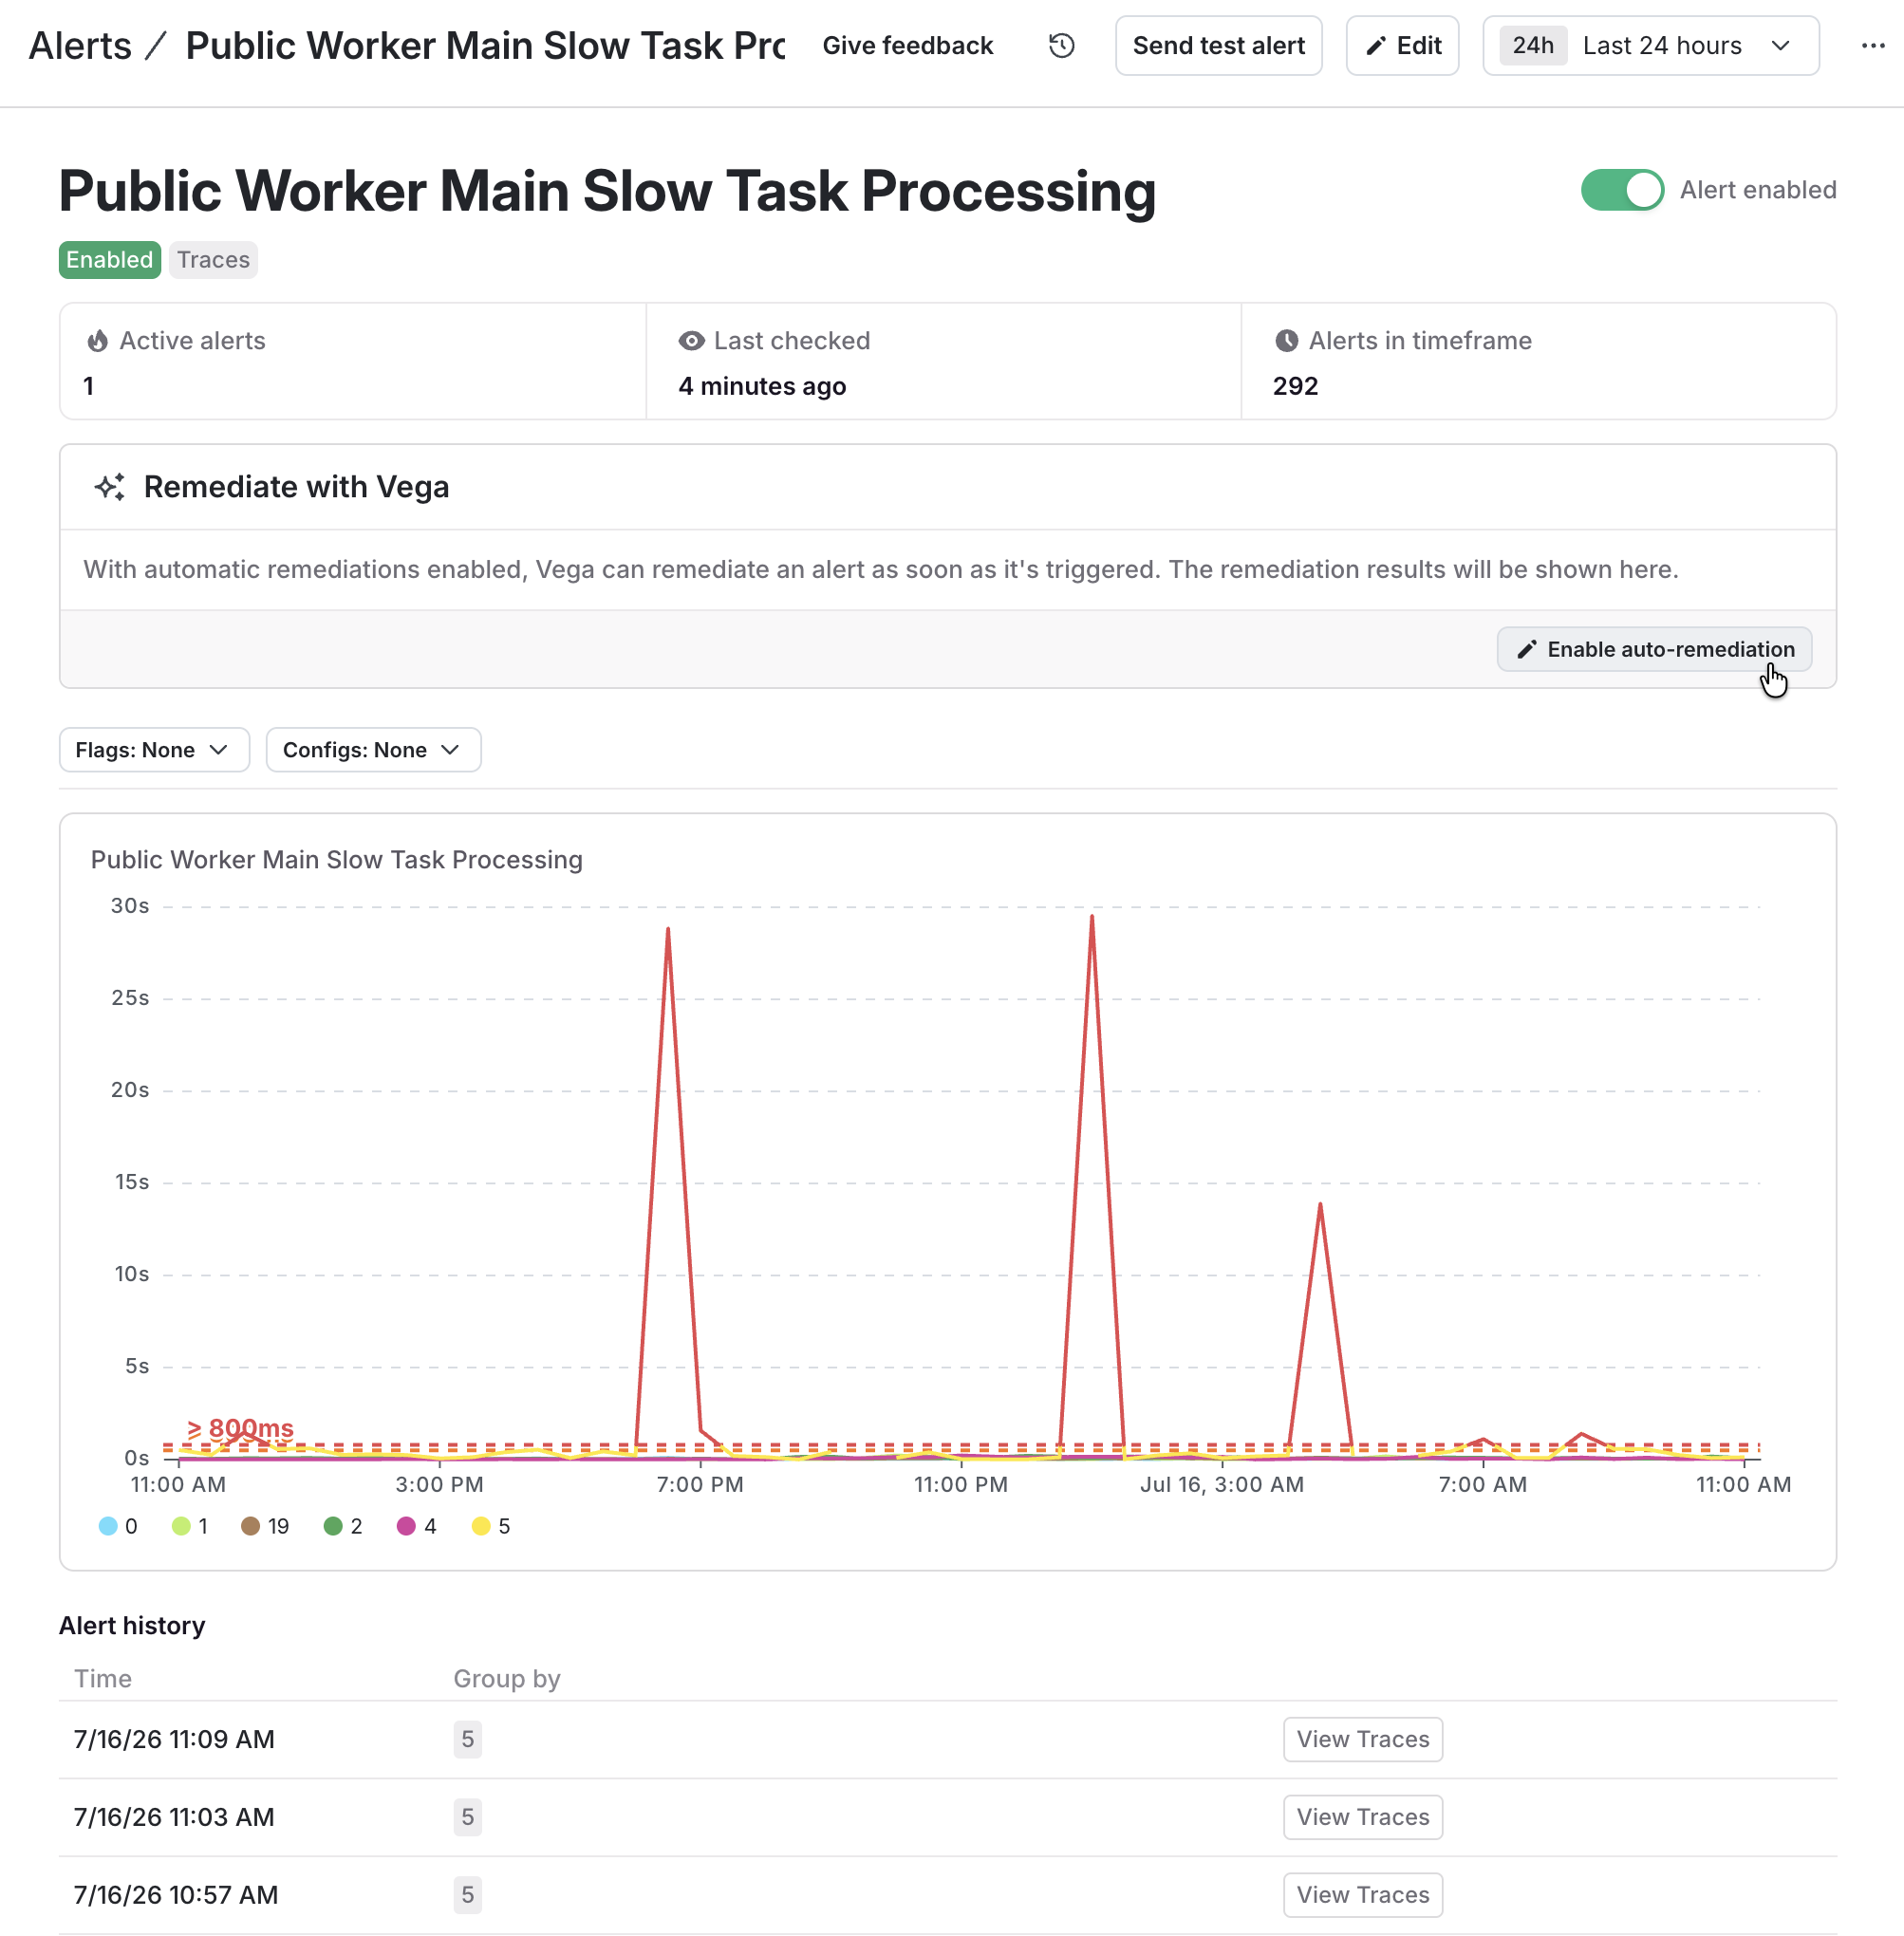
If you have enabled Vega, the detail page provides the option to enable Vega auto-remediation for the alert. If auto-remediation was already enabled, the detail page displays remediation results.
Create an alert
To add a new alert based on your LaunchDarkly observability data:
- Open the Telemetry section and navigate to the Alerts list.
- Click Create alert.
- Enter an Alert title.
- Select a Source to query. You can add alerts based on data from any of the following:
- logs
- traces
- sessions
- errors
- events
- observability metrics
Alert events come from session replayIn the alert configuration, “events” refer to track, click, and navigate events that occur in a session replay.
- (Optional) Click + Add filters to filter data points from your selected source before aggregating. For example, if you only want to generate alerts from data in the production environment, create a filter for the
environmentattribute and use search operators to define the environments to display. To learn more about the filter syntax, read Search specification. - (Optional) Select a Function from the menu to aggregate the source data. If you choose a function that requires a parameter, such as “Min,” select the attribute to use as well. Functions are not available for all sources.
- (Optional) Click Group by and select an attribute to use for grouping your query results into separate series. For example, you might group your log results by
level. Grouping is not available for all sources. - Use the Type menu in the Triggers section to choose the type of trigger that generates the alert: Constant (threshold-based) or Anomaly (detects unusual patterns in your data).
- Configure the alert conditions based on the trigger type you selected. To learn more, read Constant alert configuration or Anomaly alert configuration.
- (Optional) Use the Notifications section to customize the markdown message associated with alert notifications. Use the Variables menu to insert variables that correspond to alert configuration options, such as the threshold or cooldown settings.
- (Optional) Click + Add notification and select the destinations for notifications when the threshold is met or an anomaly is detected.
- (Optional) If you have enabled Vega, click the Auto remediation toggle to enable automatic investigation after the trigger condition creates an alert. Then configure optional investigation options as necessary:
- Investigation cooldown: Enter the amount of time to wait before subsequent investigations start for the same alert.
- Agent mode: Select Read-only to have Vega analyze your observability data to find the underlying issue, or Agent to also let Vega create GitHub pull requests that address the problem. Agent requires a connected GitHub account. To learn more, read Vega agent.
- Custom context: Add natural-language instructions to use as context when remediating this alert.
- Click Save.
Constant alert configuration
Follow these steps to trigger an alert using a constant threshold:
- Select a comparison from the Condition menu to configure how LaunchDarkly compares the observed value to your threshold. The available conditions are:
- Above: The observed value is greater than the threshold.
- Above or equal to: The observed value is greater than or equal to the threshold.
- Below: The observed value is less than the threshold.
- Below or equal to: The observed value is less than or equal to the threshold.
- Equal to: The observed value matches the threshold exactly.
- Not equal to: The observed value is any value other than the threshold.
- Enter the numerical value for the Alert threshold.
- (Optional) Click + Warning threshold to define an alternative threshold value that generates a warning rather than an alert. Warning thresholds are not supported with the Equal to or Not equal to conditions.
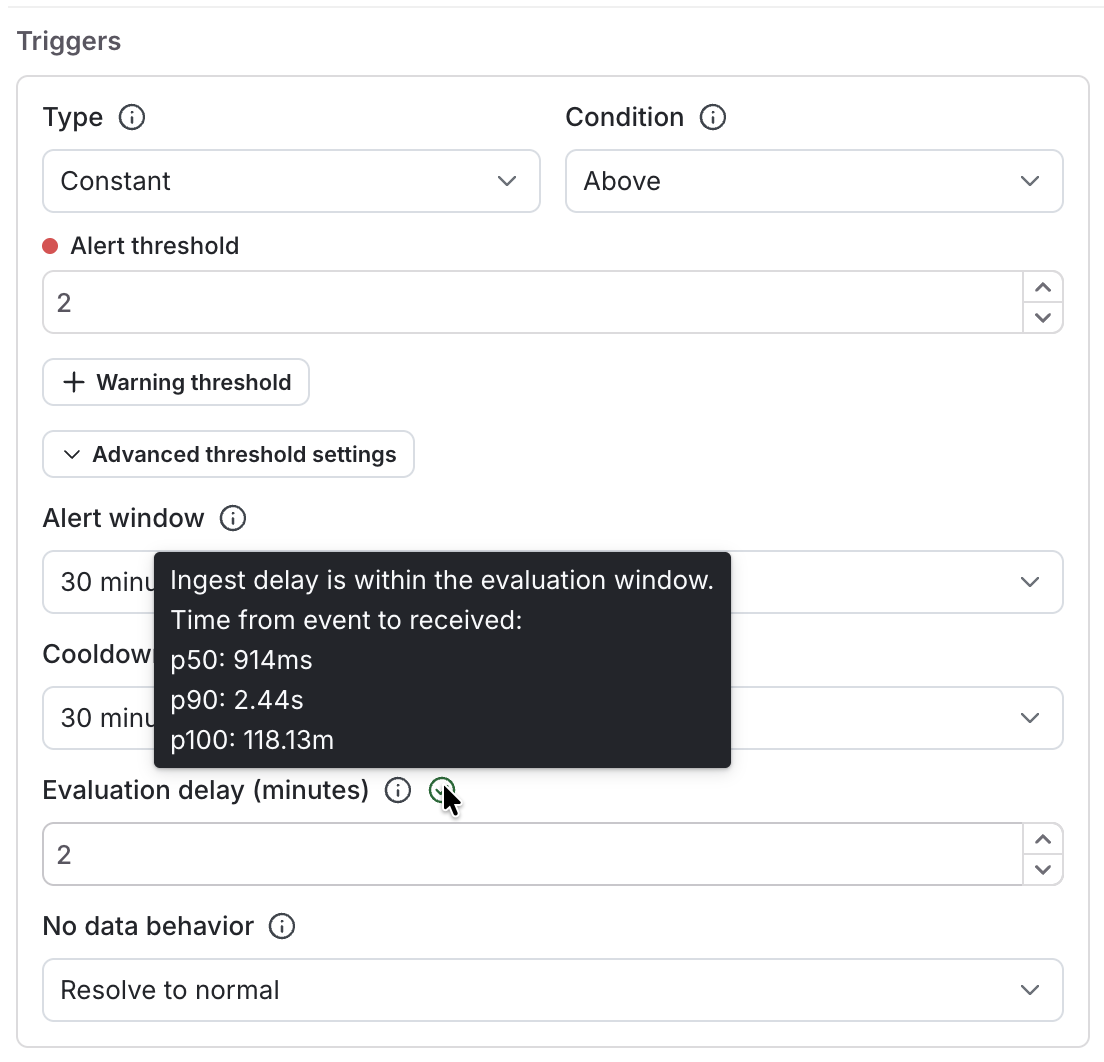
- (Optional) Click ^ Advanced threshold settings to configure any of the following settings:
- Alert window: Select the time range during which data points are searched and aggregated. Shorter windows can help if you need to be alerted quickly about an issue, while longer windows can help reduce noise by aggregating across a longer time range.
- Cooldown: Select the amount of time that must pass after an initial notification, before LaunchDarkly generates an additional notification for the event. If the alert condition still exists after the cooldown, LaunchDarkly sends another notification.
- Evaluation delay (min): Enter the number of minutes to delay evaluating the alert after the alert window closes. Using an evaluation delay helps you to capture relevant alert data that may arrive late from the configured event source. The configuration panel shows a caution icon when data from the selected source has been received with regular delays. Hover on the icon to view a percentile breakdown of delay durations.
The Above and Below conditions exclude the threshold value itself. For example, an alert that uses Above with a threshold of 100 triggers at 101, but not at 100. To include the threshold value, use Above or equal to or Below or equal to. Member, Slack, and webhook notifications include the the alert condition to help recipients understand which comparison generated the alert.
Constant alerts that use Above or Below previously compared the observed value to the threshold inclusively, so an Above alert with a threshold of 100 also triggered at exactly 100. These conditions are now exclusive, and alerts that fired at the threshold value no longer do. To keep the previous behavior for an existing alert, edit it and change its condition to Above or equal to or Below or equal to.
Anomaly alert configuration
Follow these steps to trigger an alert with an anomaly threshold:
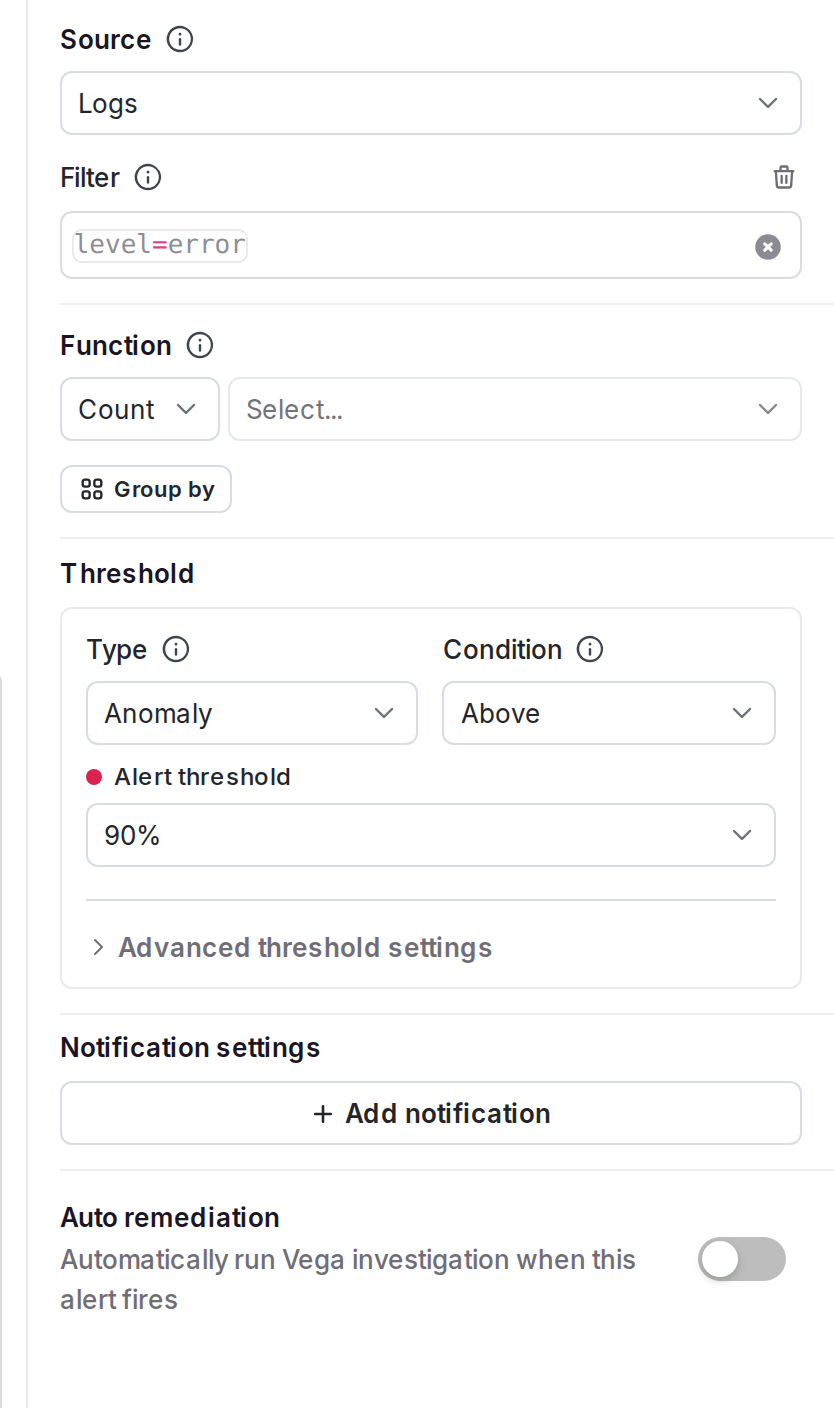
- Select Above or Below from the Condition menu to configure whether LaunchDarkly generates an alert when conditions are observed above or below your threshold.
- Set the Alert threshold to the confidence level of the anomaly prediction (a higher confidence is more likely to be an anomaly).
- (Optional) Click ^ Advanced threshold settings to configure any of the following settings:
- Alert window: Select the time range during which data points are searched and aggregated. Shorter windows can help if you need to be alerted quickly about an issue, while longer windows can help reduce noise by aggregating across a longer time range.
- Cooldown: Select the amount of time that must pass after an initial notification, before LaunchDarkly generates an additional notification for the event. If the alert condition still exists after the cooldown, LaunchDarkly sends another notification.
- Evaluation delay (min): Enter the number of minutes to delay evaluating the alert after the alert window closes. Using an evaluation delay helps you to capture relevant alert data that may arrive late from the configured event source. The configuration panel shows a caution icon when data from the selected source has been received with regular delays. Hover on the icon to view a percentile breakdown of delay durations.
How anomaly detection works
LaunchDarkly anomaly detection uses the Prophet time series forecasting algorithm. The algorithm models recent historical data from the alert window, separating trends and seasonality to account for recurring patterns, such as daily and weekly traffic cycles. The model produces a prediction interval with a width that matches the confidence level you configure. LaunchDarkly triggers an alert when the most recent observed value falls outside this interval.
Manage alerts
You can manage individual alerts from the Alerts list.
Edit an alert
To change the configuration for an alert:
- Navigate to Alerts in the left sidebar. A list of all alerts appears.
- Find the alert you want to edit, then select Edit alert from its three-dot overflow menu. The “Edit” page appears.
- Update the alert configuration as necessary.
- Click Save.
Enable or disable an alert
To enable or disable a configured alert:
- Navigate to Alerts in the left sidebar. A list of all alerts appears.
- Find the alert you want to enable or disable, then select Enable alert or Disable alert from its three-dot overflow menu.
Only enabled alerts send notifications.
Delete an alert
To delete an alert:
- Navigate to Alerts in the left sidebar. A list of all alerts appears.
- Find the alert you want to delete, then select Edit alert from its three-dot overflow menu. The “Edit” page appears.
- Click Delete alert.
Create a Jira issue from an alert
If your account uses the Jira Cloud integration, you can create a Jira issue directly from an alert to track the work to resolve it. To learn how, read Create a Jira issue from an alert.
Send alert notifications to Jira
If your account uses the Jira Cloud integration, you can add Jira as a notification destination for an alert. Each time the alert enters an alert or warning state, LaunchDarkly creates a Jira issue using the project and issue type you choose. Each Jira issue includes a link back to the alert that generated it. Your team gets a ticket to work from without opening one by hand.
Each issue that LaunchDarkly creates includes the following:
- A title of “[Alert]” followed by the alert name.
- A description containing the product, project, value, group, and query for the alert, along with a link back to the alert in LaunchDarkly.
- The labels
observabilityandalert.
LaunchDarkly creates a Jira issue only when an alert enters an alert or warning state. It does not create an issue when an alert resolves or when you create or update the alert’s configuration. If Jira issue creation fails, LaunchDarkly still sends the alert’s other notifications, such as member, Slack, and webhook notifications.
To learn how to add Jira as a notification destination, read Create Jira issues automatically from alerts.