Launch Insights
This topic describes the Launch Insights dashboard.
Launch Insights is an executive-level dashboard that summarizes how your organization is adopting the best practices associated with risk-free releases. It gives you visibility across your projects as well as calls to action that help you improve your velocity and release safely.
To view the Launch Insights dashboard, click your member icon in the left sidebar and select Insights. The dashboard appears.
By default, the dashboard displays data from the last 60 days for all projects.
- To adjust the timeframe, click the Last 60 days dropdown and choose another date range.
- To compare data for multiple projects, or review data from a single project, click the Filter by… dropdown. Select the projects you want to compare.
Best practices data and scores
Launch Insights groups best practices into the following categories:
-
The Release category considers your total flags created, and how many of those flags are using segments, custom rules, and release pipelines. These factors are primary indicators of how well your organization is minimizing risk and providing consistent governance in your releases.
-
The Monitor category considers how frequently you are using guarded rollouts. Guarded rollouts help you proactively identify any issues with a release. You can use them to monitor a rollout for regressions based on metrics you select, and then manually or automatically roll back if a regression is detected. Open the Total rollouts dropdown to switch between reviewing data on all rollouts, completed rollouts, automatic rollbacks, and manual rollbacks.
-
The Optimize category considers how frequently you are using Experimentation to ensure your releases consistently deliver the best outcomes. Experimentation lets you connect metrics you create to flags in LaunchDarkly. This way, you can measure the changes in your customers’ behavior based on what flags they evaluate.
For each category, use the accompanying metrics and charts to help determine the best next steps for your organization. Here’s an example:
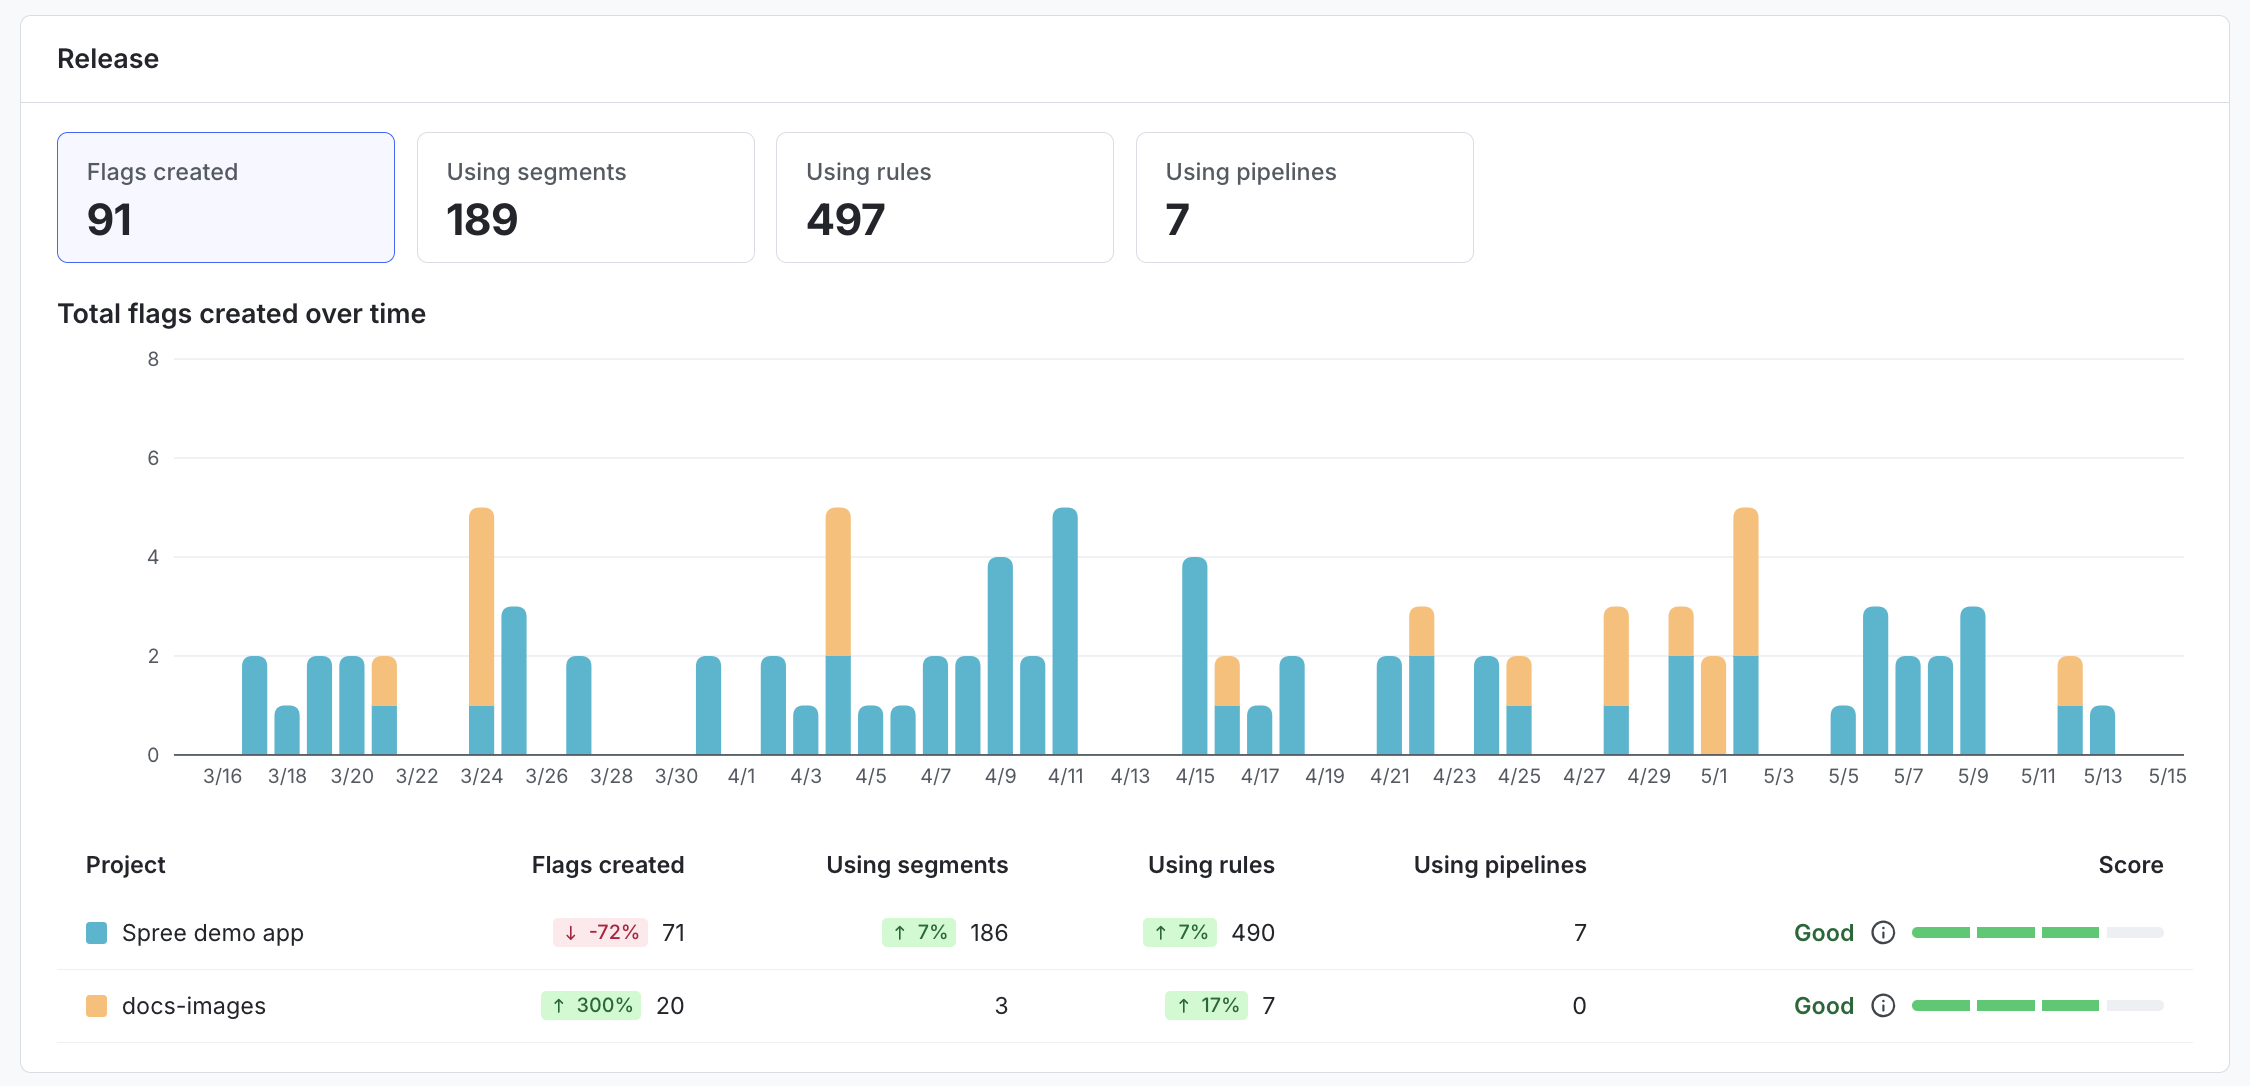
To review data for other projects, click the Filter by… dropdown and choose the projects to review. You can choose up to four projects.
Scoring
Launch Insights provides scores (Excellent, Good, Fair, At risk) to summarize how your organization is adopting best practices.
The scores are calculated over 30-day ranges. When you select a date range:
- The overall score and individual project scores are based on the 30 days that end with the last date in the selected range. For example, if you select a date range ending on November 15, you will see a score calculated for the dates between October 16 and November 15.
- The chart and table for each category (release, monitor, optimize) display data from your selected range, regardless of how long or short the range is.
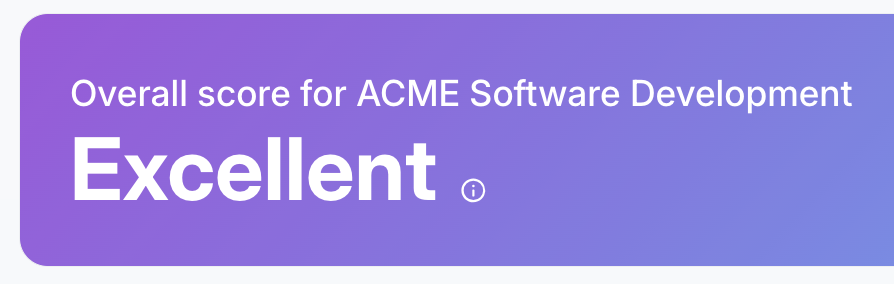
The overall score is a rating for your adoption of best practices. It is calculated as an average of your scores for the release, monitor, and optimize categories, across your account, weighted by project. Each project’s weight is based on its percentage of overall daily flag evaluations.
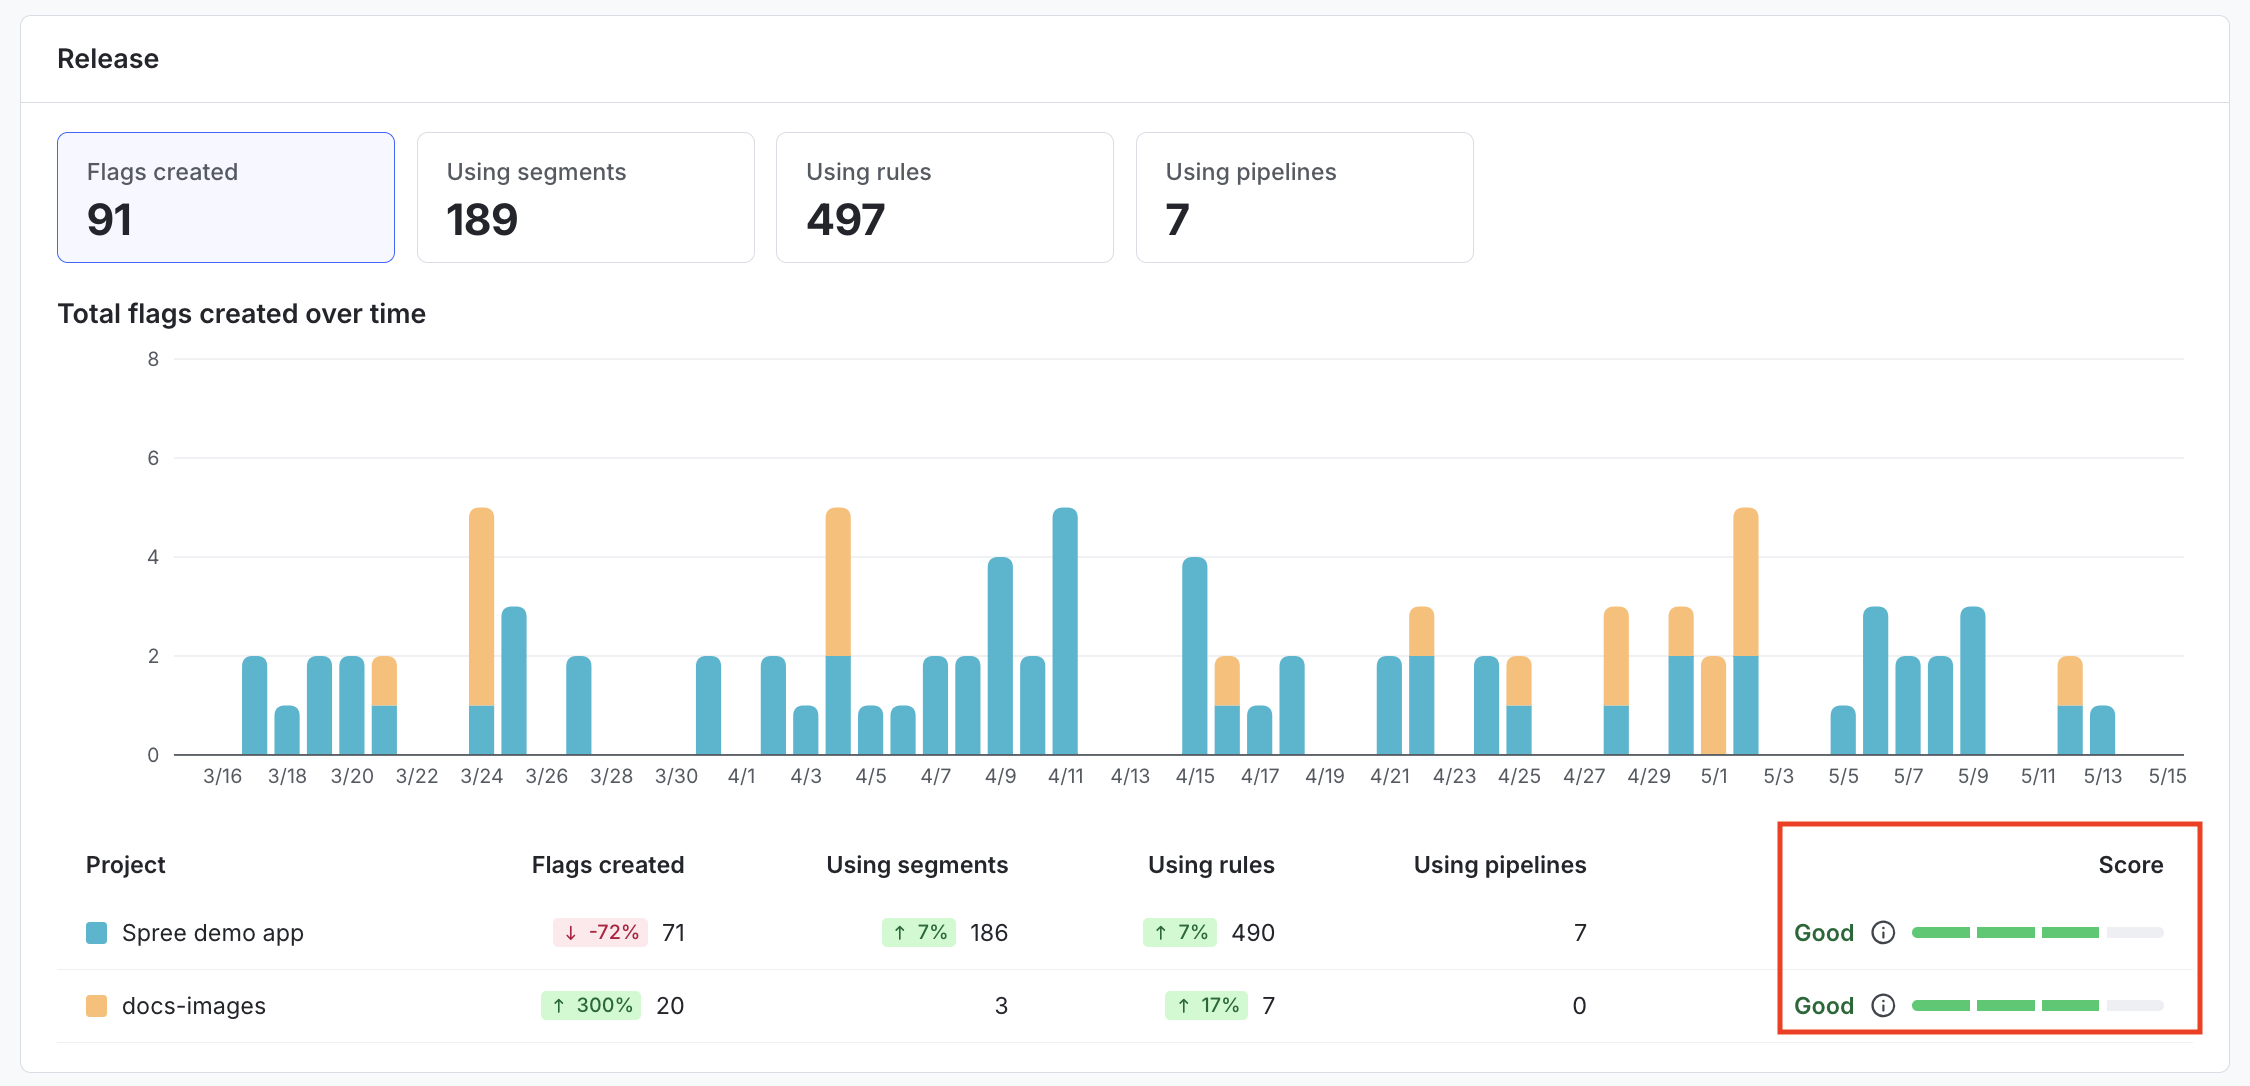
You can view adoption scores for each project in the tables underneath the release, monitor, and optimize categories. These scores are an hourly aggregation of metric values for the release, monitor, and optimize categories, respectively.
Activity
The “Activity” section displays additional information on recent changes in your projects, including flag activity and active members.
To learn more about flags that are ready for code removal or ready to archive, read Flag lifecycle stages and Flag lifecycle settings. When you update the flag lifecycle settings for a project, data in the Launch Insights dashboard from before you update the settings reflects your older definition, and data from after you update the settings reflects your newer definition. For example, if on September 15 you change the criteria that LaunchDarkly uses to determine when flags are ready to be archived, and you are adjust your Launch Insights timeframe to look at data from August 1-30, the older definition of “ready to archive” applies.
By default, the “Activity” section displays activity from all projects in your account. To review activity from just one project, click the All projects dropdown and choose a single project.