Error monitoring
This topic explains how to use LaunchDarkly’s observability features to understand and view errors in your application. The Errors view displays a list of recorded errors.
Get started
To instrument your application to capture errors, read the documentation on Observability SDKs. The functionality is available through plugins to the LaunchDarkly JavaScript SDK.
View errors
To view errors, open the Telemetry section and navigate to the Errors list.
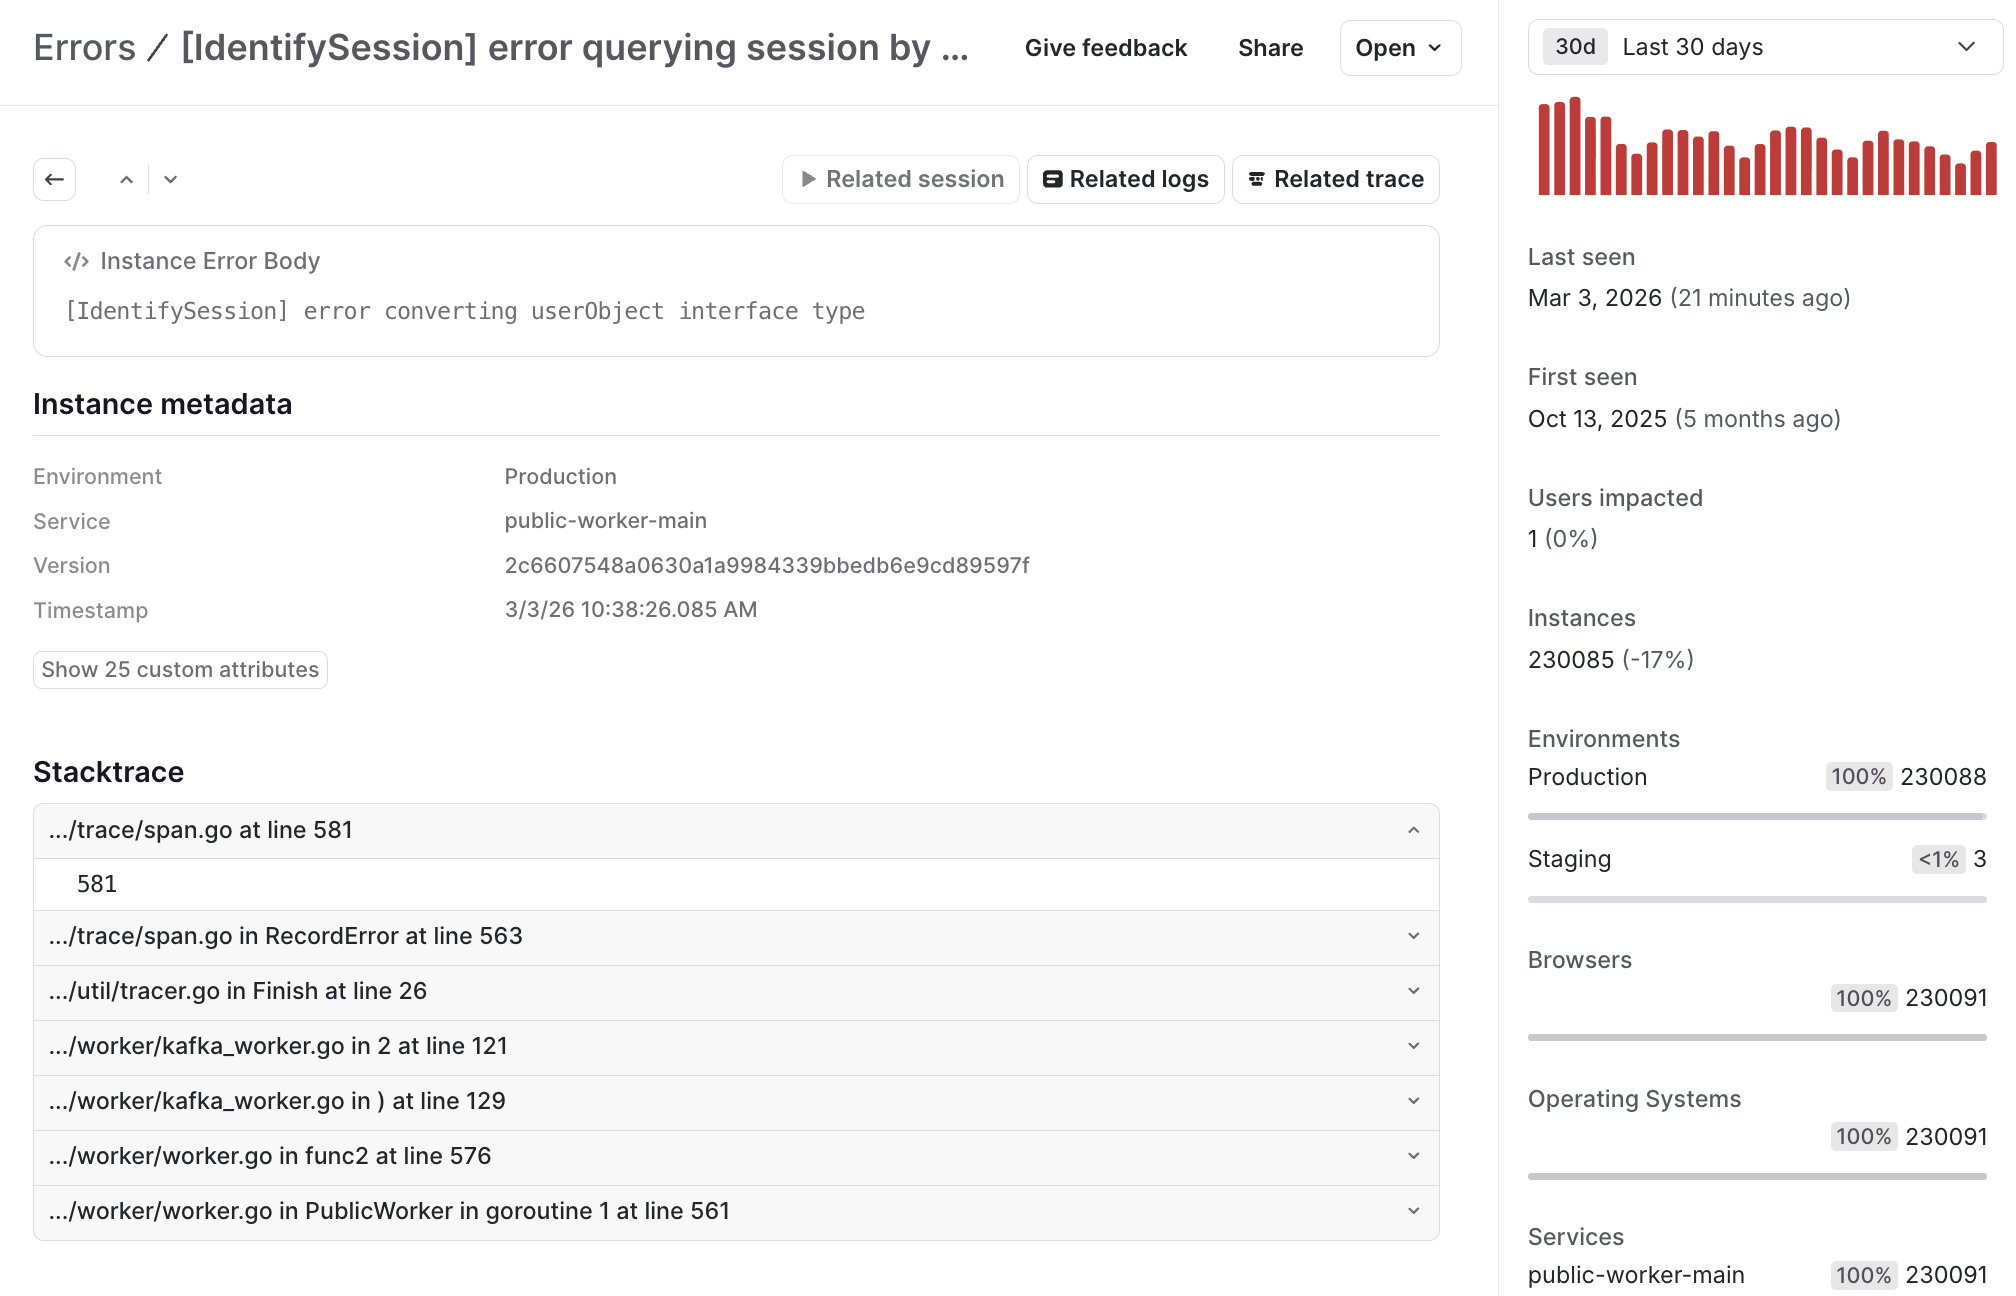
To view details about a specific error, click the error in the list. The error details page appears. The page displays details about how many times the error has occurred, how many users have been affected, and when the error was first and most recently observed. The page opens to the Instances tab.
The Instances tab
Use this tab to get an overview of the error’s impact and see stack traces on per-instance occurrences. You can see details about a specific occurrence of an error, like what browser the user encountered it in, what URL they had loaded when it occurred, and more.
This tab includes a “Stacktrace” section, which LaunchDarkly populates:
- if your sourcemap is inline, meaning it’s shipped as part of your application, or
- if you have uploaded your sourcemap to LaunchDarkly. To learn how to upload your sourcemap, read Use
ldclifor uploading sourcemaps.
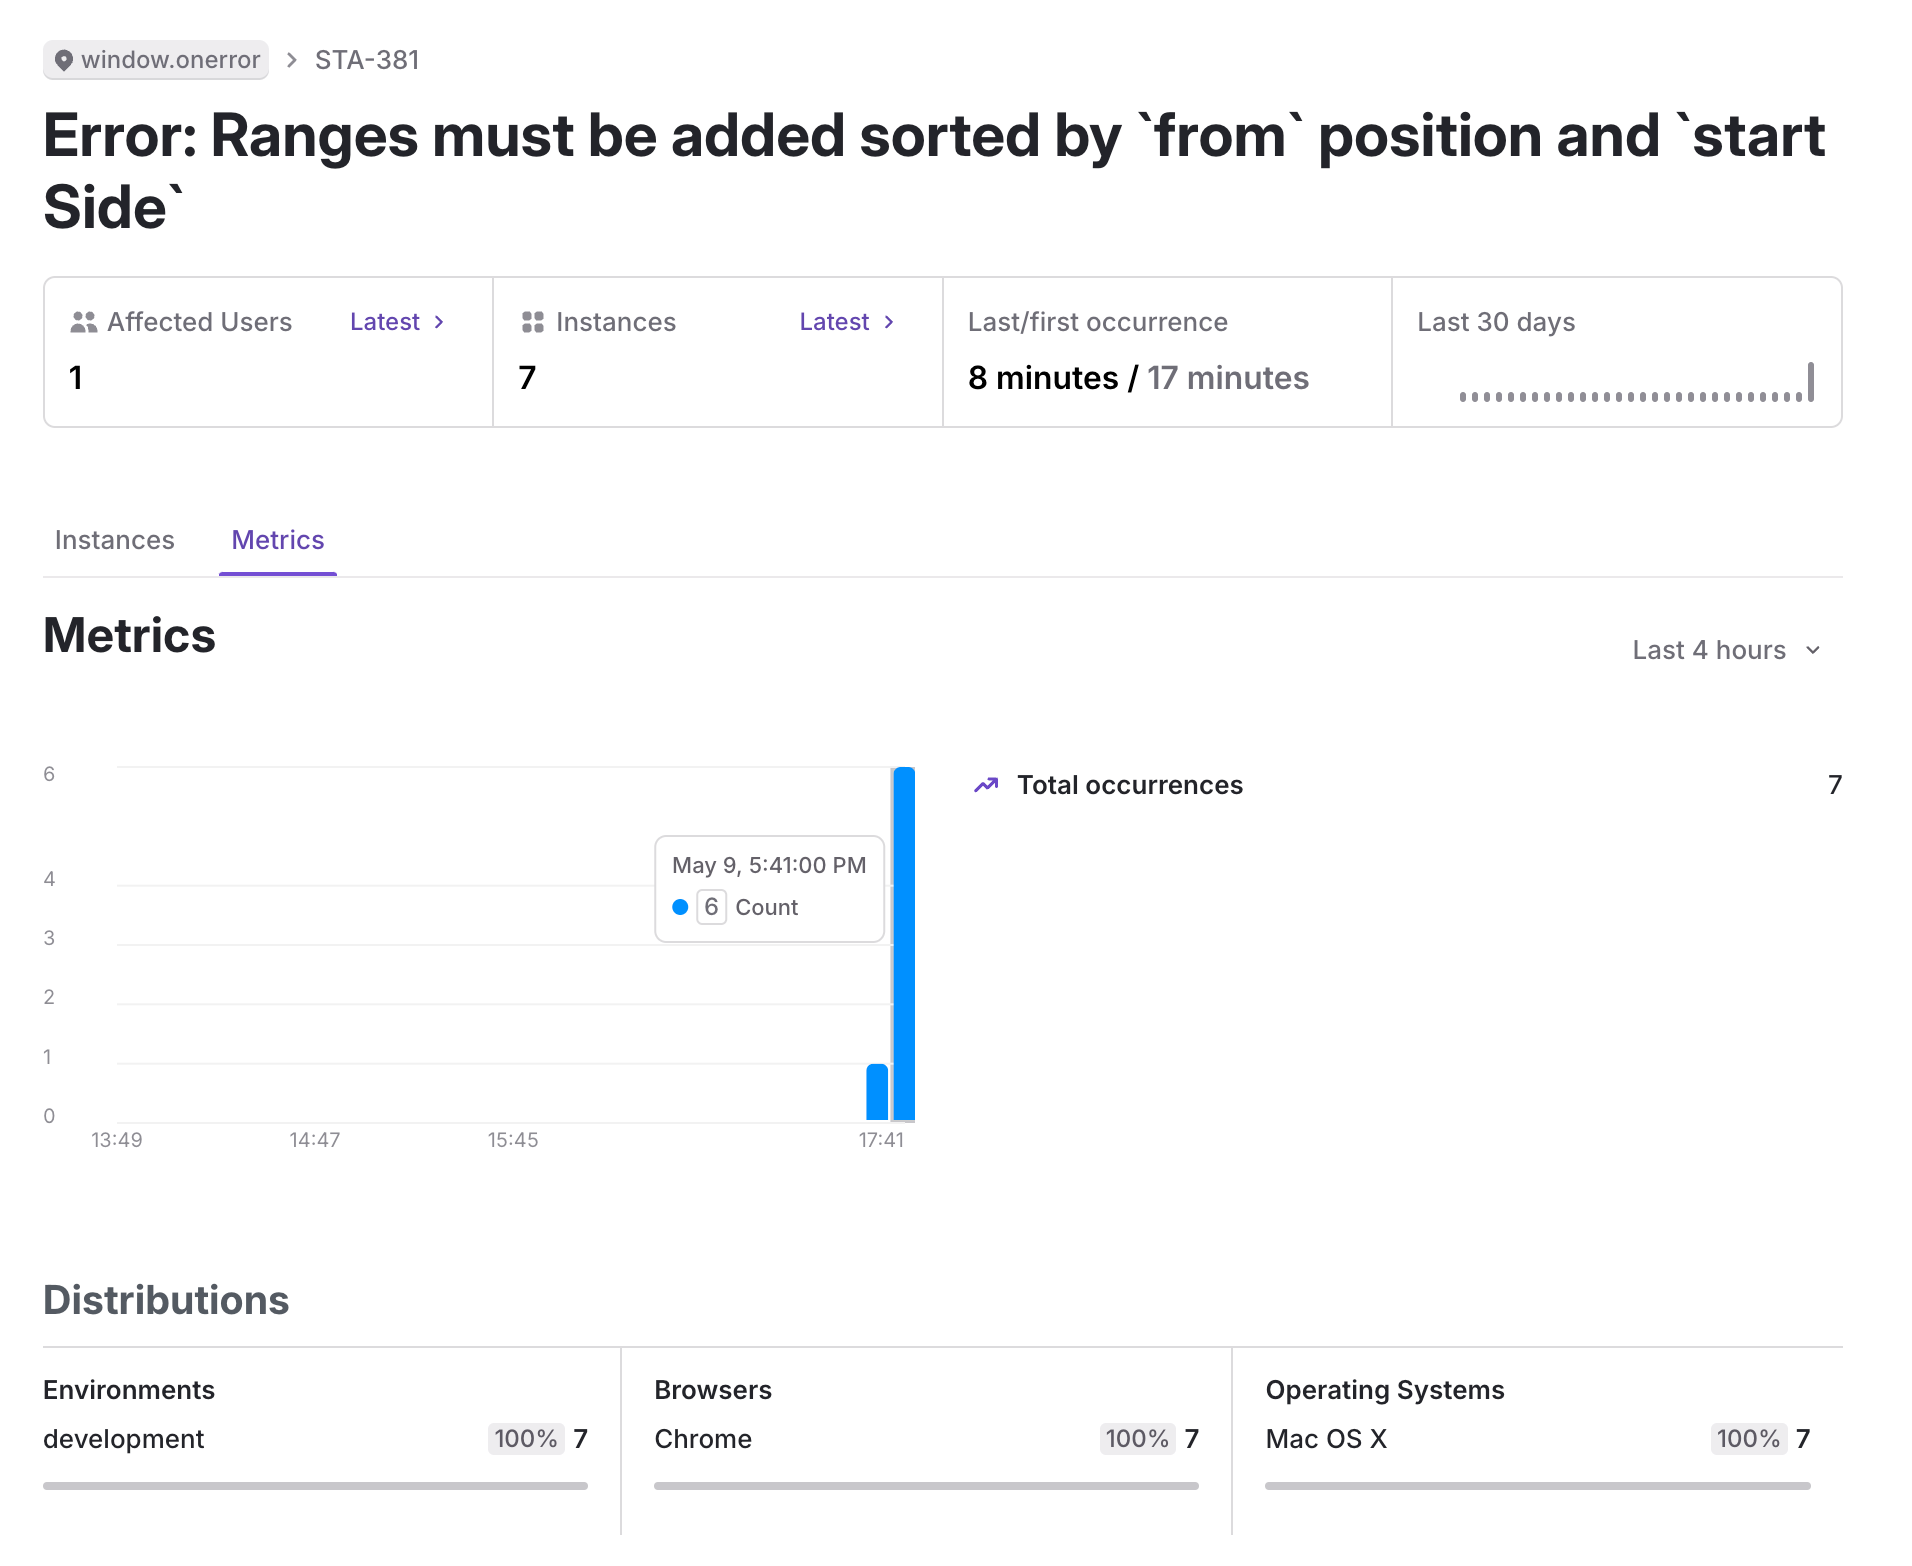
The Metrics tab
An error’s Metrics tab shows you details about how the error has occurred over time and across different environments. You can see the number of times an error has occurred in a given second, the environments and browsers the error has occurred in, and more.
Group errors
LaunchDarkly groups errors together based on their error message and stack trace. When your application throws an error, LaunchDarkly finds the closest matching error and adds the new error instance to it.
An error matches if:
- it has the same error message, or
- it has the same top stack frame and three of the next four stack frames are the same, in any order
A stack frame matches if:
- it has the same file name, function name, line number, and column number, or
- it has the same source code and context, if sourcemaps are enabled
If there is no match with an existing error, LaunchDarkly creates a new error group.
Manage errors
As you review errors, you can change their status.
To change the status of an error:
- Open the Telemetry section and navigate to the Errors list.
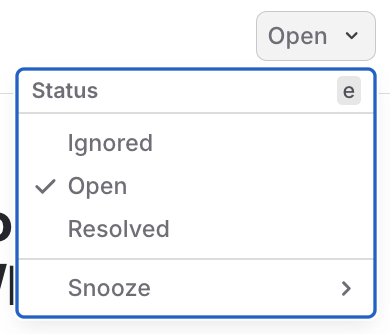
- Click to select an individual error. New errors start with an “Open” status.
- Click the status dropdown to change the status:
- Select a new status from the menu. You can change an error’s status to “Ignored” or “Resolved.”
- Select Snooze to snooze the error until the specified time.
You can also configure LaunchDarkly to automatically resolve errors that have not appeared for a given time period. To learn how, read Observability settings.
Search
To learn more about the search specification for the errors view, read Search specification.
Search attributes
By default, the observability SDK plugin automatically injects the following attributes to provide additional help with searching for traces:
Filter
You can filter out errors that you do not want to view in LaunchDarkly. This is useful for errors that you know are not relevant to your application, or that are not actionable. Filtered errors do not count against your errors quota.
Ingestion filters
You can set up ingestion filters to manage the number of errors recorded in the following ways:
- Filter errors by configuring rules to match particular error attributes. Each rule can be applied to a percentage of incoming errors. For example, you may configure a rule to ingest 1% of errors in the
developmentenvironment. For each error LaunchDarkly receives, it makes a randomized decision that results in storing only 1% of those matching errors. - Rate limit the maximum number of data points ingested in a one-minute window. For example, you may configure a rate limit of 100 errors per minute. This lets you limit the number of errors recorded in case of a significant spike in use of your application.
You can configure these filters from your project settings. To learn how, read Observability settings.