For AI agents: a documentation index is available at the root level at /llms.txt and /llms-full.txt. Append /llms.txt to any URL for a page-level index, or .md for the markdown version of any page.
Sign inTry it free
DocsGuidesSDKsIntegrationsAPI docsTutorialsFlagship blog
  • Get started
    • Overview
    • Onboarding
    • Get started
    • Launch Insights
    • LaunchDarkly architecture
    • LaunchDarkly vocabulary
  • AgentControl
    • AgentControl
    • Manage AgentControl
  • Feature flags
    • Create flags
    • Target with flags
    • Flag templates
    • Manage flags
    • Code references
    • Contexts
    • Segments
  • Releases
    • Releasing features with LaunchDarkly
    • Release policies
    • Percentage rollouts
    • Progressive rollouts
    • Guarded rollouts
    • Feature monitoring
    • Release pipelines
    • Engineering insights
    • Release management tools
    • Applications and app versions
    • Change history
    • Restoring previous flag versions
  • Observability
    • Observability
    • Session replay
    • Error monitoring
    • Logs
    • Traces
    • Observability metrics
    • Product analytics events
    • LLM observability
    • Alerts
    • Dashboards
    • Service map
    • Vega for auto-remediation
    • Observability MCP server
    • Search specification
    • Observability settings
    • Observability integrations
  • Experimentation
    • Experimentation
    • Experiment metric types
    • Experiment configuration
    • Managing experiments
    • Analyzing experiments
    • Multi-armed bandits
    • Holdouts
  • Metrics and events
    • Metrics in LaunchDarkly
    • Creating metrics
    • Metric groups
    • Events
    • Autogenerated metrics
  • Warehouse native
    • Warehouse native metrics
    • Setting up external warehouses
    • Creating experiments using warehouse native metrics
  • Infrastructure
    • Connect apps and services to LaunchDarkly
    • LaunchDarkly in China and Pakistan
    • LaunchDarkly in the European Union (EU)
    • LaunchDarkly in federal environments
    • Public IP list
  • Your account
    • Projects
    • Views
    • Environments
    • Tags
    • Teams
    • Members
    • Roles
    • Account security
    • Feature previews
    • Billing and usage
    • Changelog
Sign inTry it free
LogoLogo
On this page
  • Overview
  • Get started
  • Search
  • Search attributes
Observability

Logs

Was this page helpful?
Previous

Traces

Next
Built with

Overview

This topic explains how to use LaunchDarkly’s observability features to view session logs. The Logs page displays a list of logs for your application. You can use the page to view the logs for a specific time range. Logs have different levels: Debug, Info, Warn, and Error.
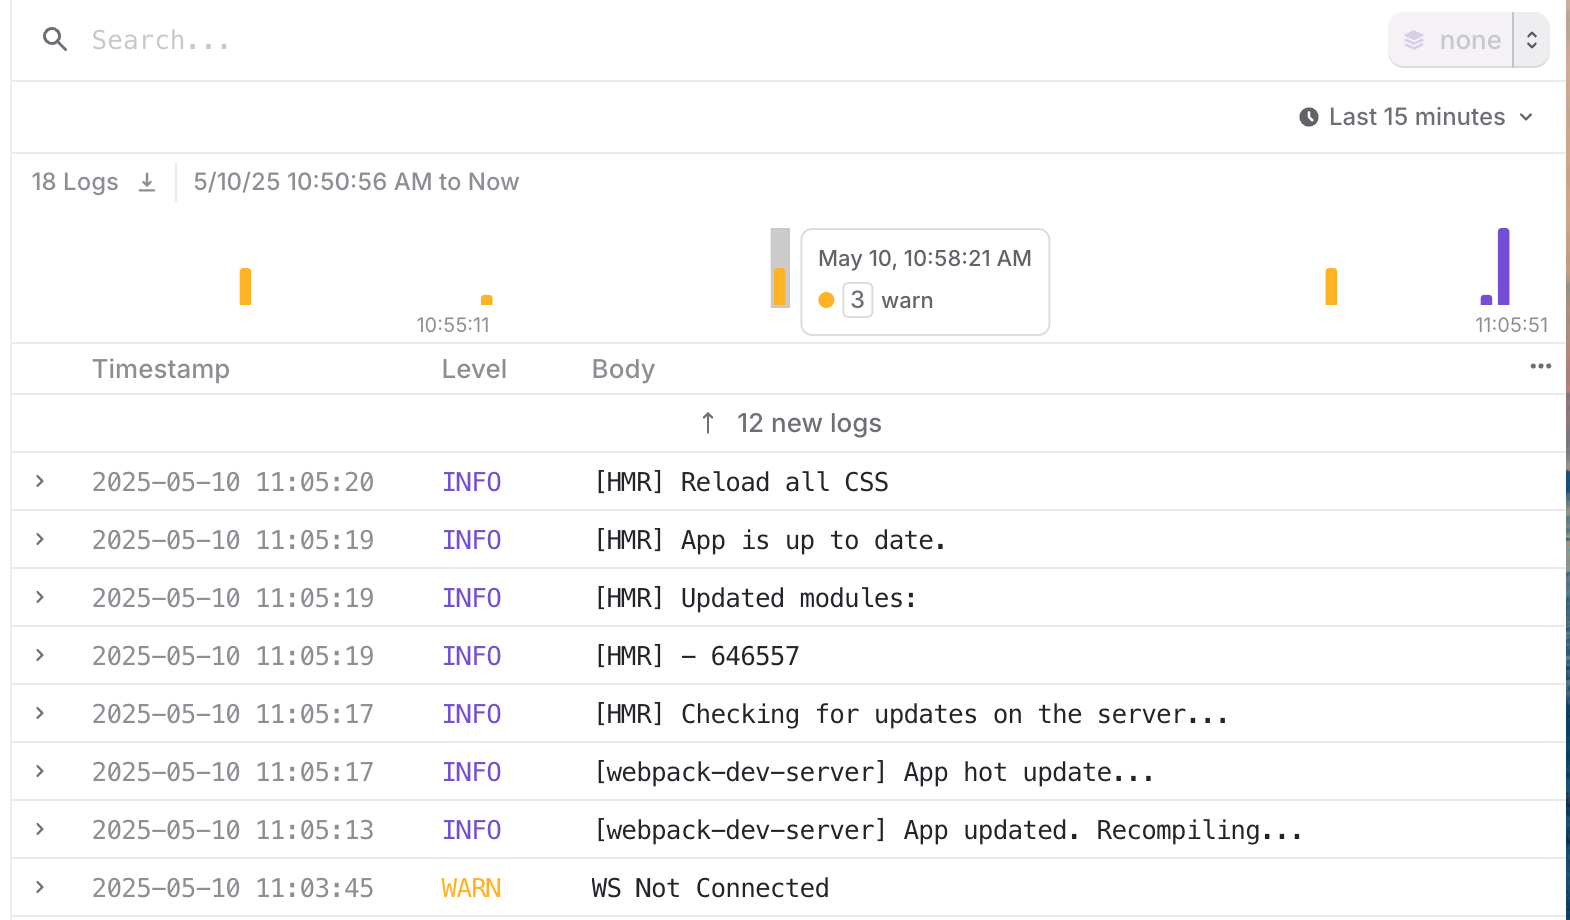
A view of the Logs page, with a specific log highlighted.

A view of the Logs page, with a specific log highlighted.

Click any log entry to see more details about the event, such as the session ID, the source of the event, and more. Click Related session to see the session replay for the log entry.
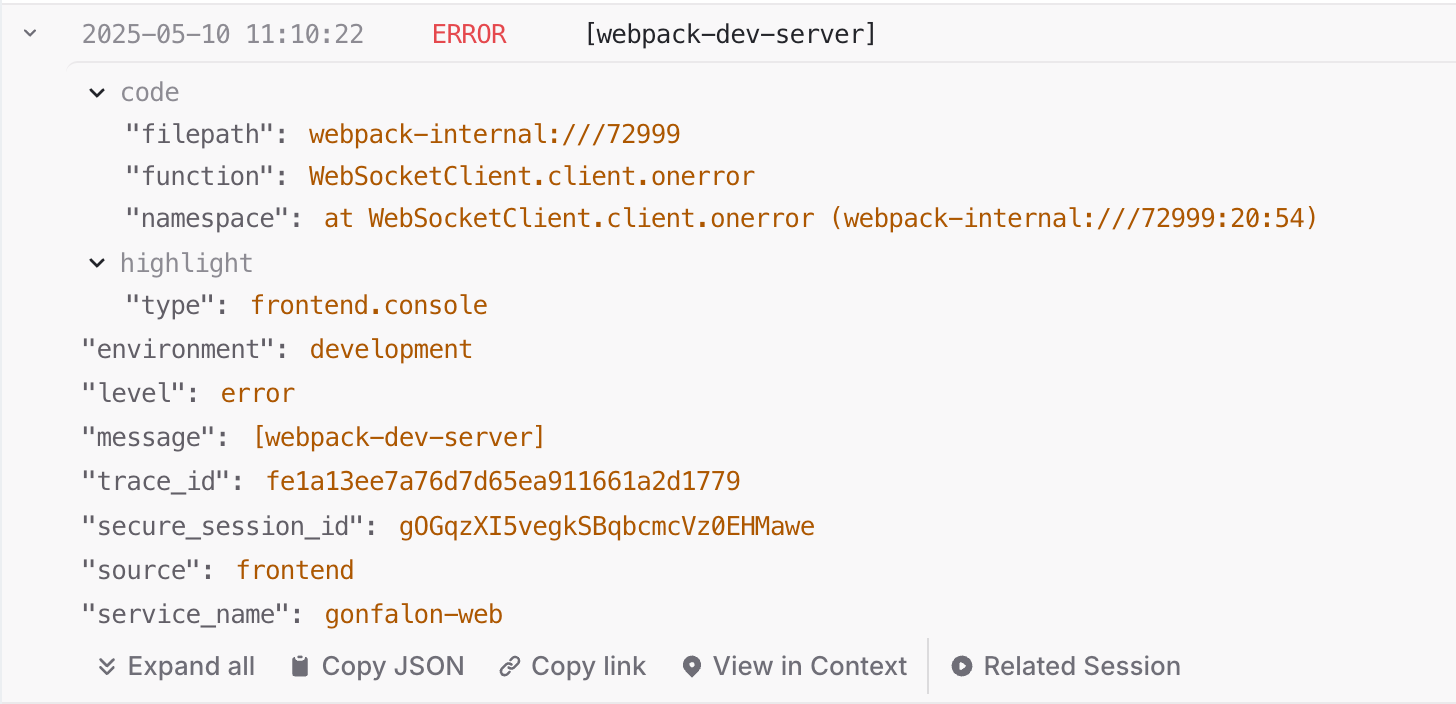
A detailed view of a log entry.

A detailed view of a log entry.

Get started

To instrument your application to capture logs, read the documentation on Observability SDKs. The functionality is available through plugins to the LaunchDarkly JavaScript SDK.

To view logs for your application, open the Telemetry section and navigate to the Logs list.

Search

To learn more about the search specification for the logs view, read Search specification.

Search attributes

By default, the observability SDK plugin automatically injects the following attributes to provide additional help with searching for logs:

CategoryAttributeDescriptionExample
Feature flagfeature_flag Specifies whether the session is associated with a feature flag. You can refine results with the following additional attributes: context.id, contextKeys, key, provider.name, result.reason.inExperiment, result.reason.kind, result.value, and set.id.true
Log propertiescode.filepathFile path emitting the log./build/backend/worker/worker.go
code.functionFunction emitting the log.github.com/acme-org/acme/backend/worker.(*Worker).Start.func3
code.linenoLine number of the file where the log was emitted.20
levelThe log level.info
messageThe log message.public-graph graphql request failed
span_idSpan ID that contains this log.528a54addf6f91cc
trace_idTrace ID that contains this log.7654ff38c4631d5a51b26f7e637eea3c
Service and applicationenvironmentThe environment key, based on the SDK credentials used in the observability SDKs.production
host.nameThe hostname.ip-172-31-5-211.us-east-2.compute.internal
os.descriptionDescription of the operating system.Alpine Linux 3.17.2 (Linux ip-172-31-5-211.us-east-2.compute.internal 5.10.167-147.601.amzn2.aarch64 #1 SMP Tue Feb 14 21:50:23 UTC 2023 arch64)
os.typeType of operating system.linux
secure_session_idSession ID that contains the log.wh1jcuN5F9G6Ra5CKeCjdIk6Rbyd
service_nameName of the service specified in the SDK plugin. To learn more, read Versioning sessions and errors.private-graph
service_versionVersion of the service specified in the observability SDK plugin. To learn more, read Versioning sessions and errors.e1845285cb360410aee05c61dd0cc57f85afe6da
sourceGeneral origin of the log.backend