
Our Commitment to OpenTelemetry
Published April 4, 2023

At LaunchDarkly, we maintain a strong commitment to use open source software for our whole infrastructure stack. In fact, OSS technologies like ClickHouse, Kafka, OpenSearch, InfluxDB, and PostgreSQL allow us to efficiently process more than ~250 TB of customer data per day.
Today, we’re excited to announce that all of our language SDKs use OpenTelemetry to keep a consistent open-source standard for ingesting our data. Building SDKs for different programming languages and frameworks can be challenging. If SDKs are implemented individually, it’s inevitable to have an inconsistent specification in the format of the data that is sent. OpenTelemetry defines a standard for how data should be sent, covering standard observability while being flexible enough to send custom data.
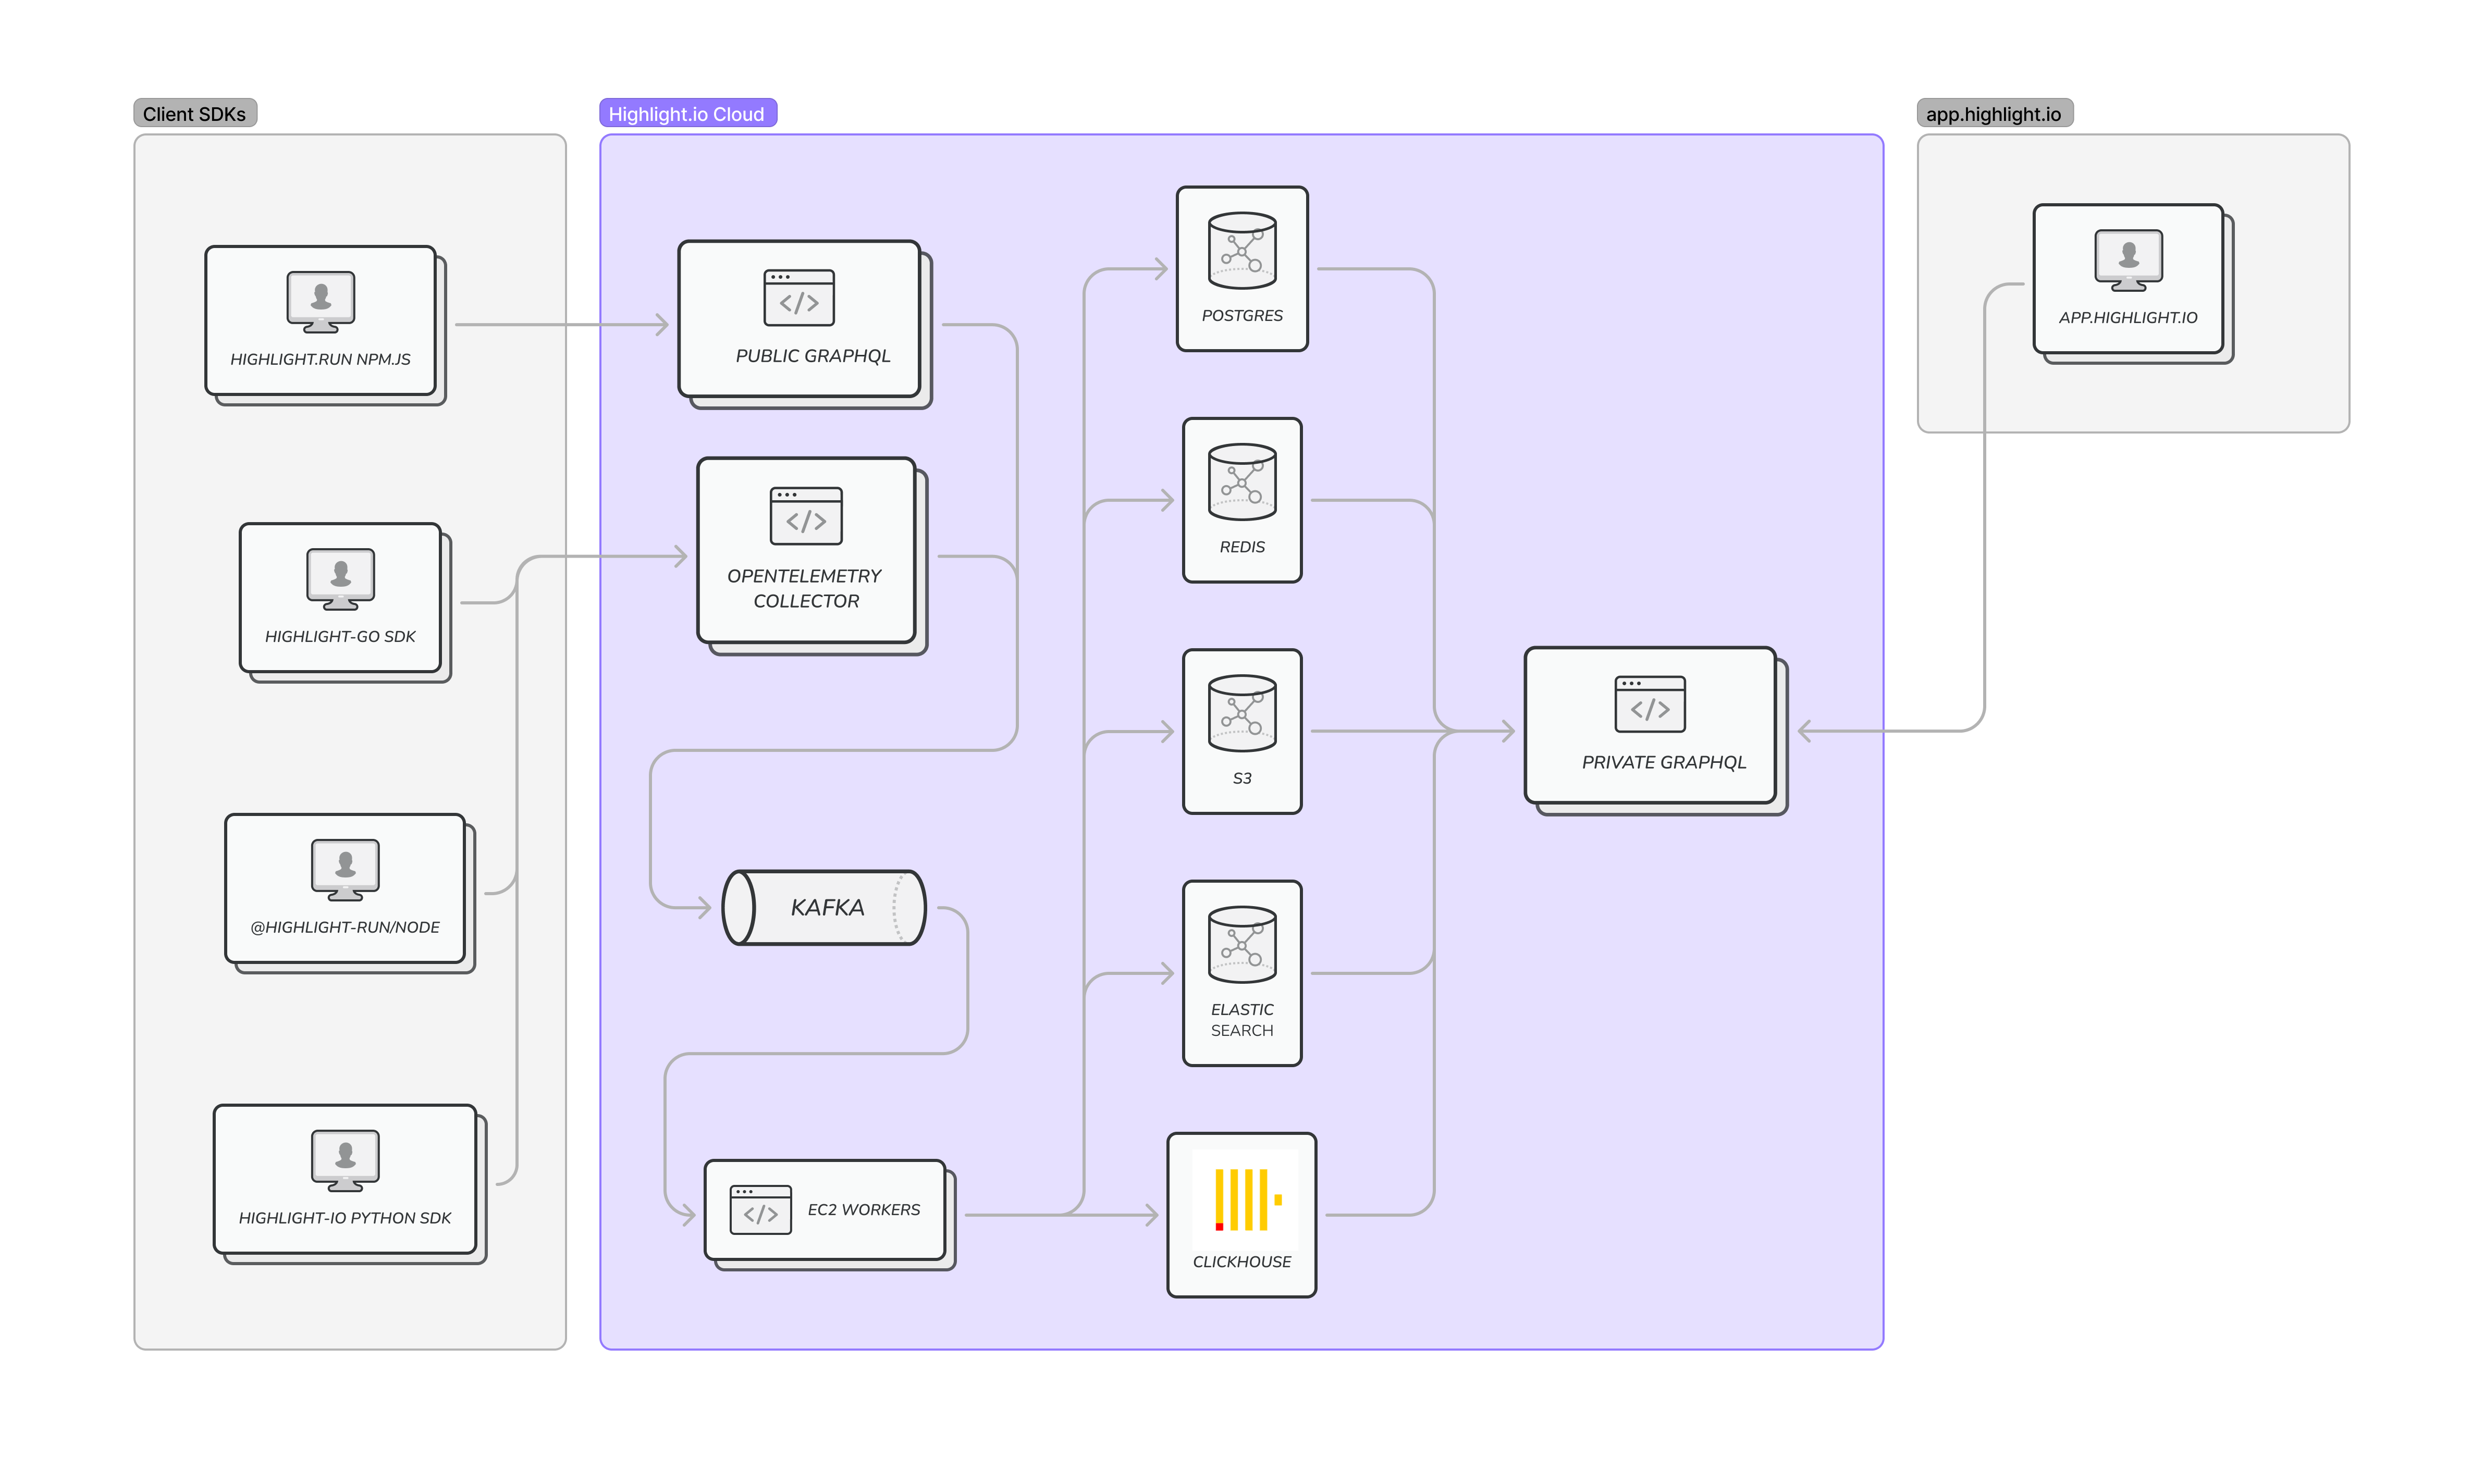
Consistent Format for Traces, Logs, and Metrics
We’ve found many of our customers to already be familiar with OpenTelemetry (OTEL) in the context of their application. Yet another advantage of using the standardized spec is that many customers are already familiar with OTEL or have it instrumented. For a customer that already uses OTEL SDKs, sending data to LaunchDarkly is a breeze: as simple as configuring data export to the LaunchDarkly cloud gateway. For a customer that doesn’t, it’s simple to gradually adopt OTEL by installing LaunchDarkly throughout parts of their codebase.
Efficient Batched and Compressed Data Transfer
OpenTelemetry achieves efficient data transfer through its batching and compression features, which enable the aggregation of multiple telemetry data points into a single request, reducing the number of requests needed to transmit data. Additionally, the use of compression algorithms like GZIP further reduce the payload sizes, decreasing the time required to transmit data and minimizing the network utilization.
Hosted Collector for Agent-less Deployments
Another significant benefit of OpenTelemetry is its collector, a hostable service that receives telemetry data from different sources and sends it to the backend for processing. We host the collector for you as a gateway at https://otel.highlight.io:4318. The gateway acts as an intermediary between the application and the backend, simplifying the deployment process by removing the need to install agents or other software. This approach makes it easy to integrate OpenTelemetry with any application or infrastructure component, and the collector provides features such as data filtering, aggregation, and transformation.
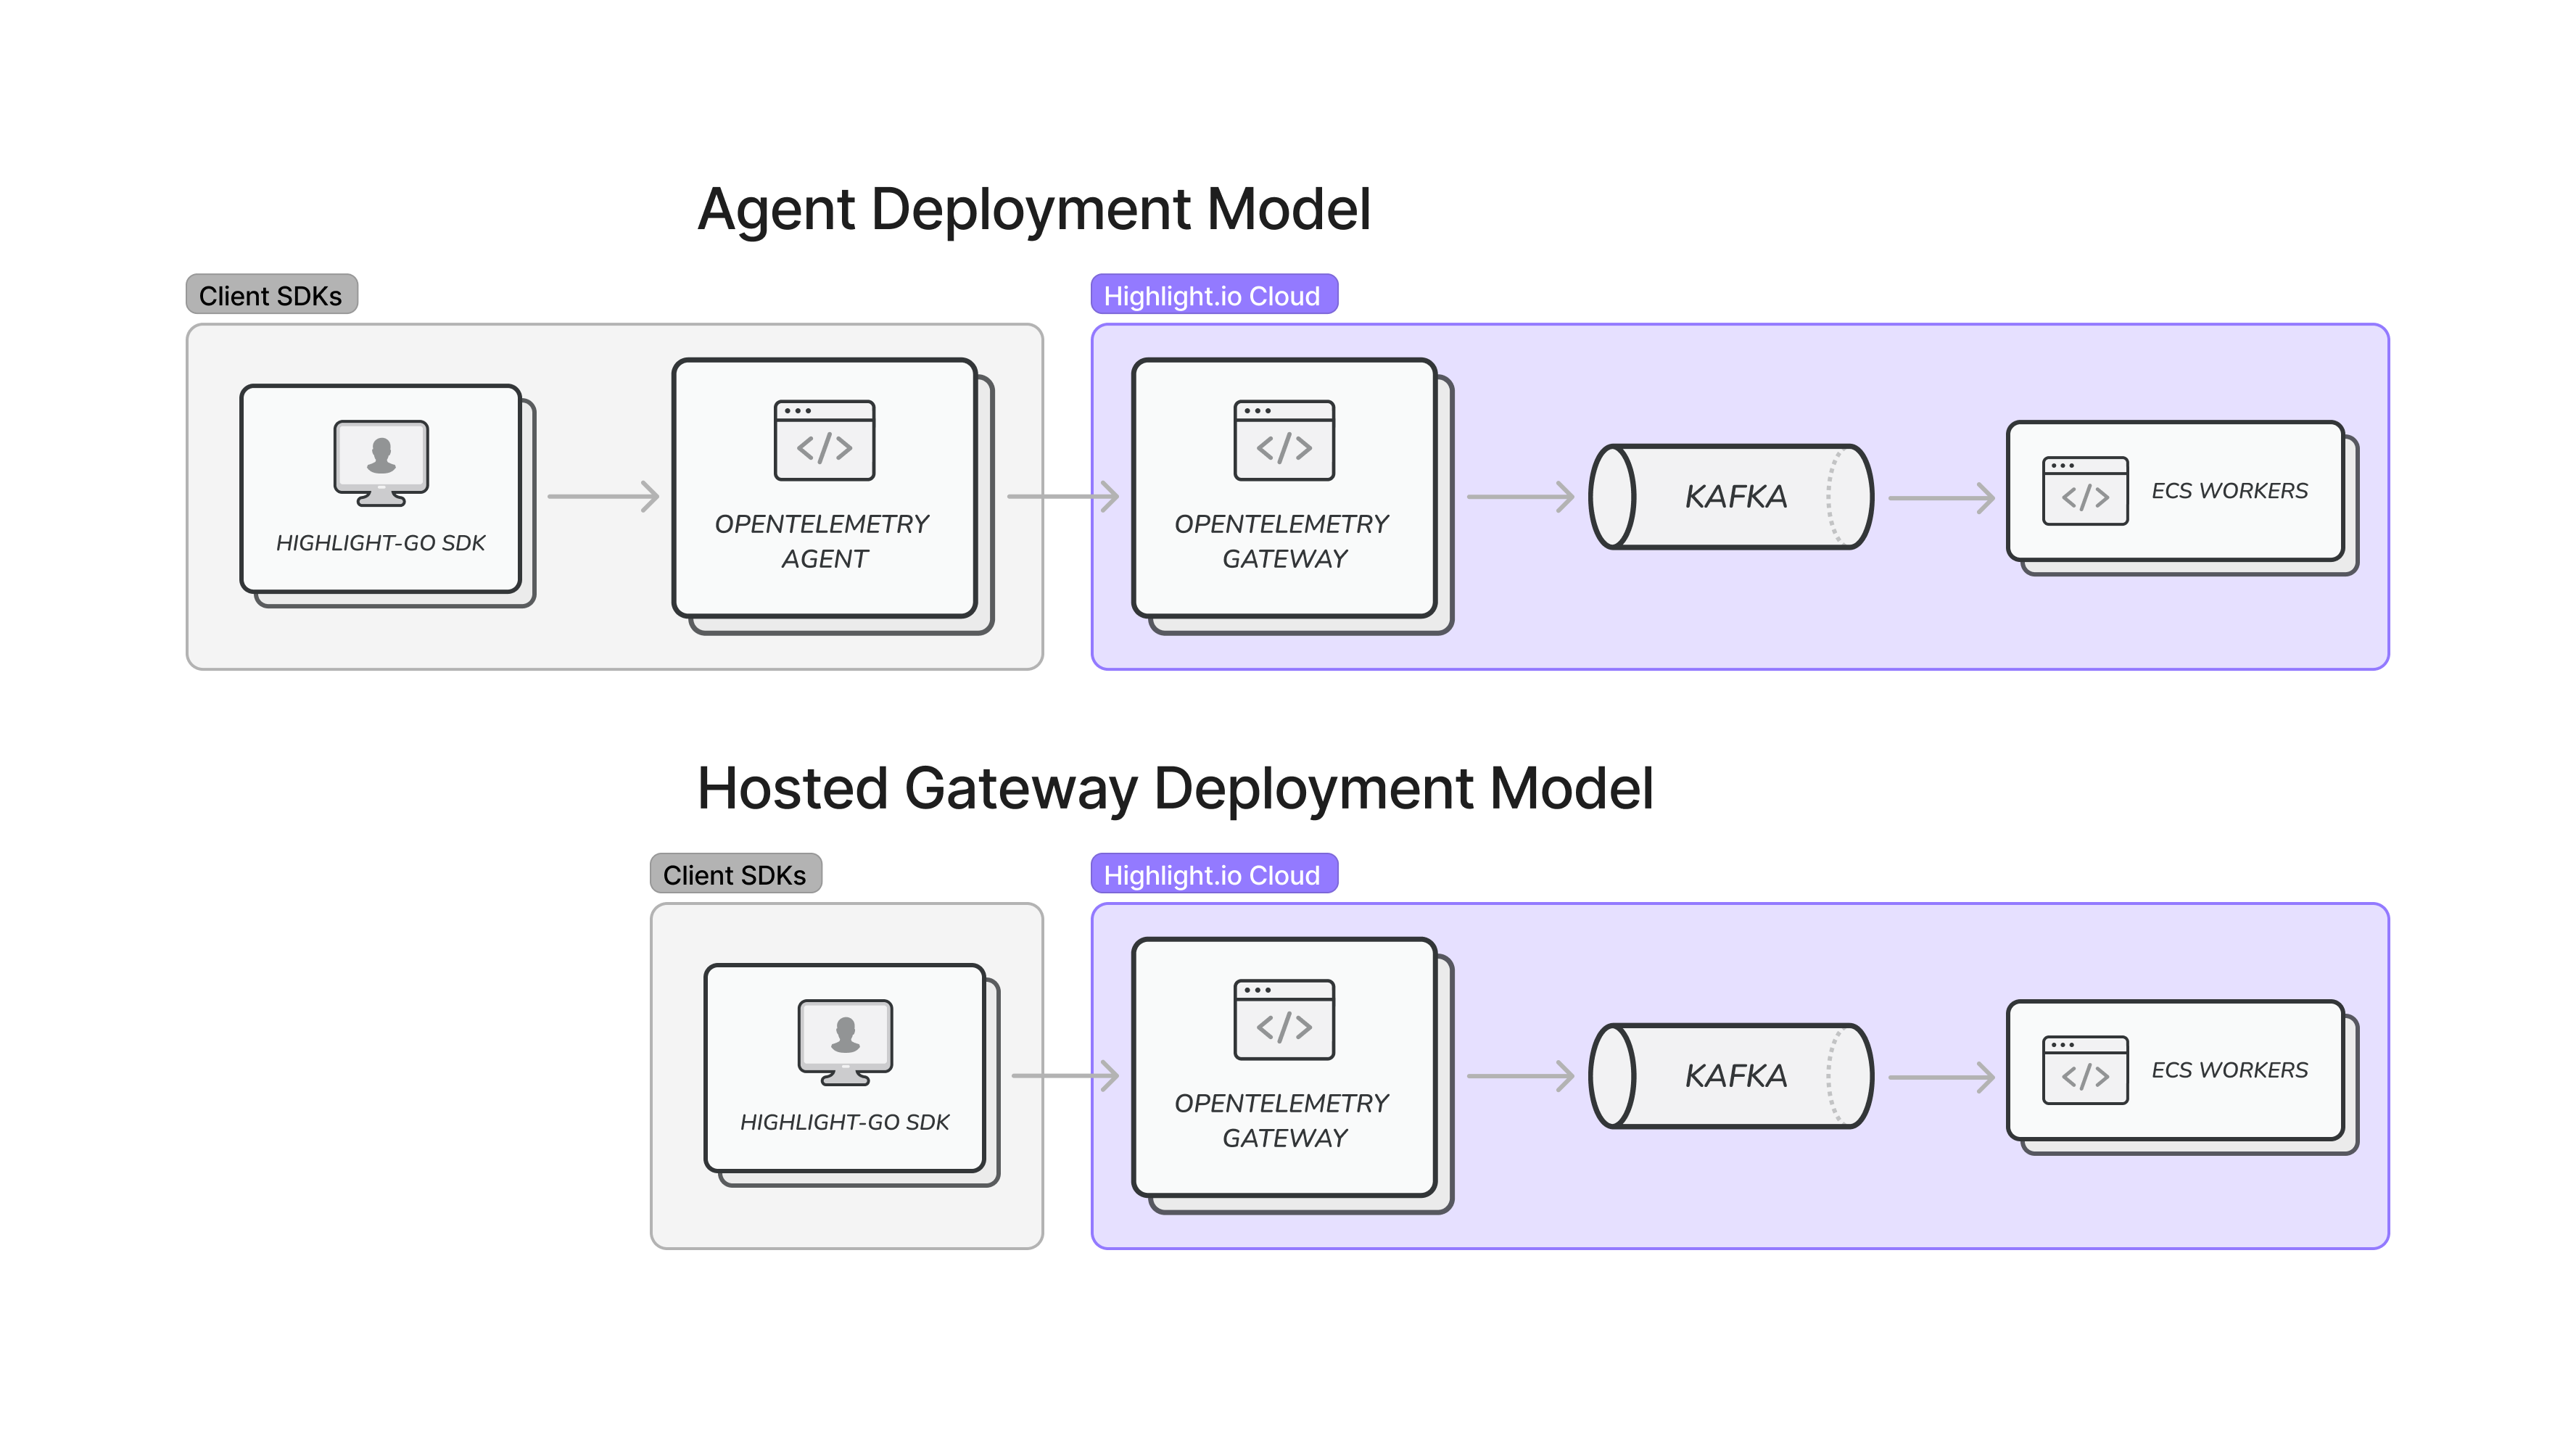
Reporting Custom Data through Trace Events
In addition to standard telemetry data, OpenTelemetry enables developers to report custom data through trace events. These events allow developers to add context and metadata to their telemetry data, making it more meaningful and informative. Developers can define their own event attributes, which can include relevant information about their application’s state, behavior, or performance. This feature gives developers the flexibility to track specific metrics or events that are unique to their application, providing insights that are specific to their needs.
For example, at LaunchDarkly, our product also tracks errors happening throughout your stack (e.g. an exception that is raised with a stacktrace pointing to the source of the issue). To support sending this kind of data, we’ve used the tracing OpenTelemetry semantic convention for reporting exceptions. Trace event attributes of `exception.type`, `exception.message`, and `exception.stacktrace` allow our tracing provider to plug in to common programming frameworks to report errors in a consistent way.
At LaunchDarkly, we are committed to using open source software for our infrastructure stack, and we believe that OpenTelemetry is an important tool for modern software development. By using OpenTelemetry, we are able to quickly build and deploy SDKs across multiple programming languages and frameworks, while ensuring that our telemetry data is collected and processed efficiently. We also value the open source community and are committed to giving back by contributing to the development of OpenTelemetry and other open source projects.