

This SDK is in early accessThe Android observability plugin is in early access. Its APIs may change before the 1.x release.
- Observability captures errors, crashes, logs, and traces. Use it to debug failures in production, watch error rates for a release, and trace network calls end-to-end. Observability automatically reports uncaught exceptions and activity lifecycle events.
- Session replay captures UI snapshots of what a user encountered. Use it when a stack trace alone doesn’t tell you why a user got stuck, and pair it with masking to keep sensitive fields out of the recording.
LDObserve method surface, and advanced distributed-tracing patterns, read the Android SDK observability reference.
Prerequisites
To complete this guide, you need:- An Android project targeting Android 5.0 (API level 21) or higher.
- The LaunchDarkly Android SDK version 5.9.0 or later.
- A build set up with Gradle (Groovy or Kotlin DSL).
- A LaunchDarkly account and a mobile key for the environment you’re testing against. Find the mobile key on the SDK keys page under Settings. Keys are specific to each project and environment. Mobile keys are not secrets and are safe to ship in client-side code.
Building UI with Jetpack Compose?Mobile keys are safe to ship in client-side code; never embed a server-side SDK key in a client app.
Step 1: Install the plugin
Add both the LaunchDarkly Android SDK and the observability plugin as dependencies. In your module’sbuild.gradle:
Step 2: Initialize the client
On Android, the LaunchDarkly client is initialized one time for the lifetime of the app, so the natural home is yourApplication subclass rather than an Activity. The Observability plugin constructor takes your application context and your mobile key:
serviceName through ObservabilityOptions:
serviceName defaults to observability-android if you don’t set it.
Step 3: Turn on session replay
Add theSessionReplay plugin to the list — after Observability, per the ordering rule from Concepts:
Gating session replay on consent or a flagIf you need to wait for user consent or roll session replay out behind a feature flag, construct it with
ReplayOptions(enabled = false). When you’re ready to enable it, call LDReplay.start(). This is the privacy-friendly path for regulated apps, so we recommend not recording until you have permission.Step 4: Decide what to mask
By default, text inputs are masked and other text is visible. Rather than memorize every flag, pick the situation you’re in. Masking is configured through aPrivacyProfile on ReplayOptions. There are several configuration options depending on your use case.
They are:
- Production — mask everything, including non-input text and views flagged by sensitive keywords.
- Local debugging — turn masking off on your own test data so you can see what’s going on.
- Balanced — mask inputs and anything matching sensitive keywords (passwords, etc.) but keep ordinary labels visible.
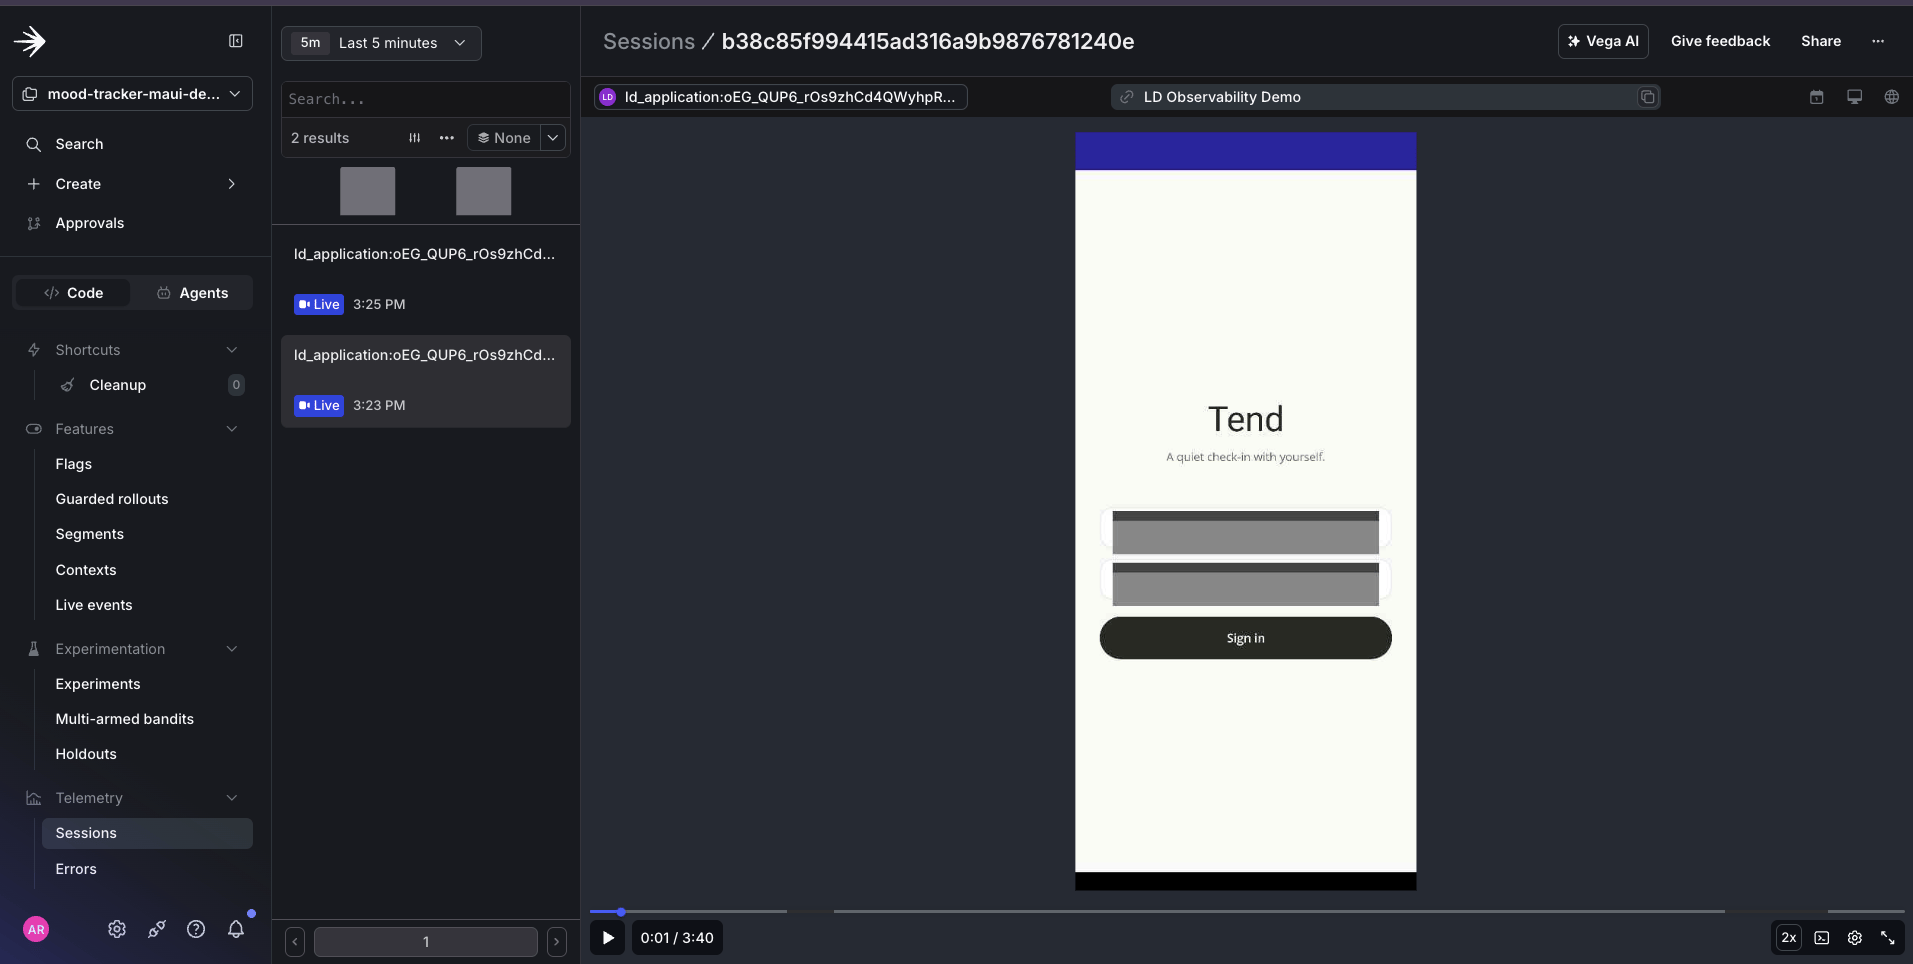
A session replay with masking applied: the password field is captured as a blank block while non-sensitive labels remain readable.
Masking a specific element
When a profile is almost right but one field is the exception, override it at the element level. The specific mechanisms to do this differ based on which UI toolkit you use:- Jetpack Compose — add the
.ldMask()modifier (or.ldUnmask()to reveal something the profile would hide). - Traditional XML views — retrieve the
ViewwithfindViewById, then call the.ldMask()extension function on the result.
Step 5: Run it and confirm data is arriving
Build and run on a device or emulator:serviceName appear there, as well as a session replay recording you can scrub through with your masking choices applied. When your service name appears in Observability, that is a confirmation that the SDK initialized successfully and is recording data.
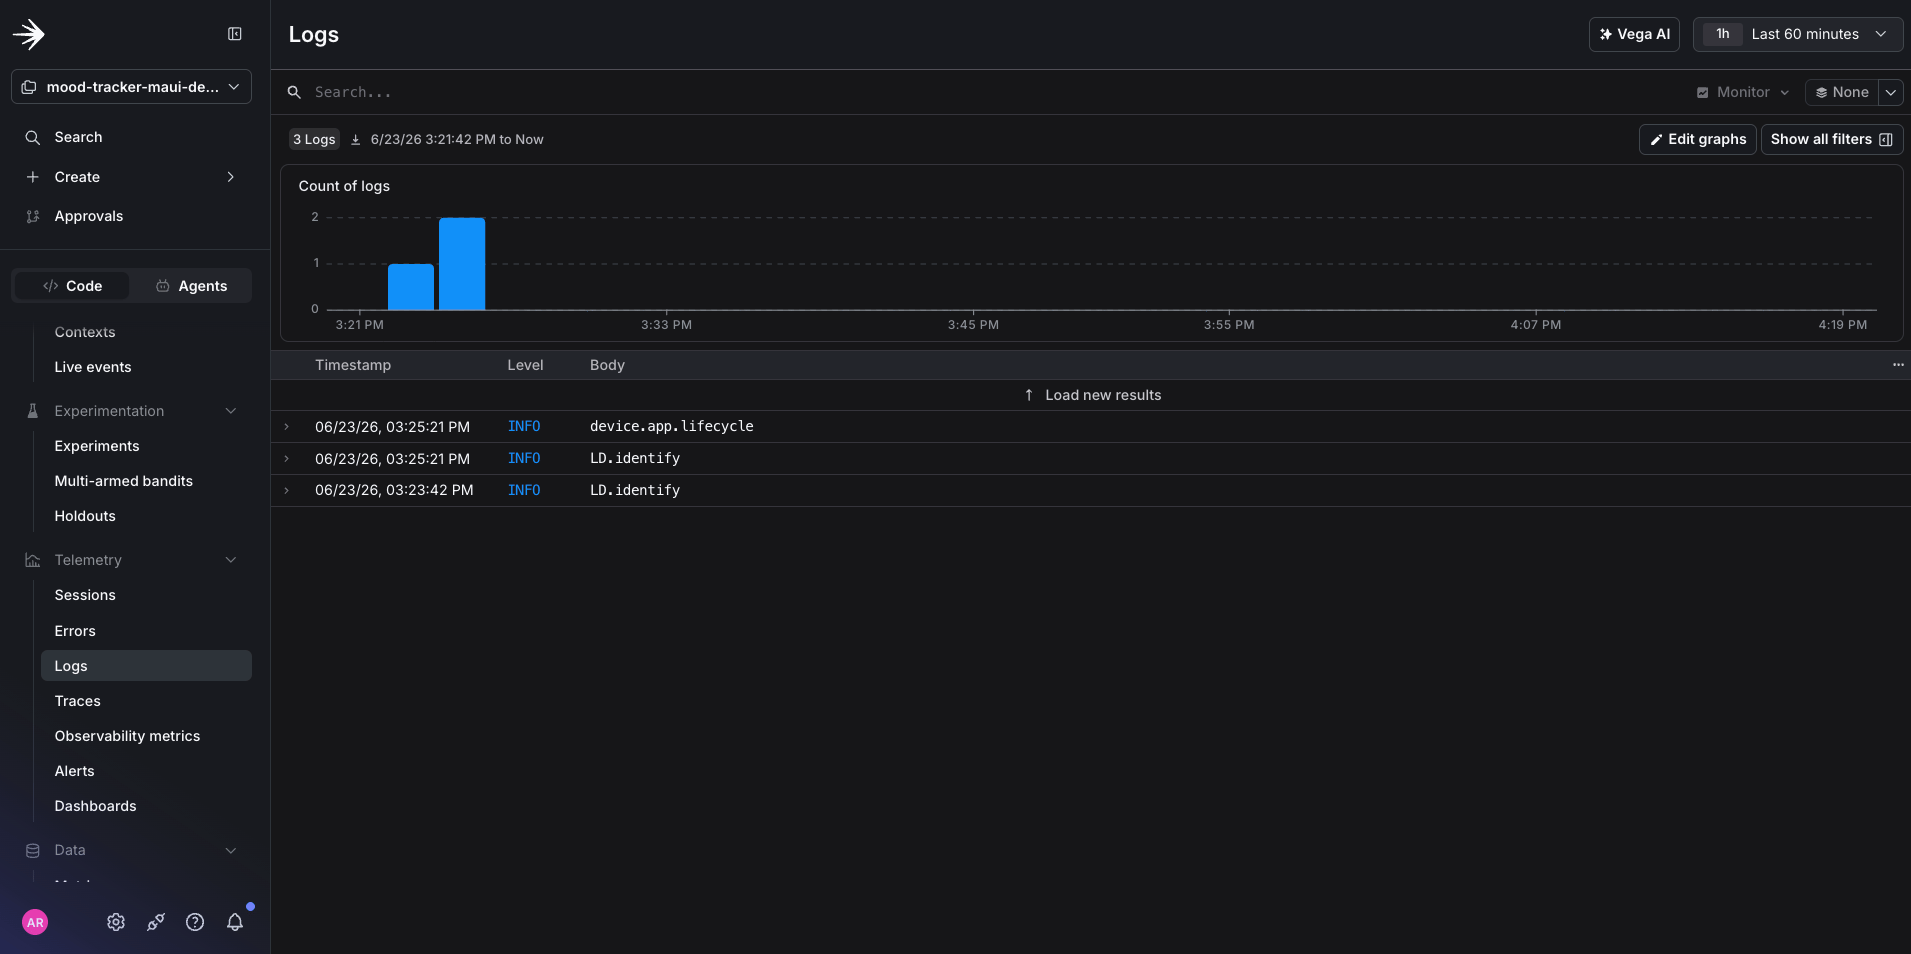
Logs and errors arriving in LaunchDarkly, attributed to the serviceName you set in Step 2.
Complete code sample
What to explore next
- Automatic HTTP and interaction instrumentation: Add the ByteBuddy Gradle plugin and the OkHttp or HttpURLConnection instrumentation dependencies to trace network calls automatically. To learn more, read the Android SDK docs’ Configure additional instrumentations.
- Every configuration field: The complete
ObservabilityOptions, includinginstrumentations,tracesApi,metricsApi, andlogsApiLevel, andReplayOptionstables are in the SDK reference documentation and in Configuration for client-side observability. - Custom and distributed tracing: Create spans with
LDObserve.startSpan(name, attributes), and propagate context across coroutines, threads, and services using the OpenTelemetryContextAPI andW3CTraceContextPropagator. - Working with your data: When telemetry is flowing, set up alerts and dashboards, then investigate issues with Vega.
Troubleshooting
Use this section to investigate issues.No data appearing
- Confirm you pasted the mobile key for the environment you’re viewing in the UI, and not for a different environment.
- Make sure initialization runs in your
Applicationsubclass and that the subclass is registered inAndroidManifest.xmlwithandroid:name. - Test the app a bit more and refresh. Data isn’t always instantaneous, so it may take a few minutes to display correctly.
Session replay isn’t recording, but observability works
- Check plugin order:
SessionReplaymust be listed afterObservability. If it’s first orObservabilityis absent, session replay logs an error and stays inactive. - If you configured
ReplayOptions(enabled = false)for consent-gated rollout, confirmLDReplay.start()is actually being called.
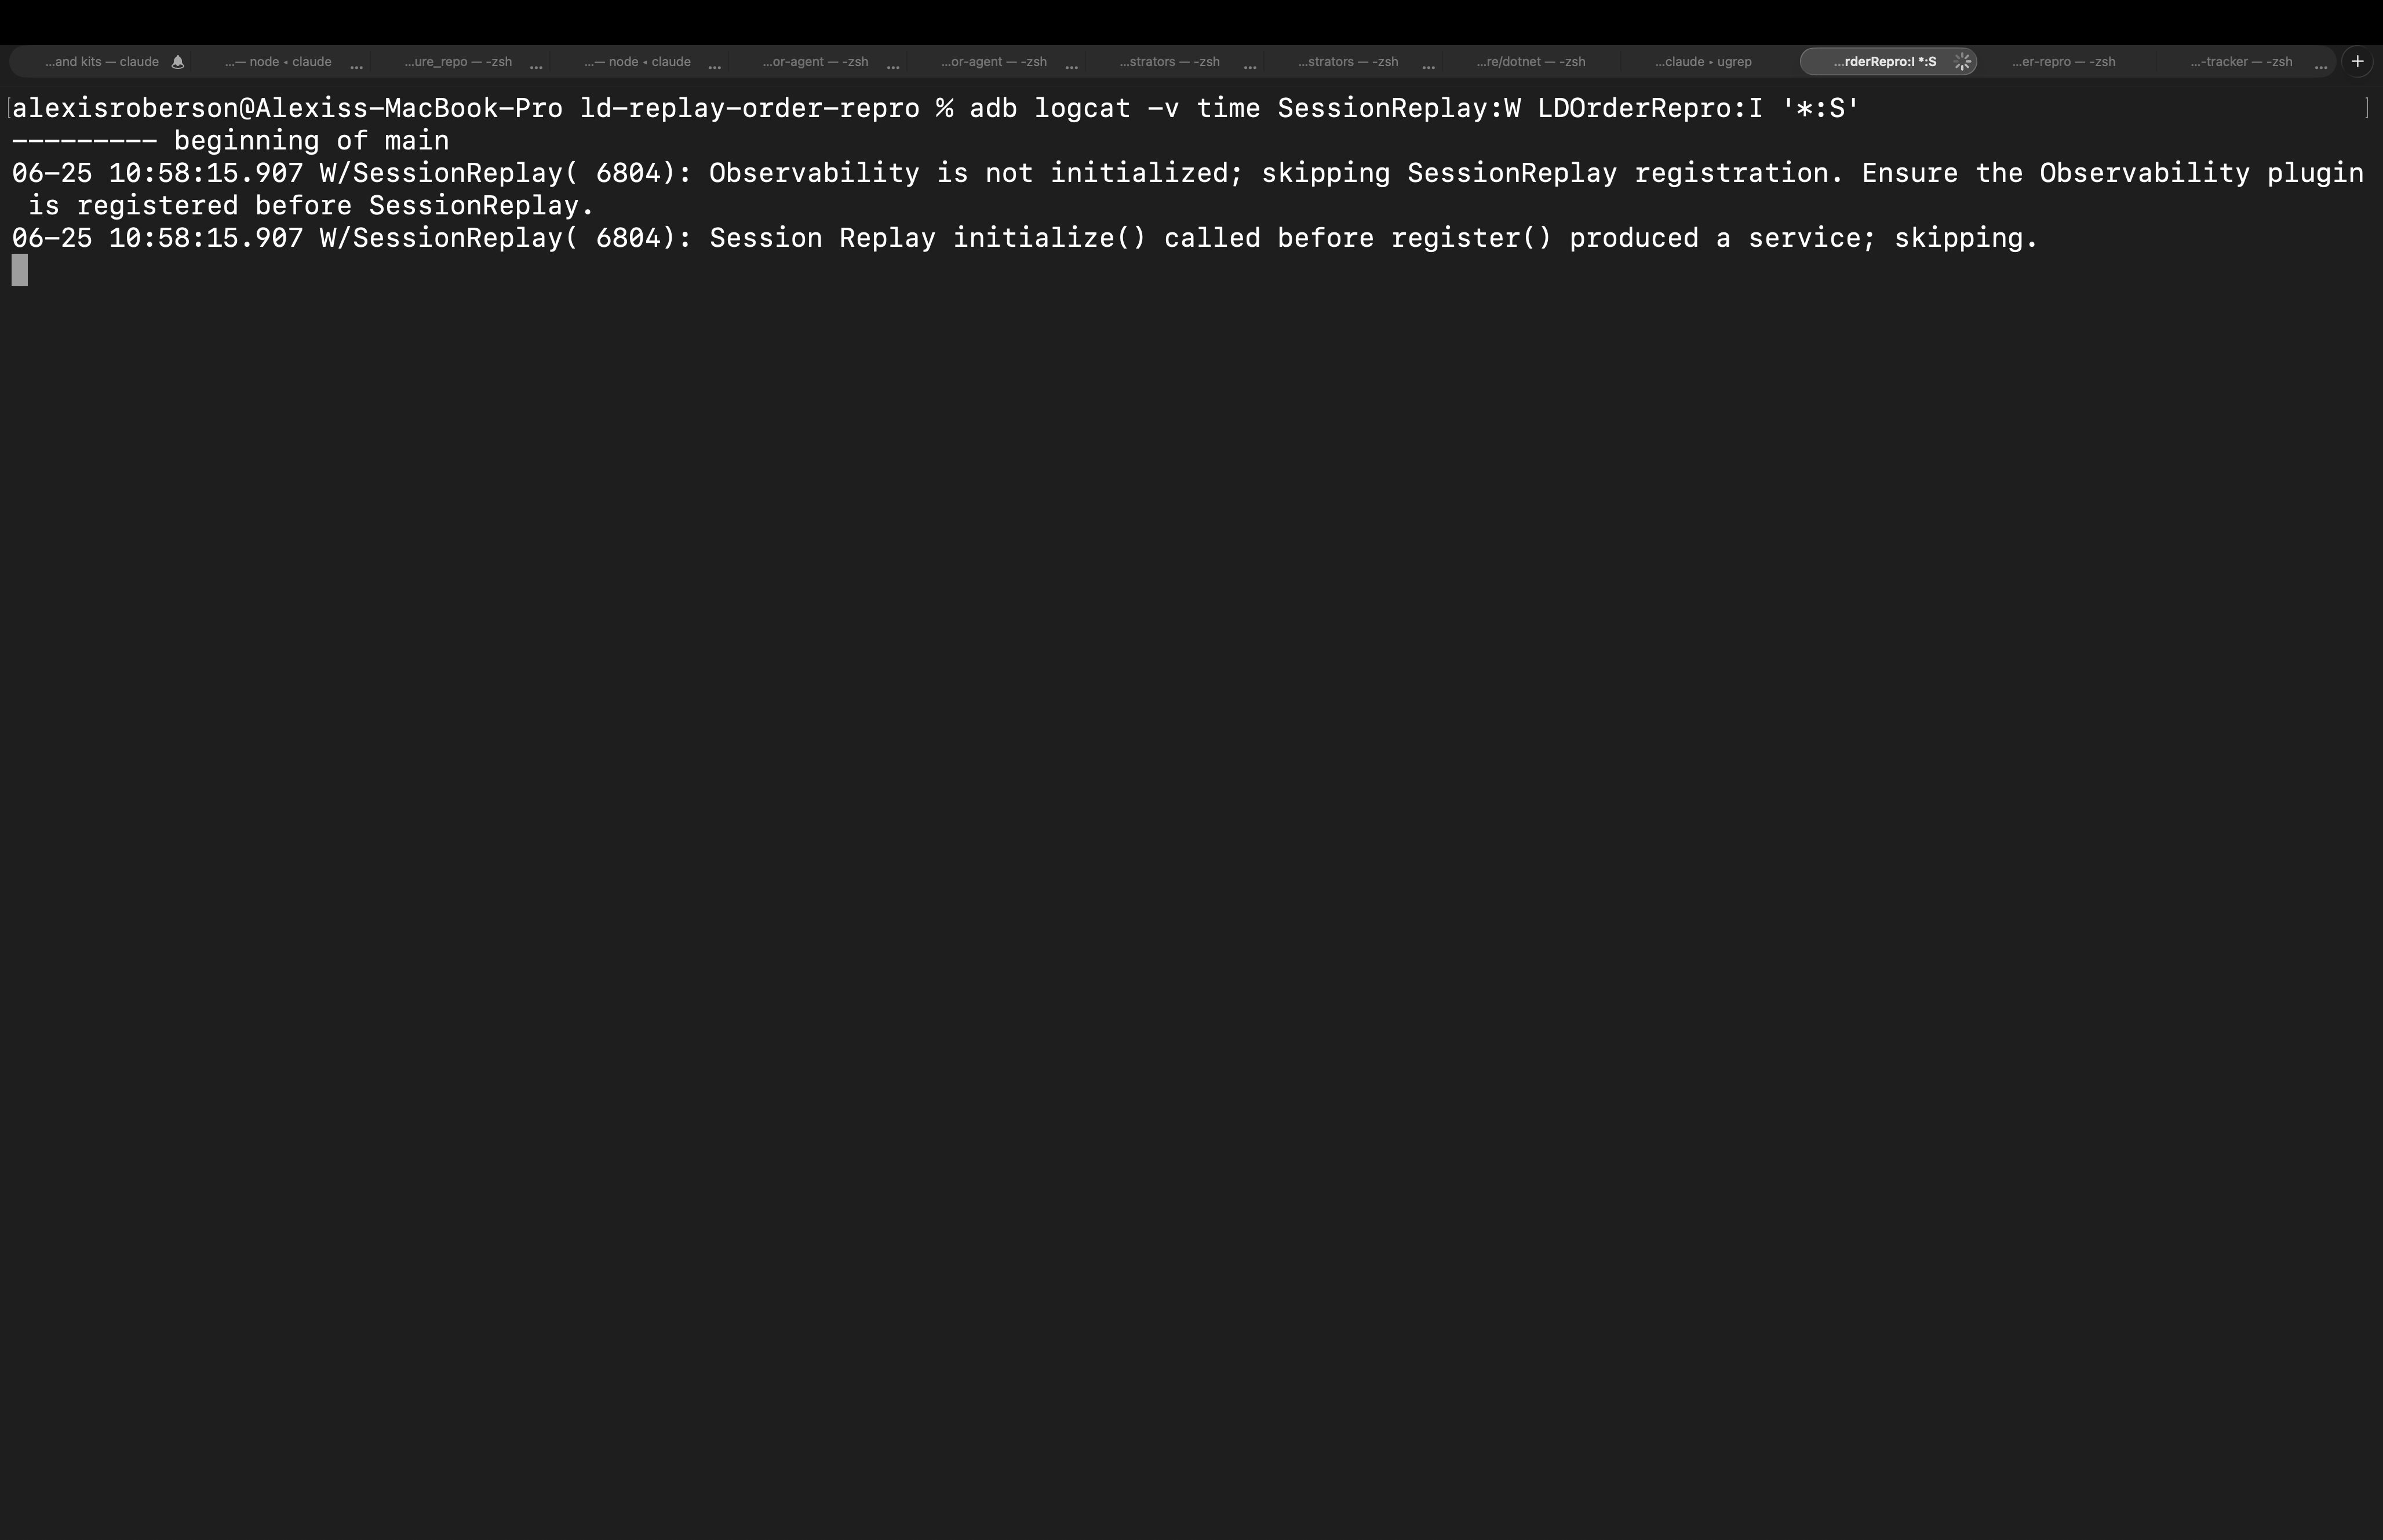
Android Observability SDK plugin ordering error
Masking not applied to a specific view
- For Compose, confirm
.ldMask()is applied as aModifieron the composable. For XML, confirm.ldMask()is called on the resolvedViewafterfindViewById.
Conclusion
In this guide, you instrumented an Android application for LaunchDarkly observability. You can now:- Capture errors, crashes, logs, and session replays from a Kotlin or Java app
- Control what session replay records through
PrivacyProfilepresets and per-element masking in both Compose and XML - Confirm telemetry is flowing in the LaunchDarkly UI, ready for alerts, dashboards, and Vega