

- The average and p90 among successes pointed at different models. The average made Haiku look faster. The p90 among successes erased that edge and tipped, within noise, to Sonnet. Neither number counted the failures.
- Capable models fail a lot of multi-step work. Within two attempts, Sonnet 5.5 failed 16% of its tasks and Haiku 5.5 failed 26%.
- A latency percentile describes only the attempts that report a duration. Dropping failures skews a comparison at any failure rate. Once more than 10% of tasks fail, a p90 of time to successful completion stops existing, and neither model has one here. At exactly 10%, the answer depends on the quantile convention.
- The comparison that holds up is success within a time budget, next to cost. Within 30 seconds, Sonnet completed 76% of its tasks successfully and Haiku 68%. Token tracking in Agent Management shows that each of those on-time successes cost about $1.33 on Sonnet and between $0.08 and $0.39 on Haiku.
- The experiment puts uncertainty around an apparent gap. Sonnet’s 9-point edge in success rate looks decisive. LaunchDarkly reports it as not significant at 170 tasks, with a p-value of 0.11. Shipping on the raw counts would have been a guess.
What you will build
The companion repository has the tasks, the checker, and the runners. You add API keys. You end up with these pieces, all in a project namedllm-p90-experiment:
- One config holding both models. Claude Haiku 5.5 and Claude Sonnet 5.5 are variations with the same 128 tools and parameters, and the application reads whichever one it is served.
- An experiment that assigns each request at random. Both arms draw from the same task pool, and interleaving reduces the chance that time drift favors one model.
- Success, latency, and cost on one results page. A conversion metric for success, a metric for p90 among successes, a 30-second metric, and the token usage the AI SDK reports automatically.
- A Python runner that plays each task, scores it with the official checker, and sends the events.
Watch the full setup and results walkthrough.
Why a multi-step workload, and why BFCL
Counting failures requires a definition of “done.” Most production telemetry cannot: the provider returned a 200, the model returned text, and nobody checked whether the job got done. The Berkeley Function Calling Leaderboard (BFCL) can. Each multi-turn task has the model call functions against simulated backends, a file system, a trading account, a ticketing system, across several user turns, and an official checker compares the end state with the ground truth. Every failure is known exactly, and anyone can rerun the same 200 public tasks. Multi-step work is also where failures pile up. In this run, tasks whose correct solution takes longer tool-call sequences were less likely to succeed: across both models, 37 of 41 tasks needing one to four calls completed successfully (90%), 85 of 111 needing five to eight (77%), and 12 of 18 needing nine or more (67%). The leaderboard shows a similar gap. In the pinned BFCL V4 snapshot, the previous generation of Claude models scores 86% to 89% on BFCL’s single-turn categories, scored by abstract syntax tree (AST) matching and labeled Non-Live AST, and 54% to 68% on multi-turn. The multi-turn checker also inspects system state. Treat that gap as context, not a controlled test of adding calls to the same task. BFCL is a stand-in for the agent work you actually ship: tickets, checkouts, code edits. To run this on your own traffic, swap the JSONL files for your requests and replace the BFCL check inllm_p90/scoring.py (evaluate_with_bfcl) with whatever “done” means in your product. Keep the three events: task-resolved when a task completes successfully, task-resolution-duration-ms for the time from the first model call to that moment, and task-resolved-within-slo when it completed inside your time budget. The LaunchDarkly experiment does not know or care that Berkeley wrote the checker.
Prerequisites
You need Python 3.12 or later and uv. You also need LaunchDarkly Agent Management and Experimentation, the LaunchDarkly hosted Model Context Protocol (MCP) server athttps://mcp.launchdarkly.com/mcp connected to your coding agent, and the LaunchDarkly agent skills from launchdarkly/ai-tooling. Create an API access token with project write access for tools, configs, and evaluations, plus an ANTHROPIC_API_KEY. Step 3 creates the project if needed, then you copy its test server-side SDK key.
For Cursor Agent CLI, add the hosted server to .cursor/mcp.json, authenticate, and verify the connection:
Step 1: Why p90 of time to successful completion can disappear
A p90 of time to successful completion is a seat in a sorted list. Sort 100 task outcomes and read the value 90% of the way along, counting failures as never finishing. If 19 tasks fail, seat 90 is empty. The chart still prints p90 among successes. It sorted the 81 observed durations and reported seat 73 of that shorter list. A retry does not fill empty seats by magic. If each attempt succeeds independently with probabilityp, two attempts leave (1-p)² failed. Independence is the flattering case. The tasks that fail once are the hard ones, which means the second attempt is worse than a fresh draw.
The pinned BFCL V4 snapshot lists multi-turn base accuracy with native function calling, the category this run uses, of 63.50% for Claude Haiku 4.5 and 69.00% for Claude Sonnet 4.5. Square the failure rates and you get roughly 13% and 10% still failed after two tries. Count those as final and the cheaper model has no p90 time to successful completion. The stronger one sits on the 10% line, where a finite sample cannot tell you which side it is on. Drop the failed tasks from the sample and you have changed the question.
Those are the previous generation of the same cheap-and-fast versus strong pairing, on Berkeley’s harness, region, and week. This tutorial runs their successors, Claude Haiku 5.5 and Claude Sonnet 5.5, which have no BFCL scores yet, and BFCL gives each task only its own tools while this run attaches all 128. So the numbers are a prior, not a prediction of your run. They are enough to refuse a single primary metric of “p90 of time to successful completion.”
Use three metrics instead:
- Resolution: Share of assigned requests that complete successfully within two attempts. A missing event counts as zero.
- P90 among successes: 90th percentile whole-task time among the requests that completed successfully.
- Resolved within 30 seconds: Share of assigned requests that complete successfully inside a time budget. Missing and slow both count as zero. This metric exists however many tasks fail.
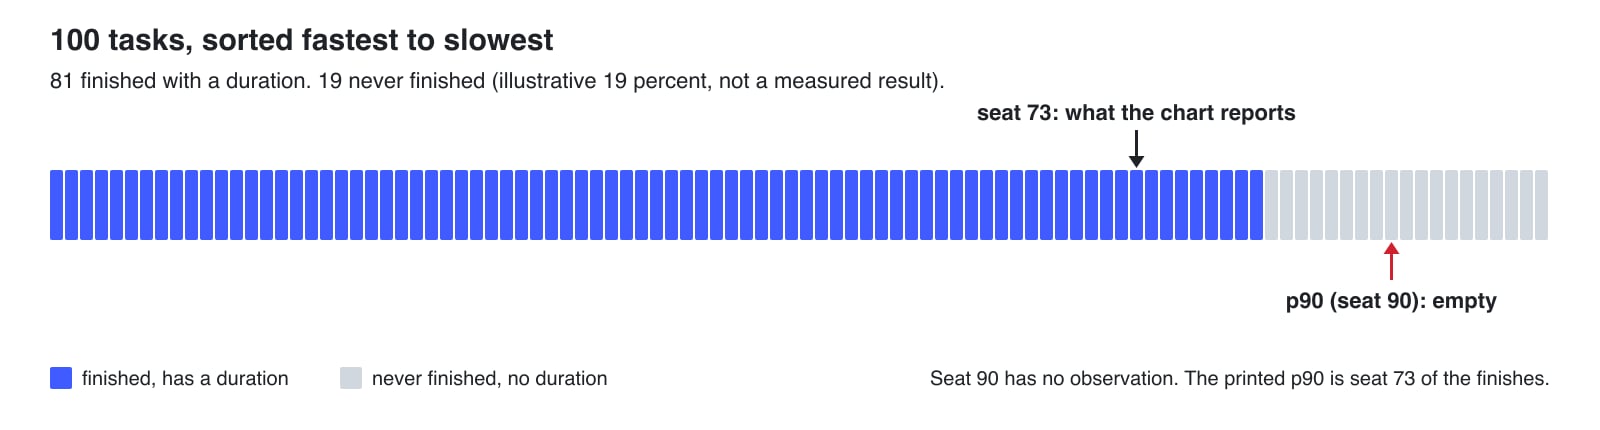
Seat 90 has no observation. P90 among successes is seat 73 of the successes.
The 10% line in a finite sample
The 10% line in a finite sample
llm_p90.analysis puts a Wilson interval on the unresolved rate. Interval wholly below 10%: a finite p90 of time to successful completion is supported. Wholly above: it is not. Crossing 10%: the sample cannot say. At exactly 10% unresolved, the answer depends on the quantile convention. This repository uses the type-7 quantile from Hyndman and Fan (1996), under which that boundary is infinite.Step 2: Clone the repository and check it offline
The tasks pin to Gorilla commit6ea57973c7a6097fd7c5915698c54c17c5b1b6c8. The export hashes source ids, sorts, and writes 30 pilot rows plus 170 experiment rows with no overlap. data/provenance.json stores the hashes.
uv run ruff check . should report no findings.
LD_OPERATOR_TOKEN and ANTHROPIC_API_KEY. LD_OPERATOR_TOKEN is the LaunchDarkly API access token used to create tools, attach them to variations, and write evaluation runs. Leave LD_PROJECT_KEY=llm-p90-experiment. You add LD_SDK_KEY after creating the project in Step 3.
Step 3: Create the config, metrics, and experiment
This step uses two small scripts and four agent prompts. The companion repository contains the scripts and pinned inputs. First, make sure the project exists:test environment’s server-side SDK key into LD_SDK_KEY in .env.
Create the tools and the config
tools/bfcl_tools.json holds BFCL’s 128 multi-turn functions for eight simulated backends, converted to JSON Schema by BFCL’s own convert_to_tool. The file trims two descriptions to fit the LaunchDarkly 1,024-character description limit and uses lowercase snake_case keys, the required format for tool keys. This creates them in Agent management → Library → Tools and skips any that already exist:
tools parameter, and the runners supply only the code that executes each call on BFCL’s backends. To change a model or a tool, edit the variation in Agent Management. The next request picks it up.
Every task gets all 128 tools. Picking the right one out of the clutter is part of the test. BFCL itself offers each task only its own backends’ tools, about 28. Anthropic’s tool search could defer most definitions and load them on demand, but that turns a failure into either a missed search or a bad call. That is a separate experiment, and it is Part 2 of this series.
The variations set no temperature, because Claude models from 4.7 on reject a non-default one. A completion variation carries at least one message. The system message is a single neutral line that adds no task guidance.
Under Agent management, select Agents, open the Completions tab, select bfcl-model-comparison, and check both variations: model, max tokens, and the attached tools.
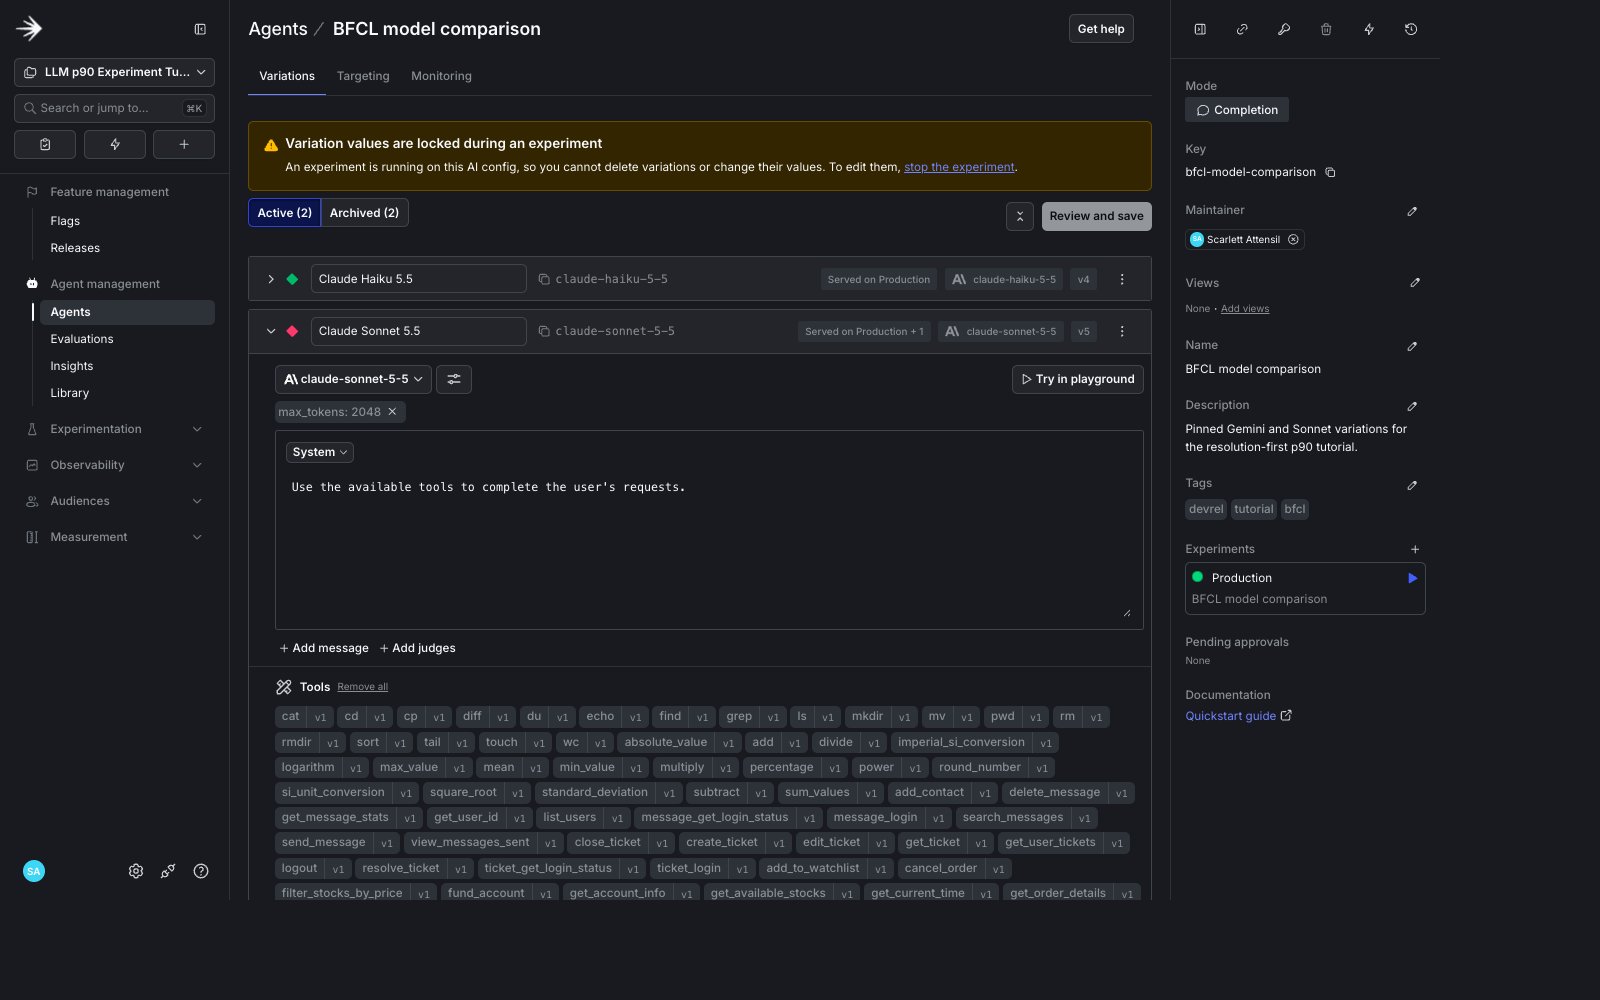
The current Agent Management config page. Captured in the project's production environment; the steps in this tutorial use test.
Register the request context kind
A new project knows one context kind,user. The metrics and experiment randomize by request, and LaunchDarkly creates a context kind the first time an SDK evaluates a context of that kind. This script evaluates bfcl-model-comparison once for a request context. The script never calls a model provider and costs nothing. Here it is:
test. If it shows up in production, your LD_SDK_KEY is the production key. Swap in the test key and run the script again. Every event in Steps 4 and 5 follows that key.
Create the metrics and the experiment
Back in the agent. The skills should print the design and wait. Do not let them start an iteration.request is not an available randomization unit, mark it available as the README describes.
Open the metrics. Resolution includes every assigned request. P90 among successes includes the ones that sent task-resolution-duration-ms. Percentile analysis works that way on purpose: a percentile is defined on observed values. The conversion metric is how unfinished work stays in the experiment.
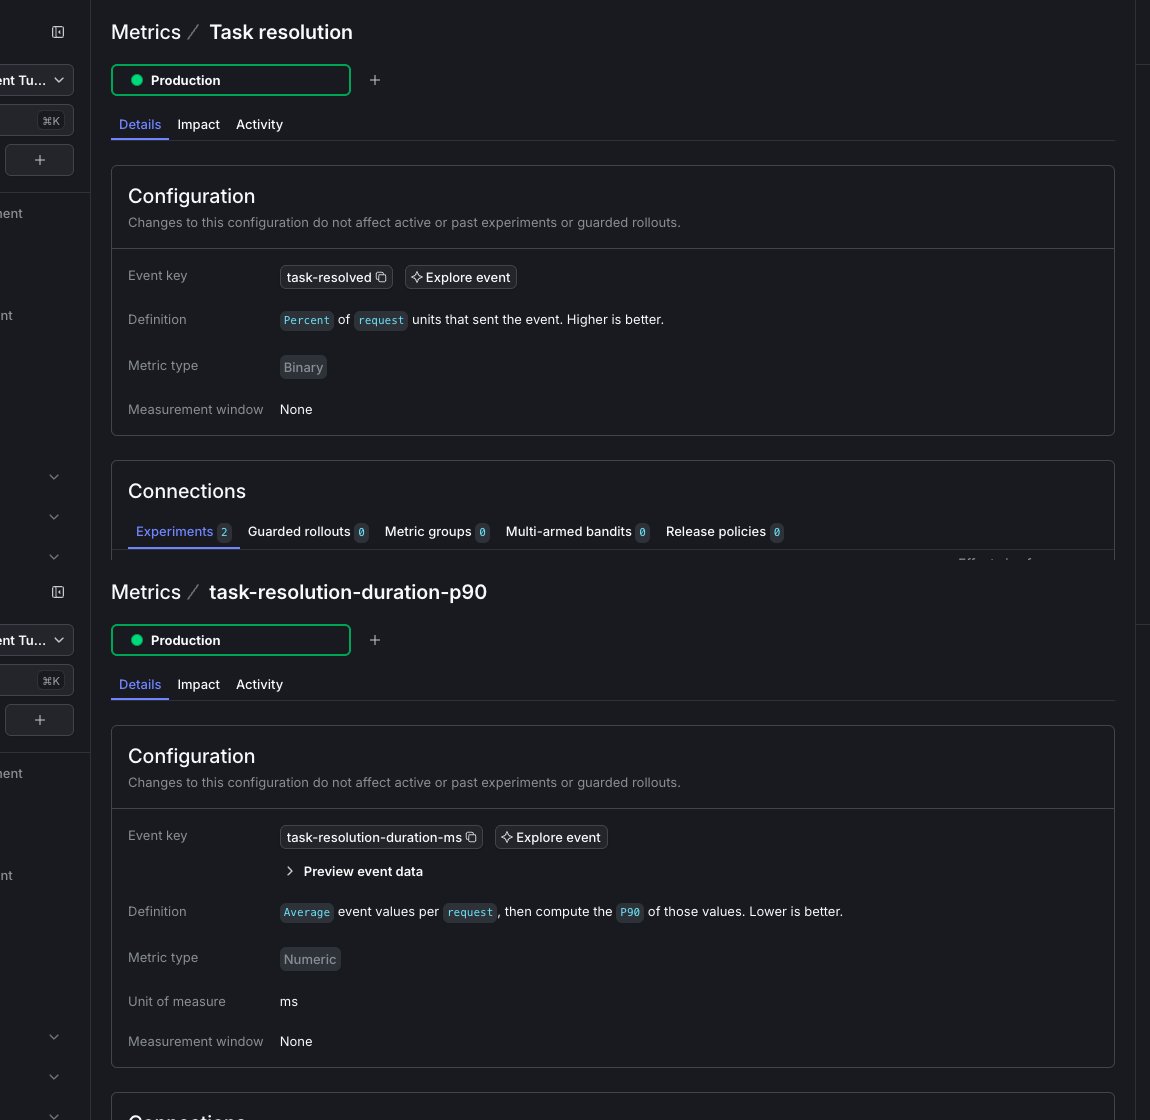
The current resolution and p90 among successes metric definitions. Captured in the project's production environment; the steps in this tutorial use test.
Step 4: Run a 30-task pilot
The pilot sends each of 30 tasks to both models once through evaluations from code. Each row is a whole multi-turn task. A wrapper handler plays it turn by turn, executing every call against BFCL’s backends, and the official checker scores the result. A task takes several model calls, not one. Pairing is the right design for an offline calibration: task difficulty dominates the variance. Those 30 rows never enter the experiment analysis. Check one task on both models first. It is the cheapest way to find a wrong key or a missing tool before you pay for 30: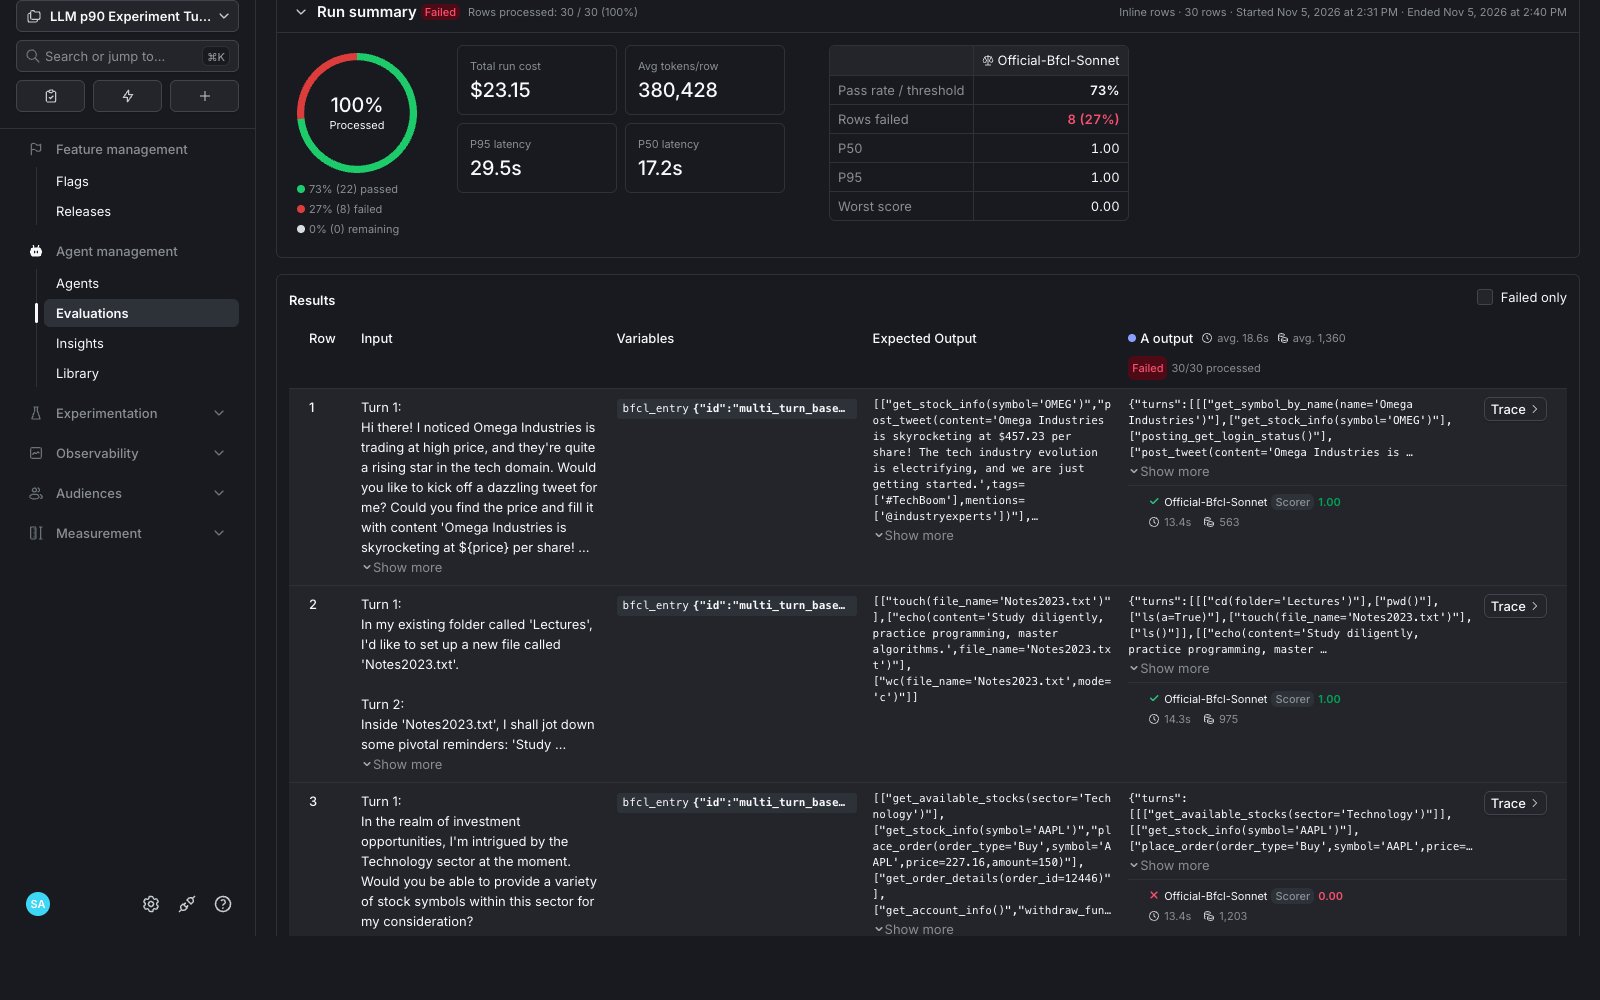
A 30-row calibration run in the current Evaluations UI. Your five-row pilot uses the same summary and results table.
Step 5: Prove the events land, then run 170
Open the draft experiment first.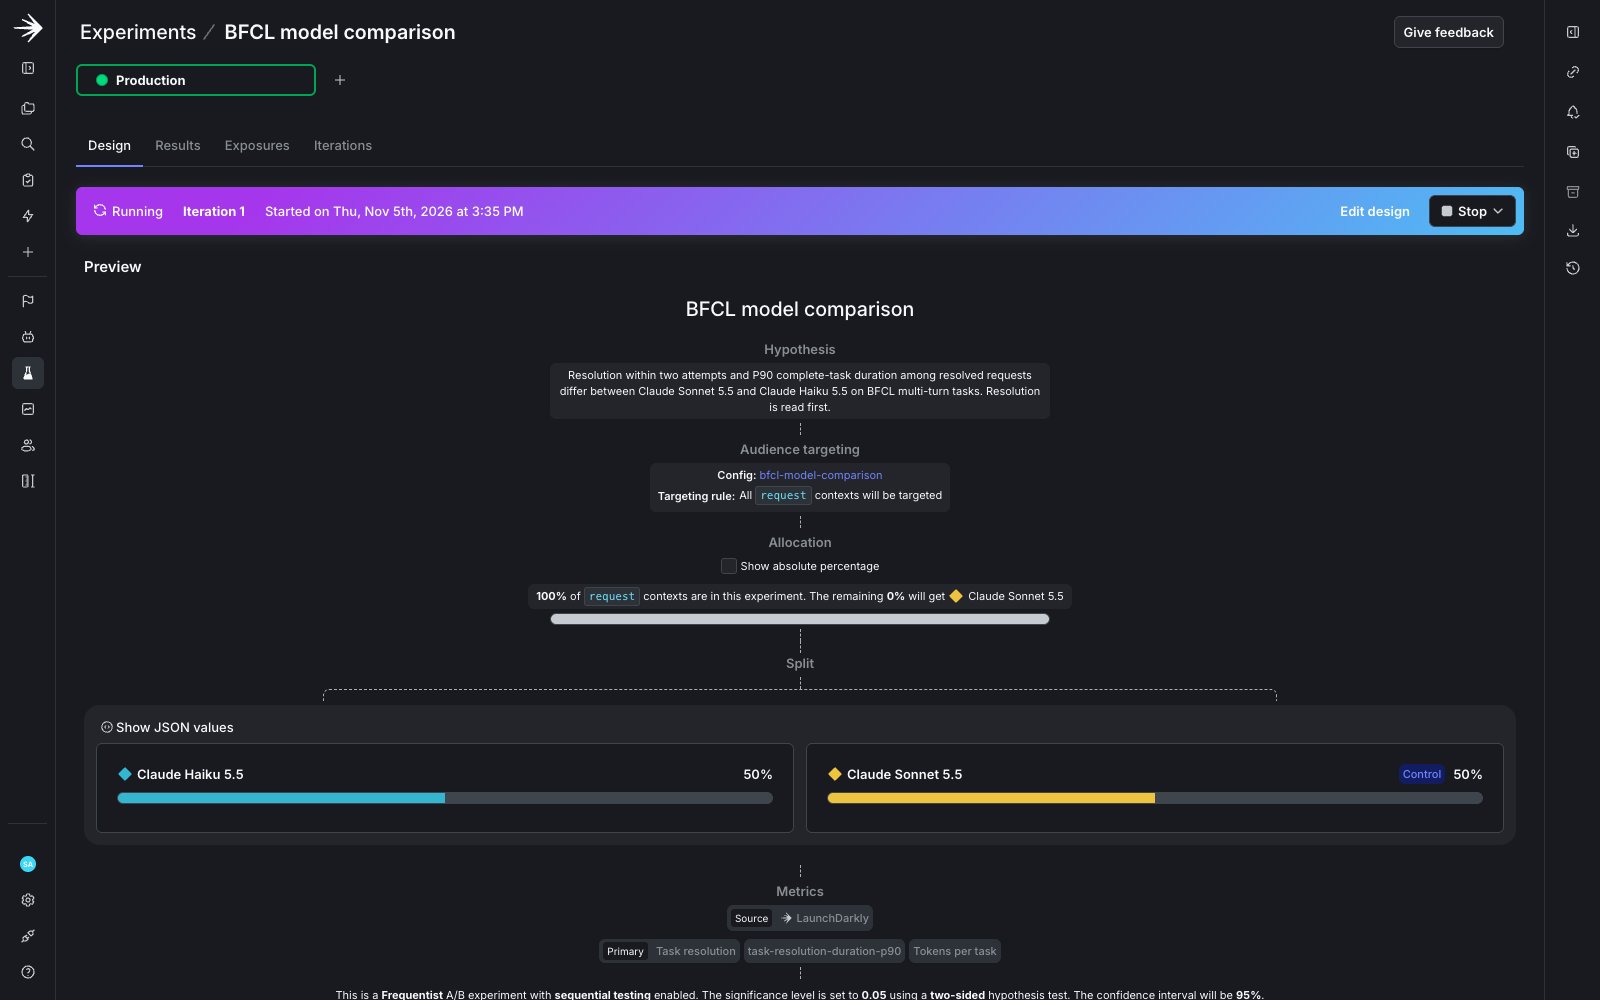
The same design after the measured run started. Before you start yours, the status bar should say Ready to start.
resolved=True or resolved=False per task. The three custom task events fire only on a success, and task-resolved-within-slo requires that success to take no more than 30 seconds. You need at least one success inside 30 seconds to observe all three keys. If you do not get one, rerun with --tasks 10 --output logs/smoke2.jsonl. The first five repeat and the next five are new. Exposure and autogenerated AI telemetry still arrive for every SDK evaluation.
LD_SDK_KEY pointed at the wrong environment. The SDK will accept the events anyway. They just land somewhere you are not looking.
Start the iteration. Before spending the full budget, ask the agent:
--confirm-paid-run is required because this spends provider budget. For each task, LaunchDarkly picks the variation. The runner plays the task turn by turn with that model, executing each call against BFCL’s backends, then scores the run with the official checker. On failure it restarts the task once from its initial state, with the checker’s error type and message added to the first turn. For method-order errors, BFCL’s message can name a missing tool method. It never includes the expected arguments, output values, or judge critique.
logs/confirmatory.jsonl. Unresolved counts in Step 6 come from that file.
If the process stops after writing N rows, keep the same iteration and request keys. Resume the remaining rows in a new output file:
N with the line count of the first output. Keeping the same request keys preserves each task’s original assignment. Combine the two logs before running the local analysis.
What we held constant
What we held constant
protocol.json also records streaming off and prompt caching off. Provider calls use the Anthropic Python SDK defaults: a 10-minute timeout and up to 2 automatic retries on rate limits, server errors, and dropped connections. Retry time counts toward the task’s duration, the same way it would for a user waiting on the answer. An error that survives the retries stops the run, and no events are sent for that task.All 128 tool definitions go out on every call, with no tool search and no prompt caching. That’s why the bill grows with tool count, and it’s the first thing to change if you run this on your own traffic.The 170 is fixed before the first confirmatory call. We do not stop early. LaunchDarkly still analyzes percentile metrics with frequentist sequential methods, which is why opening the results page mid-run does not invalidate the estimator. It also does not change the stopping rule. The in-app sample size calculator is built for fixed-horizon means. Size a percentile run like this one from the pilot cost.Request randomization is here because this is a production-shaped experiment. Interleaving makes it less likely that time drift favors one arm, but it does not guarantee identical task mixes. For a purely offline bake-off, the paired pilot design is more efficient. Do not describe the 170 as paired. The experiment analysis in LaunchDarkly treats each request as independent, not paired.Step 6: Read the results
Open the experiment after the runner exits. Resolution first, then p90 among successes. The companion repository includes the 170 source rows, thedata/confirmatory_results.json aggregates, and a LaunchDarkly resource snapshot.
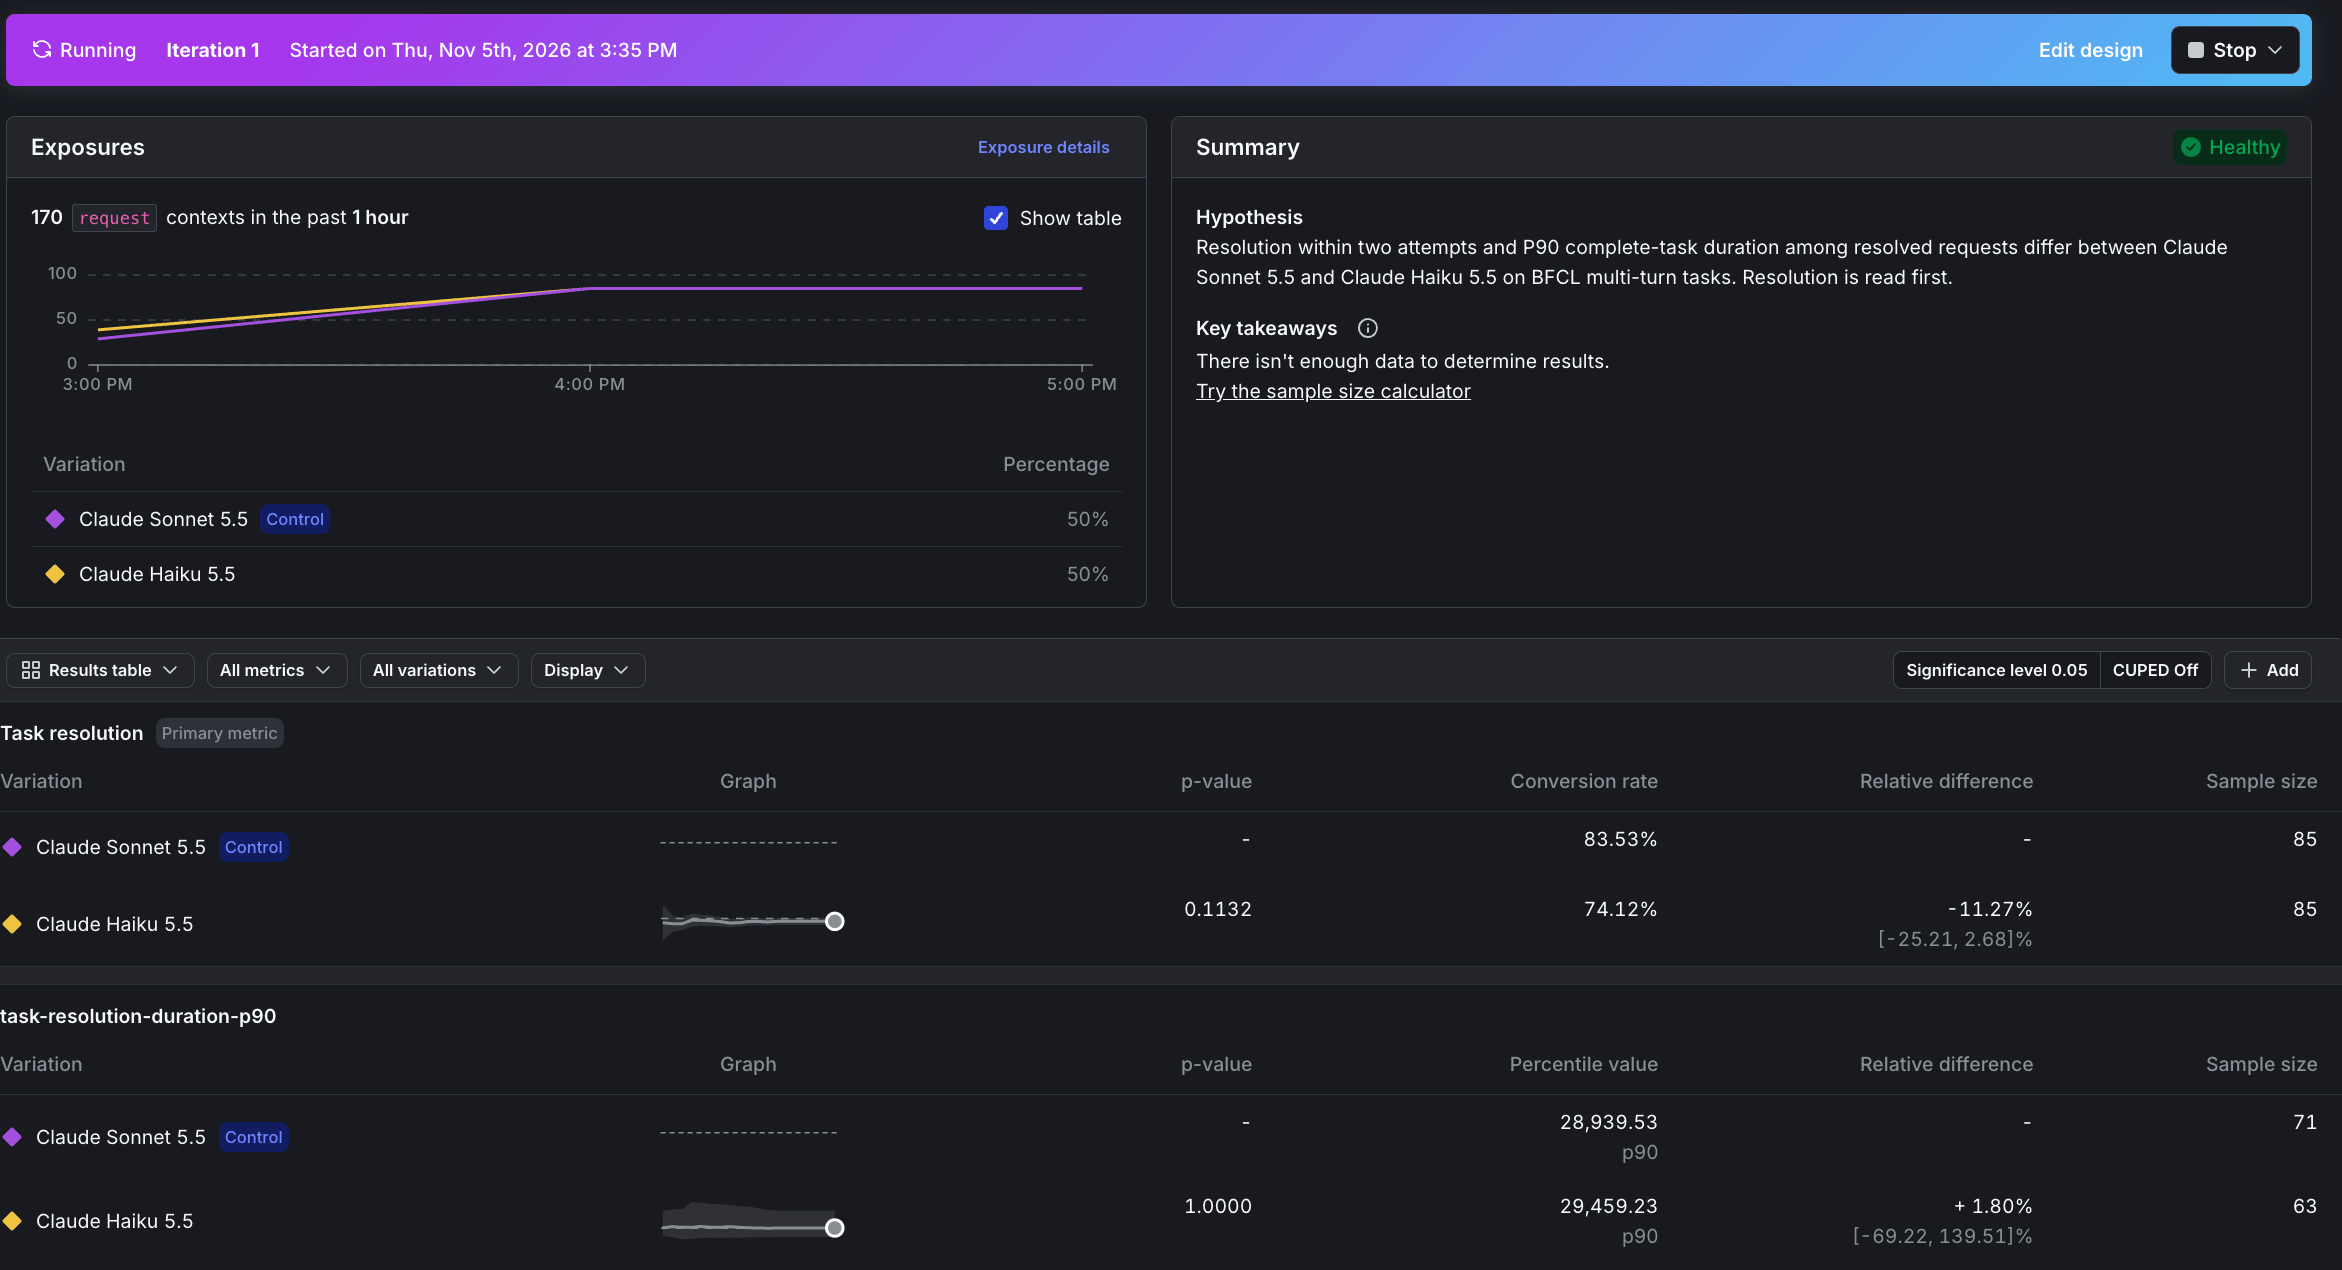
Pinned results for the 170-task iteration, captured before a later unrelated exposure. This screenshot matches the hashed results artifact.
summarize_trials gives Haiku 29.3 seconds from the same log. It uses the type-7 quantile, and the percentile estimator in LaunchDarkly lands slightly differently.)
The same comparison is available from your coding agent through the MCP server. Ask:
task-resolved-within-30s sits on the results page next to the other two. In the run shown here, the metric was added after the fact. These figures come from logs/confirmatory.jsonl:
| Resolved within | Haiku 5.5 | Sonnet 5.5 |
|---|---|---|
| 20 seconds | 48% | 54% |
| 30 seconds | 68% | 76% |
| 45 seconds | 73% | 81% |
| Haiku 5.5 | Sonnet 5.5 | |
|---|---|---|
| Generations, one per user turn | 427 | 390 |
| Tokens per task | about 518,000 | about 503,000 |
| Cost per task | $0.05 to $0.27 | $1.02 |
| Cost per task resolved within 30 seconds | $0.08 to $0.39 | $1.33 |
What this means for your failure rate
The rule is short. Dropping failures skews a latency comparison at any failure rate, and past a point it removes the percentile altogether. If a share f of your tasks fail for good, only the percentiles below 1 minus f of time to successful completion exist. Fail more than 10% and your p90 of time to successful completion is gone. At exactly 10%, the result depends on the quantile convention. This repository’s type-7 definition returns infinity. Fail more than 20% and your p80 goes with it. A duration metric alone cannot tell you which side of that line you are on, because failed tasks send no duration. The success-rate metric beside it can. So measure the failure rate before you compare latency:- Define done and record it. Send
task-resolvedonly when a task is verifiably complete, not when the provider returns. In LaunchDarkly it becomes a conversion metric that counts every assigned request. Failures stay in the comparison. - Put success, latency, and cost on one experiment. Read success rate first, with p90 among successes beside it and cost from the tokens the AI SDK already reports. Let the experiment quantify how uncertain each difference is.
- Choose on success within a time budget, next to cost. That pair answers the question you actually have: which variation completes the most tasks successfully, quickly, for the money.
Ship the decision with a guarded rollout
If the experiment points to a variation, shipping it is a config change. Stop the iteration and set the config’s default rule to serve that variation. Every application that reads the config picks up the new model on its next evaluation, with no redeploy. A guarded rollout protects that switch. It serves the new variation to a growing share of traffic, watches the metrics you choose, and can roll back automatically when one regresses. Usetask-resolution as the guardrail. A model or prompt change that starts failing more tasks then rolls back before it reaches most users, even if its p90 among successes looks better. A guarded rollout and an experiment do not run on the same config at the same time. Start the rollout after you stop the iteration. Guarded rollouts are available on select plans.
Run this on your traffic
Put your requests in place ofdata/bfcl_confirmatory.jsonl, or send live traffic through the same config. The experiment works unchanged on production requests: point evaluate_with_bfcl in llm_p90/scoring.py at your own definition of done and keep the track() calls. To design the same kind of experiment for your own application, the launchdarkly-experiment-guide skill reads your codebase and LaunchDarkly account, proposes a hypothesis and a metric, and drafts the experiment for you to review.
A later prompt change that drops resolution from 98% to 83% will look like a latency win on p90 among successes if you only chart durations. The resolution metric, on an experiment or as a guarded-rollout guardrail, is what stops you from shipping that.
Part 2 picks up where this leaves off. Haiku is the cheaper model per on-time success, but it fails one task in four, and every request resends all 128 tool definitions. Anthropic’s tool search loads tool definitions on demand instead of sending all of them on every call. Can it make the cheaper model complete more tasks successfully, faster, for less? Part 2 holds the model fixed and runs that experiment.