Catch your first silent AI failure with Vega AI in under 10 minutes

Published March 13, 2026

portrait of Alexis Roberson.

by Alexis Roberson

Time: ~10 minutes

What you’ll build: A small AI agent that silently fails, which triggers an alert that Vega will register and investigate for you

What you’ll learn

Most AI failures don’t announce themselves. The function returns, the response looks well-formed, but the response is completely fabricated. What you don’t know is that your agent’s tool call came back empty and the LLM filled in the gap.

Or maybe you did have an idea something was wrong by looking at the logs or observability metrics, still it feels like only a portion of the picture. This is where Vega enters the chat.

Vega is LaunchDarkly’s AI assistant that automatically investigates alerts. And when a threshold is breached, Vega correlates logs, traces, and metrics to identify root cause - no manual triage required.

In this tutorial you’ll see how you can setup Vega for end to end debugging by:

  1. Adding a metric to an AI agent that exposes silent failures.
  2. Setting up an alert on that metric with Vega Investigations enabled.
  3. And finally, triggering the failure and watching Vega handle the investigation and propose remediation steps.

By the end, you’ll have seen a complete Vega investigation summary in Slack and understand the instrumentation pattern that makes it possible.

All code for this Vega demo can be found here.

Prerequisites

  • A LaunchDarkly account on the Developer or Foundation plan with observability access
  • The LaunchDarkly observability SDK installed in your project
  • A Slack workspace connected to LaunchDarkly notifications

Setup

Before you begin, set up the demo project:

Starting setup
$# Clone the repo and enter the directory
$git clone https://github.com/arober39/ai-agent-order-history
$cd ai-agent-order-history
$
$# Create a virtual environment and activate it
$python3 -m venv venv
$source venv/bin/activate
$
$# Install dependencies
$pip install anthropic python-dotenv
$
$# Install LaunchDarkly observability SDK (required for logs, traces, and metrics)
$pip install launchdarkly-server-sdk launchdarkly-observability opentelemetry-api
$
$# Add your API keys
$cat <<EOF > .env
$ANTHROPIC_API_KEY=your-anthropic-key-here
$LD_SDK_KEY=your-launchdarkly-sdk-key-here
$EOF
The agent runs in demo mode without LD_SDK_KEY. Metrics are tracked locally and printed to the console. Add the key when you’re ready to see logs, traces, and metrics in your LaunchDarkly dashboard and trigger Vega investigations.

Connect Slack to LaunchDarkly

When your alert fires, LaunchDarkly sends the notification to Slack. That’s how you find out something is wrong without staring at a dashboard. From that Slack notification, you can kick off a Vega investigation to get the root cause.

  1. Install the LaunchDarkly Slack app from the Slack App Directory
  2. Sign into your LaunchDarkly account from Slack with the /launchdarkly account command
  3. When you create an alert in Step 2, add your Slack channel (e.g., #on-call or #ai-alerts) as a notification destination

If you’ve already connected Slack, you can skip ahead to Step 1.

Subscribe to LaunchDarkly account via Slack

Inside the newly created Slack channel, type this command and press send to subscribe to your LaunchDarkly project. This ensures you receive Slack notifications from your alert.

/launchdarkly subscribe --project=silent-failure-detection-vega

Step 1: Add a metric to your agent

The key to catching silent AI failures is instrumenting the context going into your LLM, not just the response coming out. When a tool call returns empty and your agent quietly fabricates an answer, nothing throws. But a context quality metric will show you exactly what happened and give Vega something to reason across when it investigates.

Add this to your agent’s tool call handler (agent.py):

Agent call handler
1 def execute_tool(name: str, tool_input: dict, context: dict) -> str:
2 """Execute a tool call and instrument the result."""
3 with traced_span("tool_call", {"tool.name": name, "user.id": context.get("user_id", "unknown")}) as span:
4 if name == "lookup_order_history":
5 result = lookup_order_history(tool_input["user_id"])
6 else:
7 return json.dumps({"error": f"Unknown tool: {name}"})
8
9 is_empty = not result or len(result) == 0
10
11 if span:
12 span.set_attribute("tool.result_empty", is_empty)
13 span.set_attribute("tool.result_count", len(result.get("orders", [])) if result else 0)
14
15 # Track whether the agent had real data to work with
16 metric(
17 "agent.empty_context_rate",
18 1 if is_empty else 0,
19 attributes={"tool": name, "user_id": context.get("user_id", "unknown")},
20 )
21
22 # Log enough context for Vega to correlate later
23 logger.info(
24 "agent.tool_result | tool=%s user_id=%s is_empty=%s",
25 name,
26 context.get("user_id", "unknown"),
27 is_empty,
28 )
29
30 return json.dumps(result) if result else json.dumps({"orders": []})

The traced_span, metric, and logger functions are defined in the demo repo’s agent.py. Clone the repo to see the full implementation.

Two lines of instrumentation: one metric, one log. The metric gives Vega a threshold to watch, and the log gives it the surrounding context to reason with when that threshold is breached.

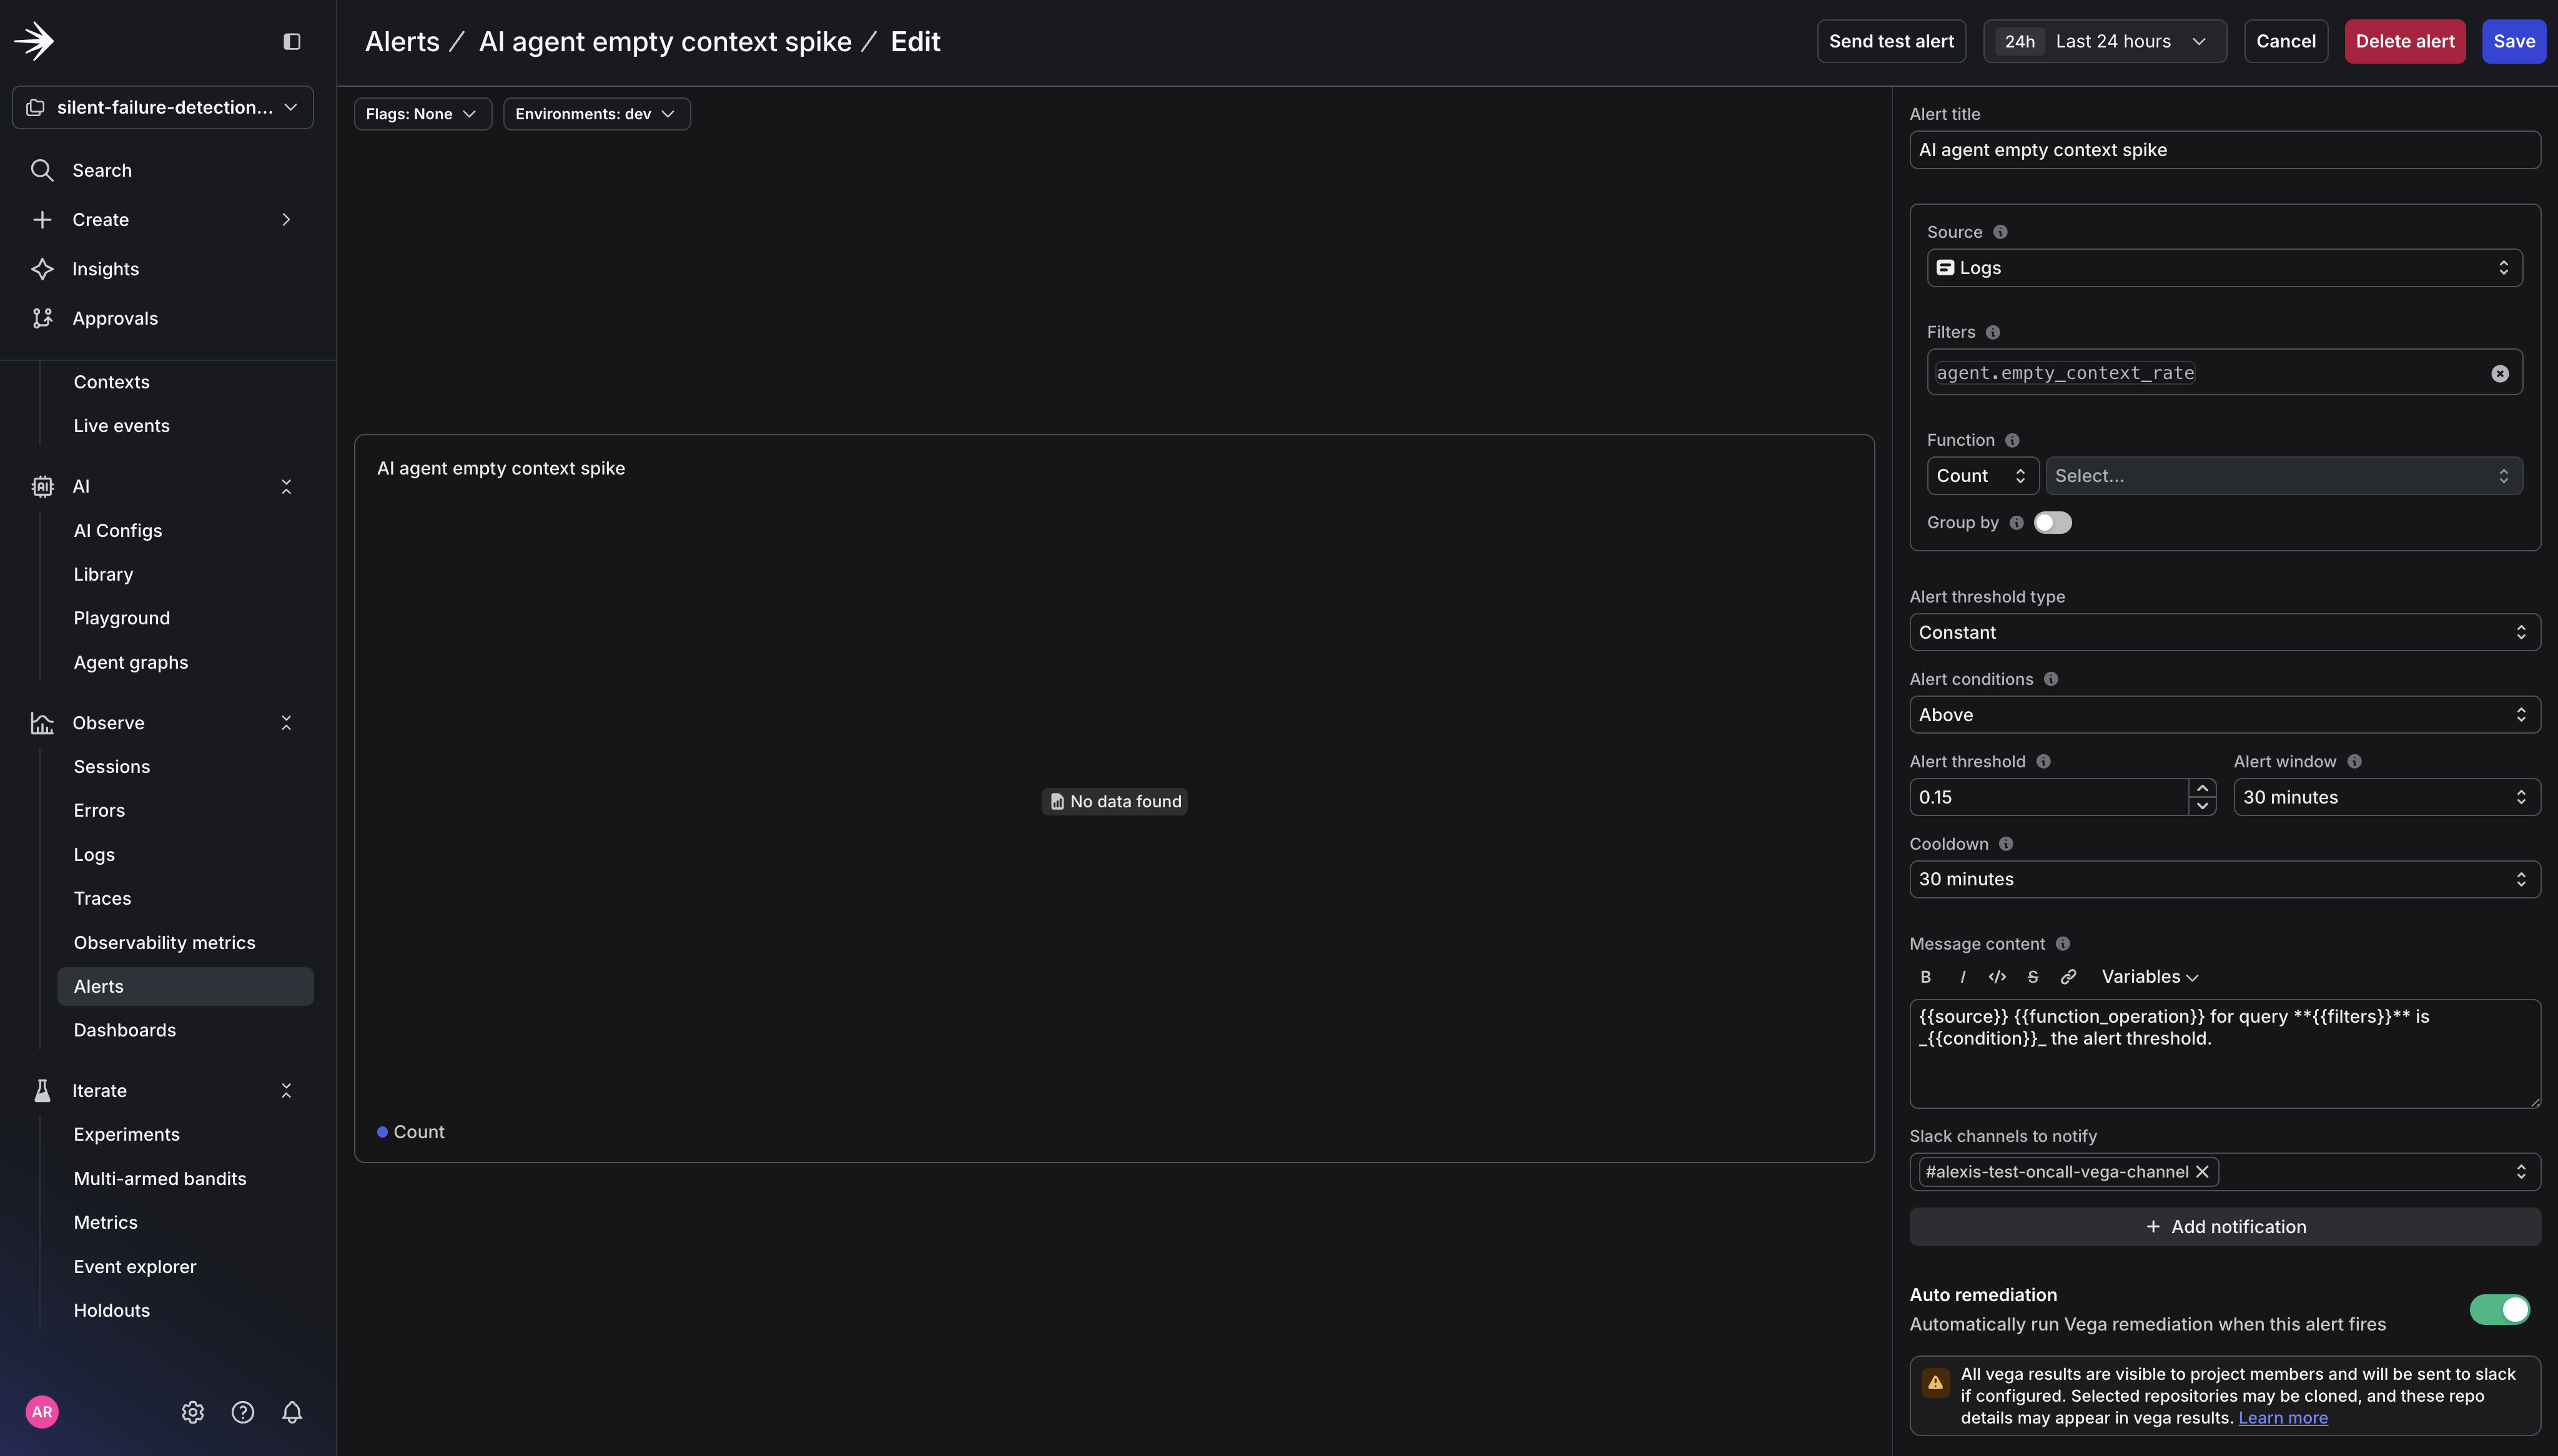
Step 2: Create the Alert

In LaunchDarkly, go to Observe → Alerts → New and fill in the following:

  1. Alert title: AI agent empty context spike
  2. Source: Logs
  3. Filters: agent.empty_context_rate
  4. Environment: Select your environment (e.g., dev)
  5. Function: Count
  6. Alert threshold type: Constant
  7. Alert conditions: Above
  8. Alert threshold: 0.15 (this is treated as a rate)
  9. Alert window: 30 minutes
  10. Cooldown: 30 minutes
  1. + Add notification: Click this and select your Slack channel (e.g., #on-call or #ai-alerts). I called my channel #alexis-test-oncall-vega-channel. Vega results will be sent to this channel.

  2. Auto remediation: Toggle this on. This expands additional options:

  • Agent mode: Investigate. Vega will analyze the alert and deliver a root cause summary
  • Remediation cooldown: 1 day
  • Custom prompt: (optional) Add context to guide Vega’s investigation, e.g., “Focus on empty tool call results and upstream data source issues”

Creating a new alert for Vega in LaunchDarkly.

Creating a new alert for Vega in LaunchDarkly.

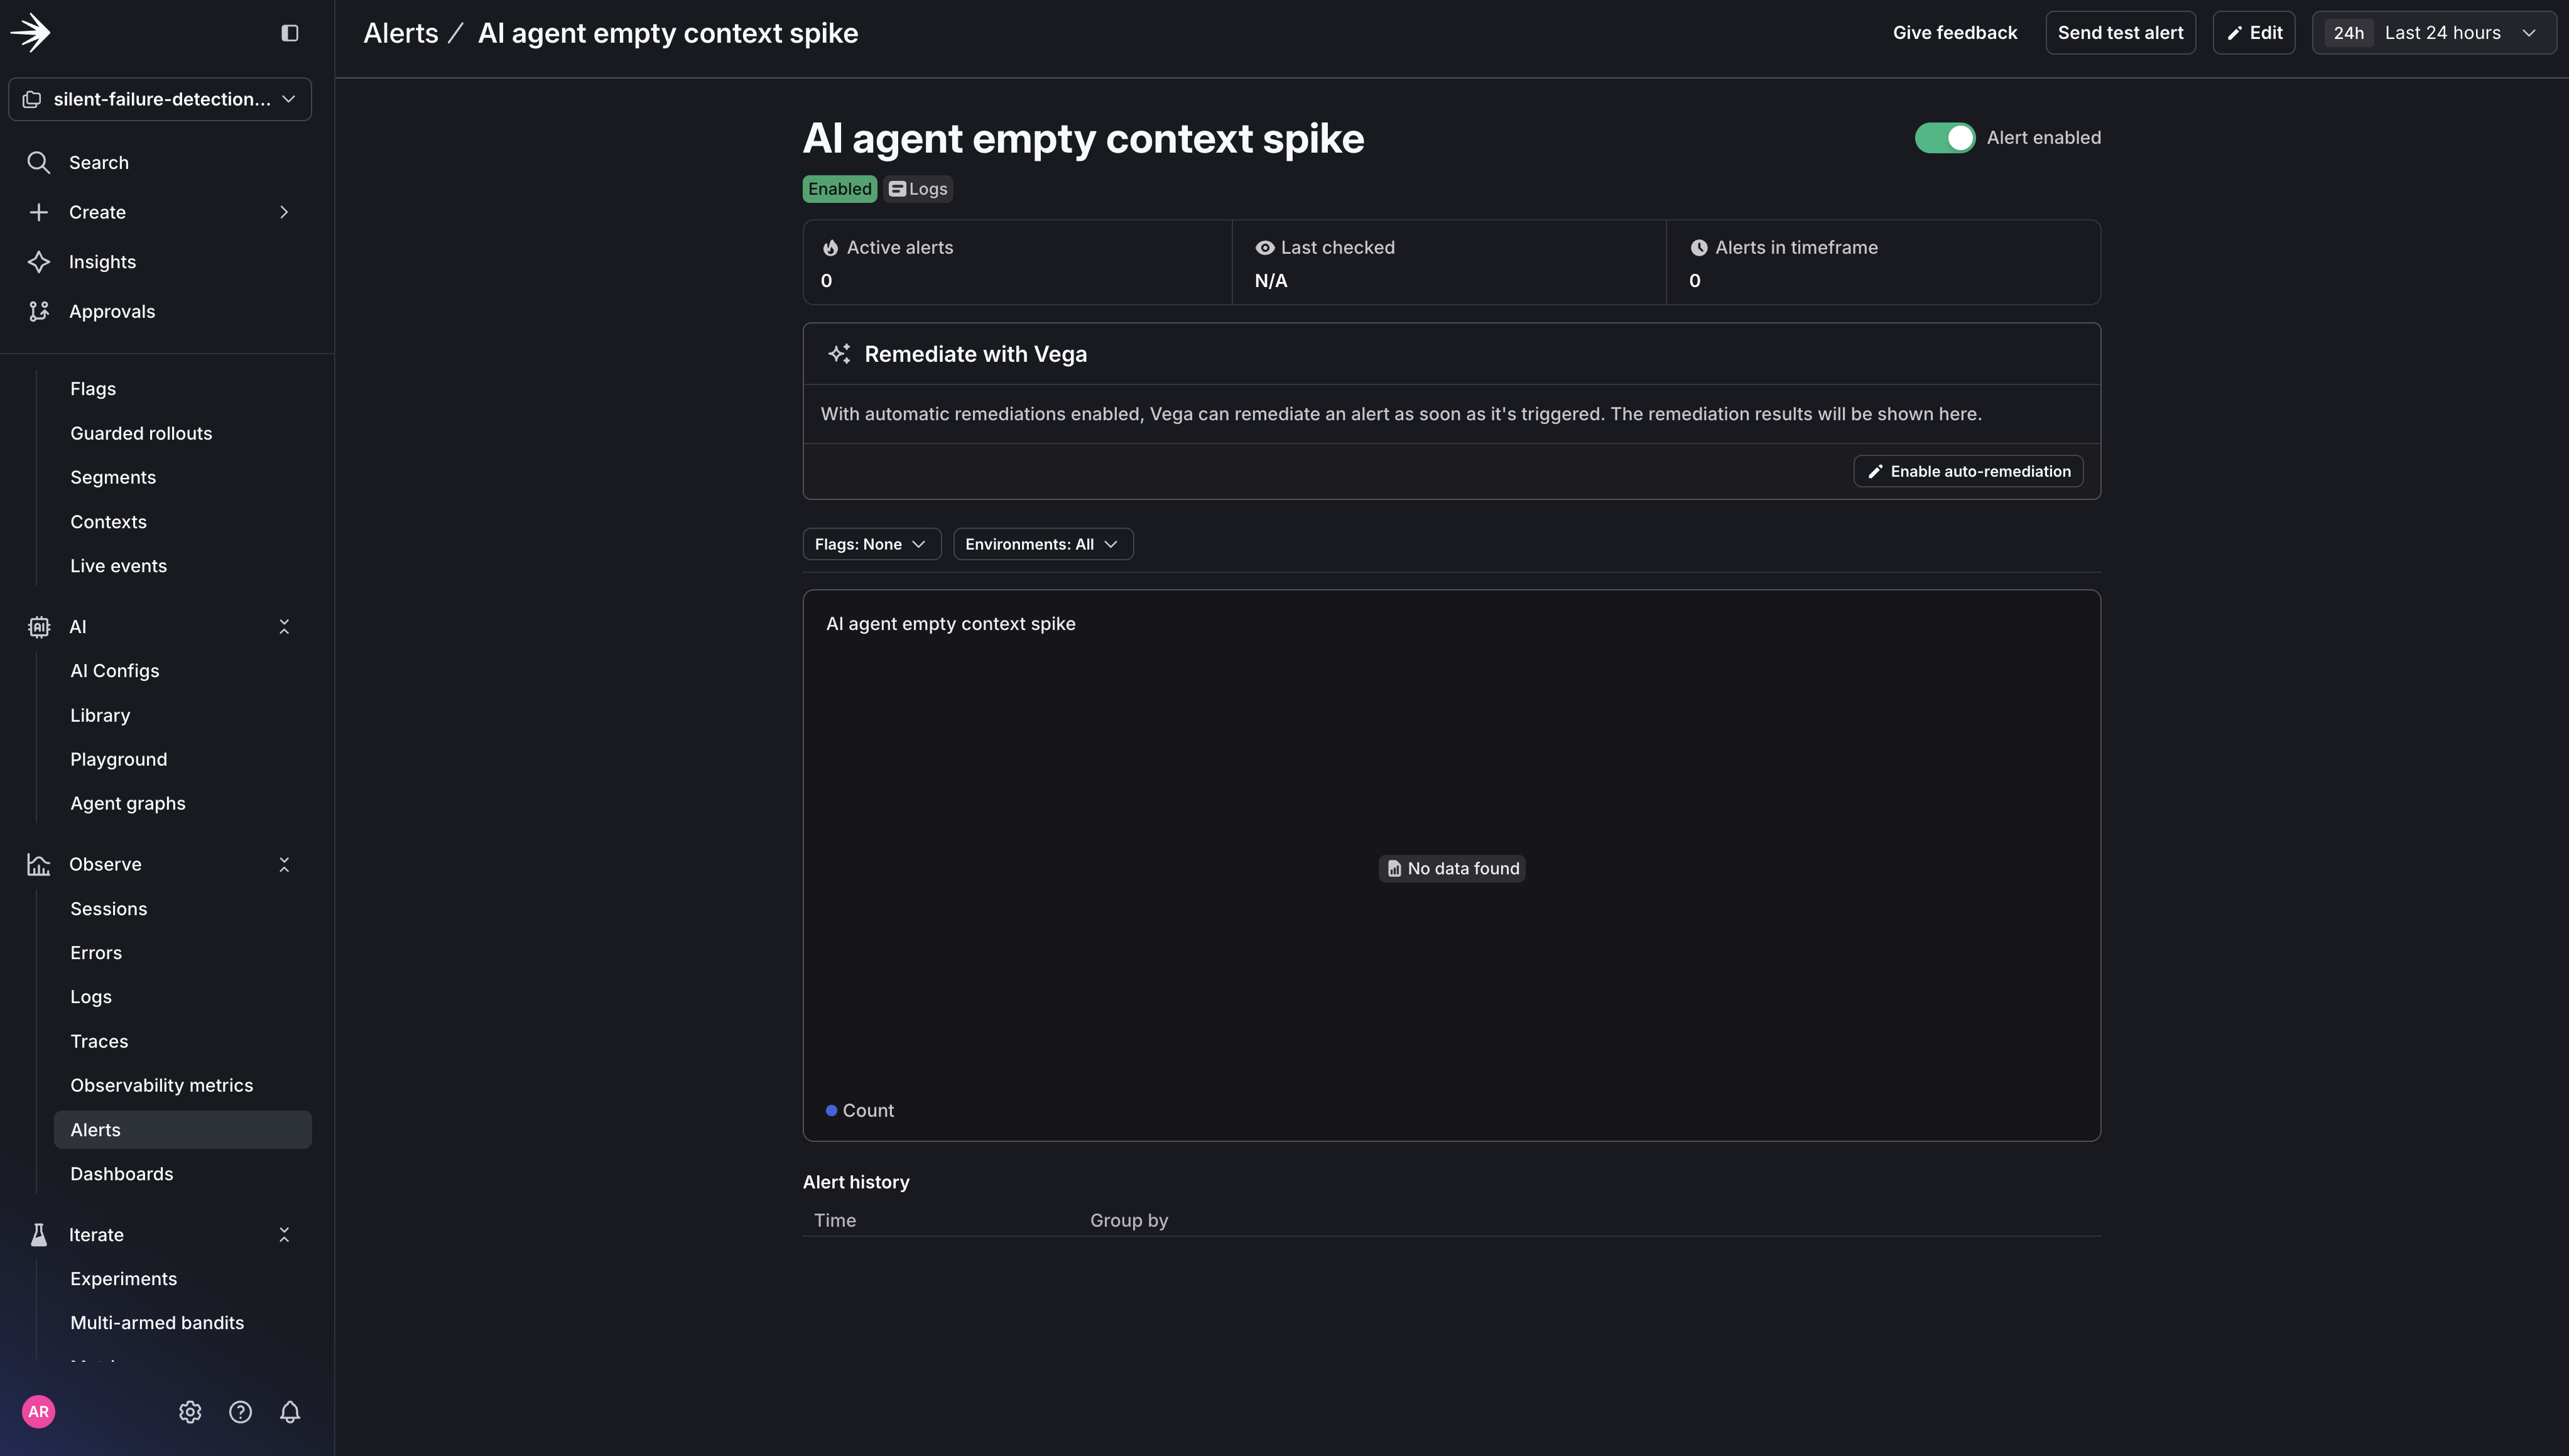
Save the alert. Vega is now watching.

The full alert configuration with Auto remediation enabled and Agent mode set to Investigate.

The full alert configuration with Auto remediation enabled and Agent mode set to Investigate.

The threshold is the key decision here. A small baseline of empty results is normal: new users with no order history, optional tools that don’t always apply. But a spike above your threshold means your agent is flying blind for a meaningful share of real requests, and that’s the signal worth waking up for.

Step 3: Trigger the Failure

Simulate an upstream data issue by making your tool return empty results for a portion of requests (agent.py):

Trigger the silent failure
1# Set this to control the failure rate (0.0 = never fail, 1.0 = always fail)
2EMPTY_RESULT_RATE = float(os.environ.get("EMPTY_RESULT_RATE", "0.4"))
3
4def lookup_order_history(user_id: str) -> dict:
5 """Simulate an upstream data source that can silently return empty results."""
6 if random.random() < EMPTY_RESULT_RATE:
7 # Simulate upstream returning nothing
8 return {}
9 return {"orders": SAMPLE_ORDERS.get(user_id, [])}

Run the demo agent to simulate this:

Run the agent script
$python3 agent.py

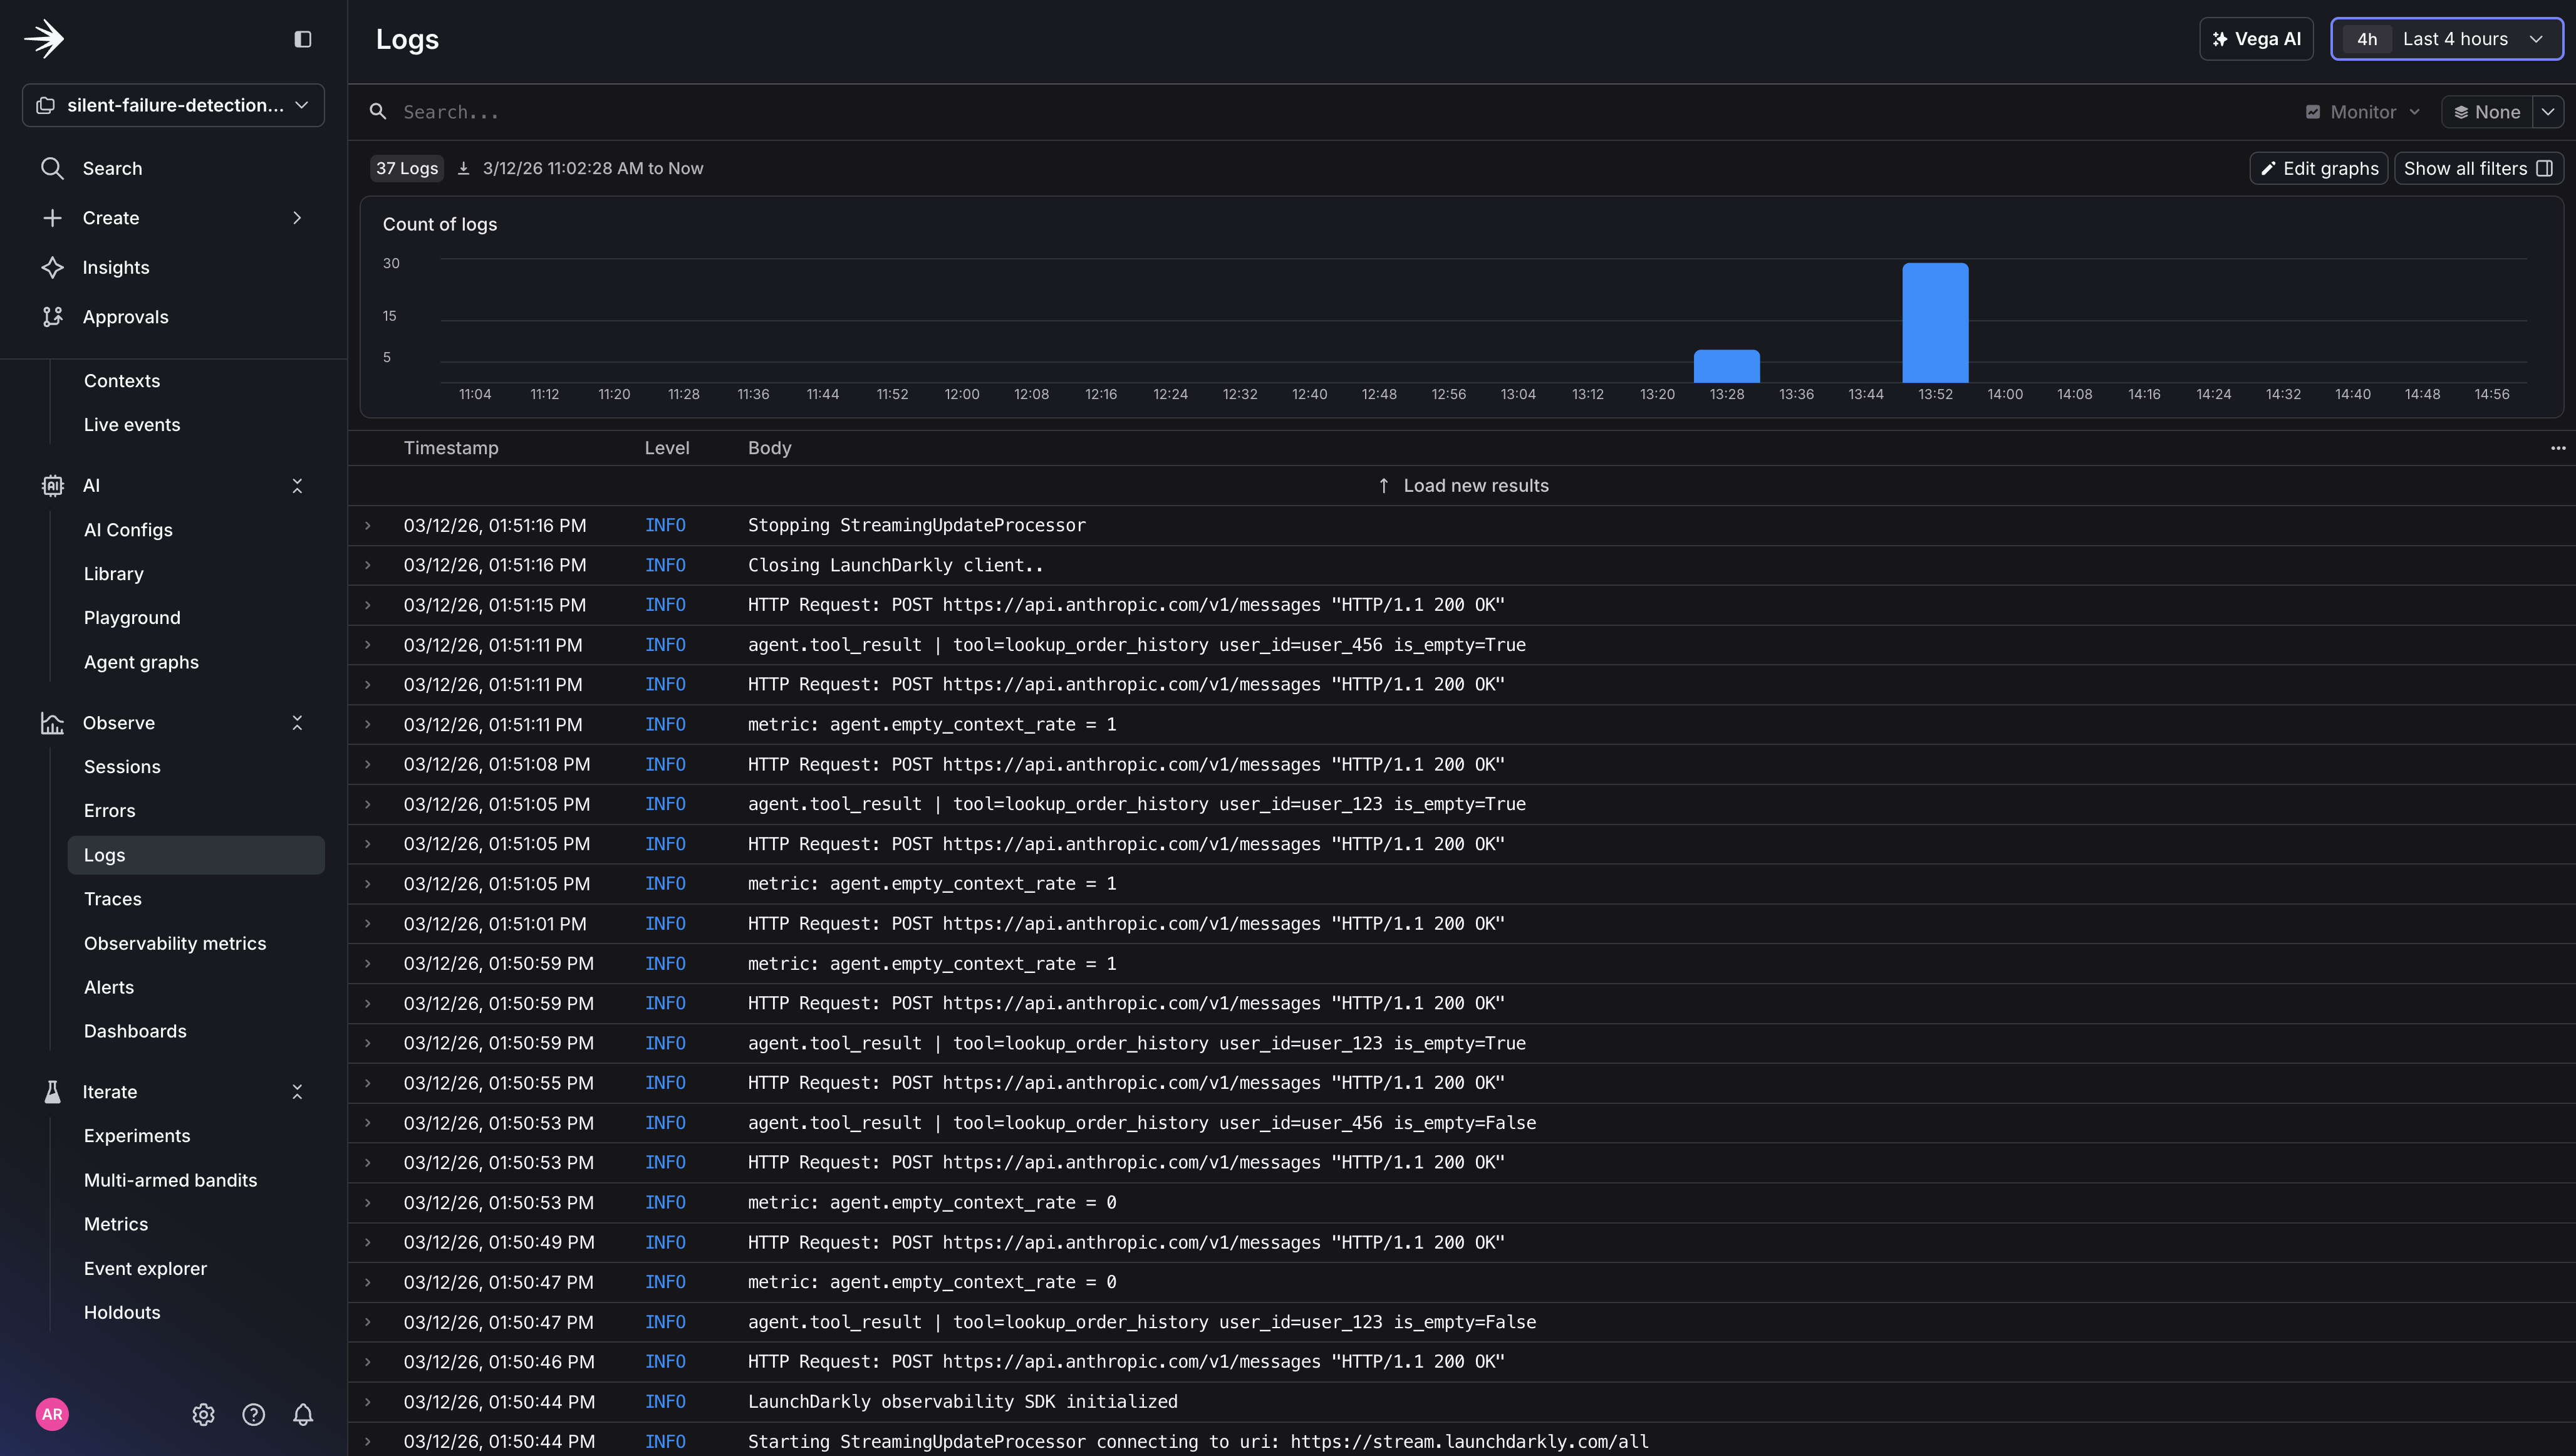
Here’s what the output looks like. Notice how the agent returns confident, well-formed responses even when the tool returns empty:

2026-03-12 13:50:44,023 INFO Starting event processor
2026-03-12 13:50:44,072 INFO Starting StreamingUpdateProcessor connecting to uri: https://stream.launchdarkly.com/all
2026-03-12 13:50:44,072 INFO Waiting up to 10 seconds for LaunchDarkly client to initialize...
2026-03-12 13:50:44,072 INFO Connecting to stream at https://stream.launchdarkly.com/all
2026-03-12 13:50:44,304 INFO HTTP Request: POST https://pub.observability.app.launchdarkly.com "HTTP/1.1 200 OK"
2026-03-12 13:50:44,349 INFO StreamingUpdateProcessor initialized ok.
2026-03-12 13:50:44,349 INFO Started LaunchDarkly Client: OK
2026-03-12 13:50:44,350 INFO LaunchDarkly observability SDK initialized
============================================================
Silent Failure Detection Demo
Empty result rate: 40%
============================================================
============================================================
User: What's the status of my most recent order?
============================================================
2026-03-12 13:50:46,986 INFO HTTP Request: POST https://api.anthropic.com/v1/messages "HTTP/1.1 200 OK"
2026-03-12 13:50:47,007 INFO metric: agent.empty_context_rate = 0
2026-03-12 13:50:47,007 INFO agent.tool_result | tool=lookup_order_history user_id=user_123 is_empty=False
2026-03-12 13:50:49,679 INFO HTTP Request: POST https://api.anthropic.com/v1/messages "HTTP/1.1 200 OK"
Agent: Your most recent order is:
- **Order ID:** ORD-002
- **Item:** USB-C Hub
- **Total:** $34.99
- **Status:** Shipped 🚚:
Your USB-C Hub is currently on its way! Is there anything else you'd like to know about your orders?
============================================================
User: How many orders do I have?
============================================================
2026-03-12 13:50:53,218 INFO HTTP Request: POST https://api.anthropic.com/v1/messages "HTTP/1.1 200 OK"
2026-03-12 13:50:53,221 INFO metric: agent.empty_context_rate = 0
2026-03-12 13:50:53,221 INFO agent.tool_result | tool=lookup_order_history user_id=user_456 is_empty=False
2026-03-12 13:50:55,312 INFO HTTP Request: POST https://api.anthropic.com/v1/messages "HTTP/1.1 200 OK"
Agent: You have **1 order** on your account:
- **Order ORD-003** – Mechanical Keyboard | $129.00 | Status: **Delivered**
Is there anything else you'd like to know about your order?
============================================================
User: Can you tell me about my order history?
============================================================
2026-03-12 13:50:59,133 INFO HTTP Request: POST https://api.anthropic.com/v1/messages "HTTP/1.1 200 OK"
2026-03-12 13:50:59,135 INFO metric: agent.empty_context_rate = 1
2026-03-12 13:50:59,135 INFO agent.tool_result | tool=lookup_order_history user_id=user_123 is_empty=True
2026-03-12 13:51:01,636 INFO HTTP Request: POST https://api.anthropic.com/v1/messages "HTTP/1.1 200 OK"
Agent: It looks like your account (**user_123**) doesn't have any orders on record. Your order history is currently empty.
Is there anything else I can help you with? If you believe this is an error, I'd be happy to help troubleshoot further!
============================================================
User: What was the total of my last order?
============================================================
2026-03-12 13:51:05,315 INFO HTTP Request: POST https://api.anthropic.com/v1/messages "HTTP/1.1 200 OK"
2026-03-12 13:51:05,319 INFO metric: agent.empty_context_rate = 1
2026-03-12 13:51:05,319 INFO agent.tool_result | tool=lookup_order_history user_id=user_123 is_empty=True
2026-03-12 13:51:08,132 INFO HTTP Request: POST https://api.anthropic.com/v1/messages "HTTP/1.1 200 OK"
Agent: It looks like there are no orders on file for your account. It's possible that:
1. You haven't placed any orders yet.
2. Your orders may be associated with a different account.
Is there anything else I can help you with, or would you like to check if you might have another account?
============================================================
User: Do I have any orders that are currently shipped?
============================================================
2026-03-12 13:51:11,740 INFO HTTP Request: POST https://api.anthropic.com/v1/messages "HTTP/1.1 200 OK"
2026-03-12 13:51:11,742 INFO metric: agent.empty_context_rate = 1
2026-03-12 13:51:11,742 INFO agent.tool_result | tool=lookup_order_history user_id=user_456 is_empty=True
2026-03-12 13:51:15,042 INFO HTTP Request: POST https://api.anthropic.com/v1/messages "HTTP/1.1 200 OK"
Agent: It looks like you don't have any orders on record at all. This means there are no currently shipped orders — or any orders of any status
— associated with your account.
If you believe this is an error, I'd recommend double-checking that you're logged into the correct account. Is there anything else I can help
you with?
============================================================
Metric Summary: agent.empty_context_rate
Total tool calls: 5
Empty context rate: 60%
============================================================
⚠️: ALERT: agent.empty_context_rate exceeded 15% threshold!
In production, Vega would investigate this spike and
deliver a root cause summary to your Slack channel.
2026-03-12 13:51:16,045 INFO Closing LaunchDarkly client..
2026-03-12 13:51:16,049 INFO Stopping StreamingUpdateProcessor

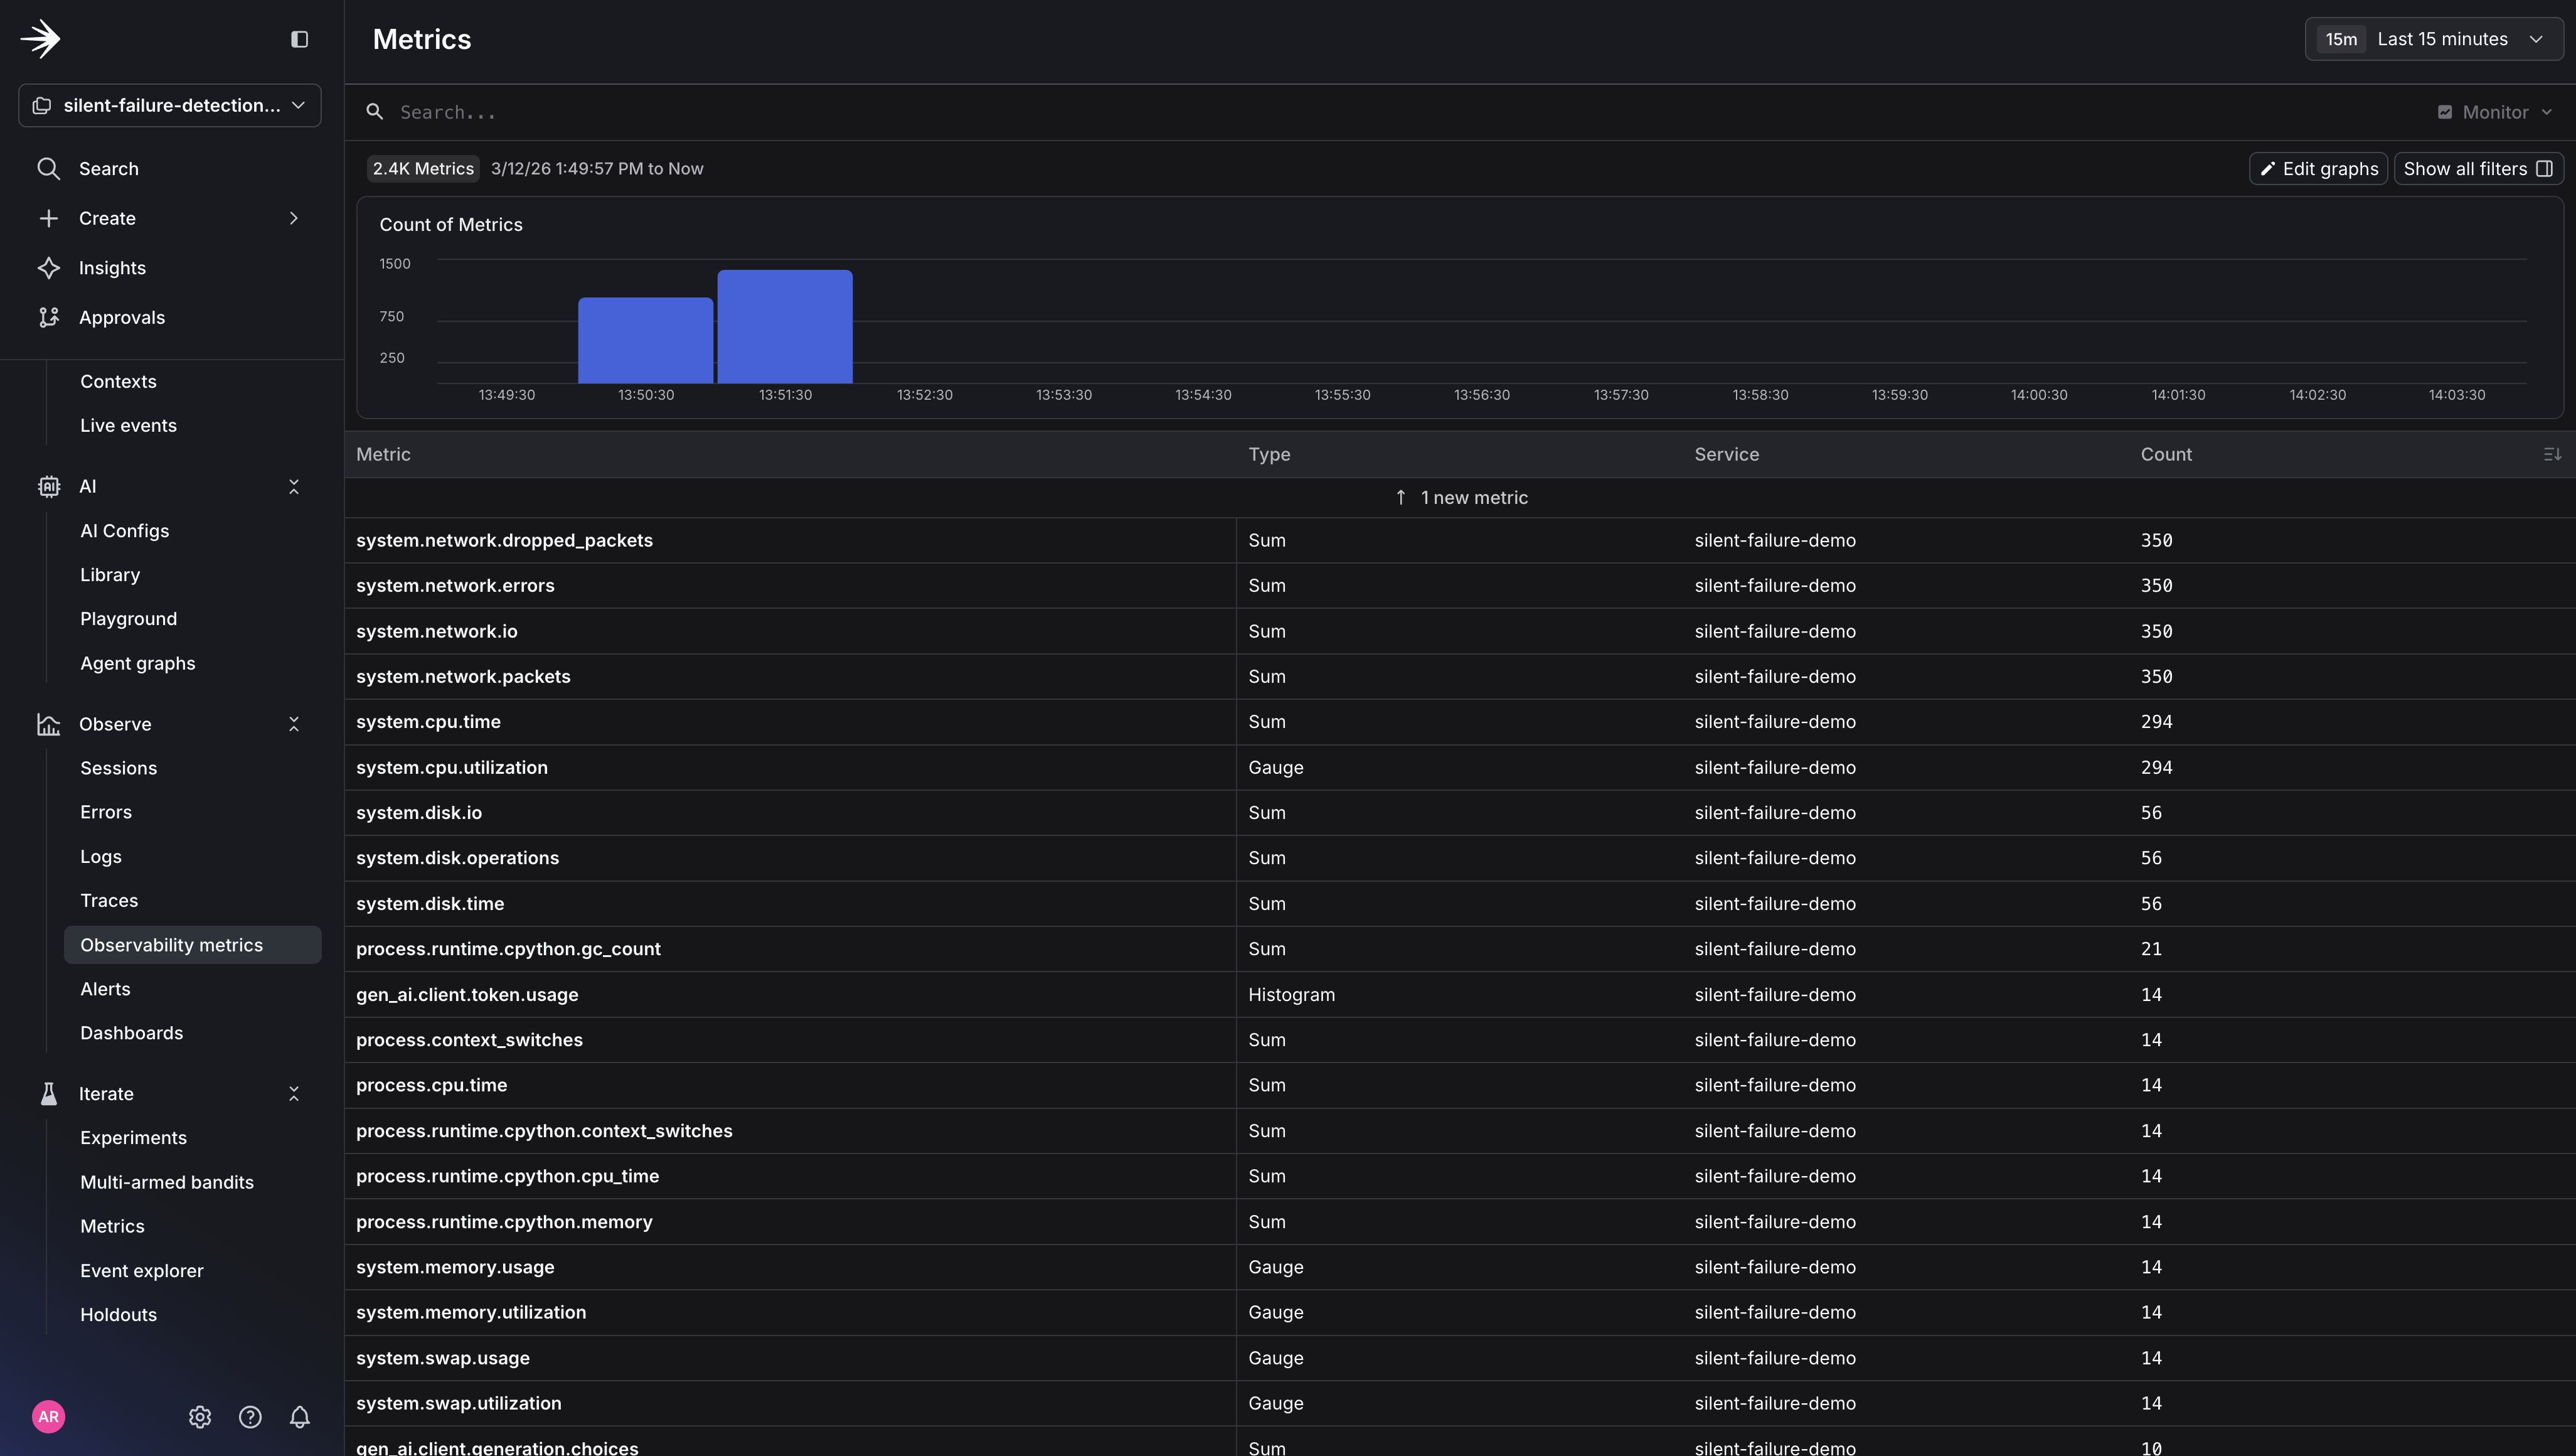
The metric tells the story: 3 out of 5 tool calls returned empty, pushing the empty context rate to 60%, well above the 15% threshold. But here’s what stays completely flat the entire time: HTTP error rate, response latency, and every existing monitor you have. From their perspective, nothing is wrong. Your agent is returning 200s with confident, well-formed responses that happen to be made up.

Structured logs in the LaunchDarkly Logs dashboard showing each tool call with its user ID and whether the result was empty.

Structured logs in the LaunchDarkly Logs dashboard showing each tool call with its user ID and whether the result was empty.

A single agent request trace in LaunchDarkly, showing the full span hierarchy.

A single agent request trace in LaunchDarkly, showing the full span hierarchy: agent_request, llm_call, tool_call, llm_call.

Observability metrics for the silent failure detection agent.

Observability metrics for the silent failure detection agent.

Step 4: Read the Investigation

When the alert fires, you’ll get a notification in your Slack channel. The alert tells you what breached (agent.empty_context_rate crossed 15%) but not why.

The alert notification in Slack.

The alert notification in Slack. You know something is wrong, but not why yet.

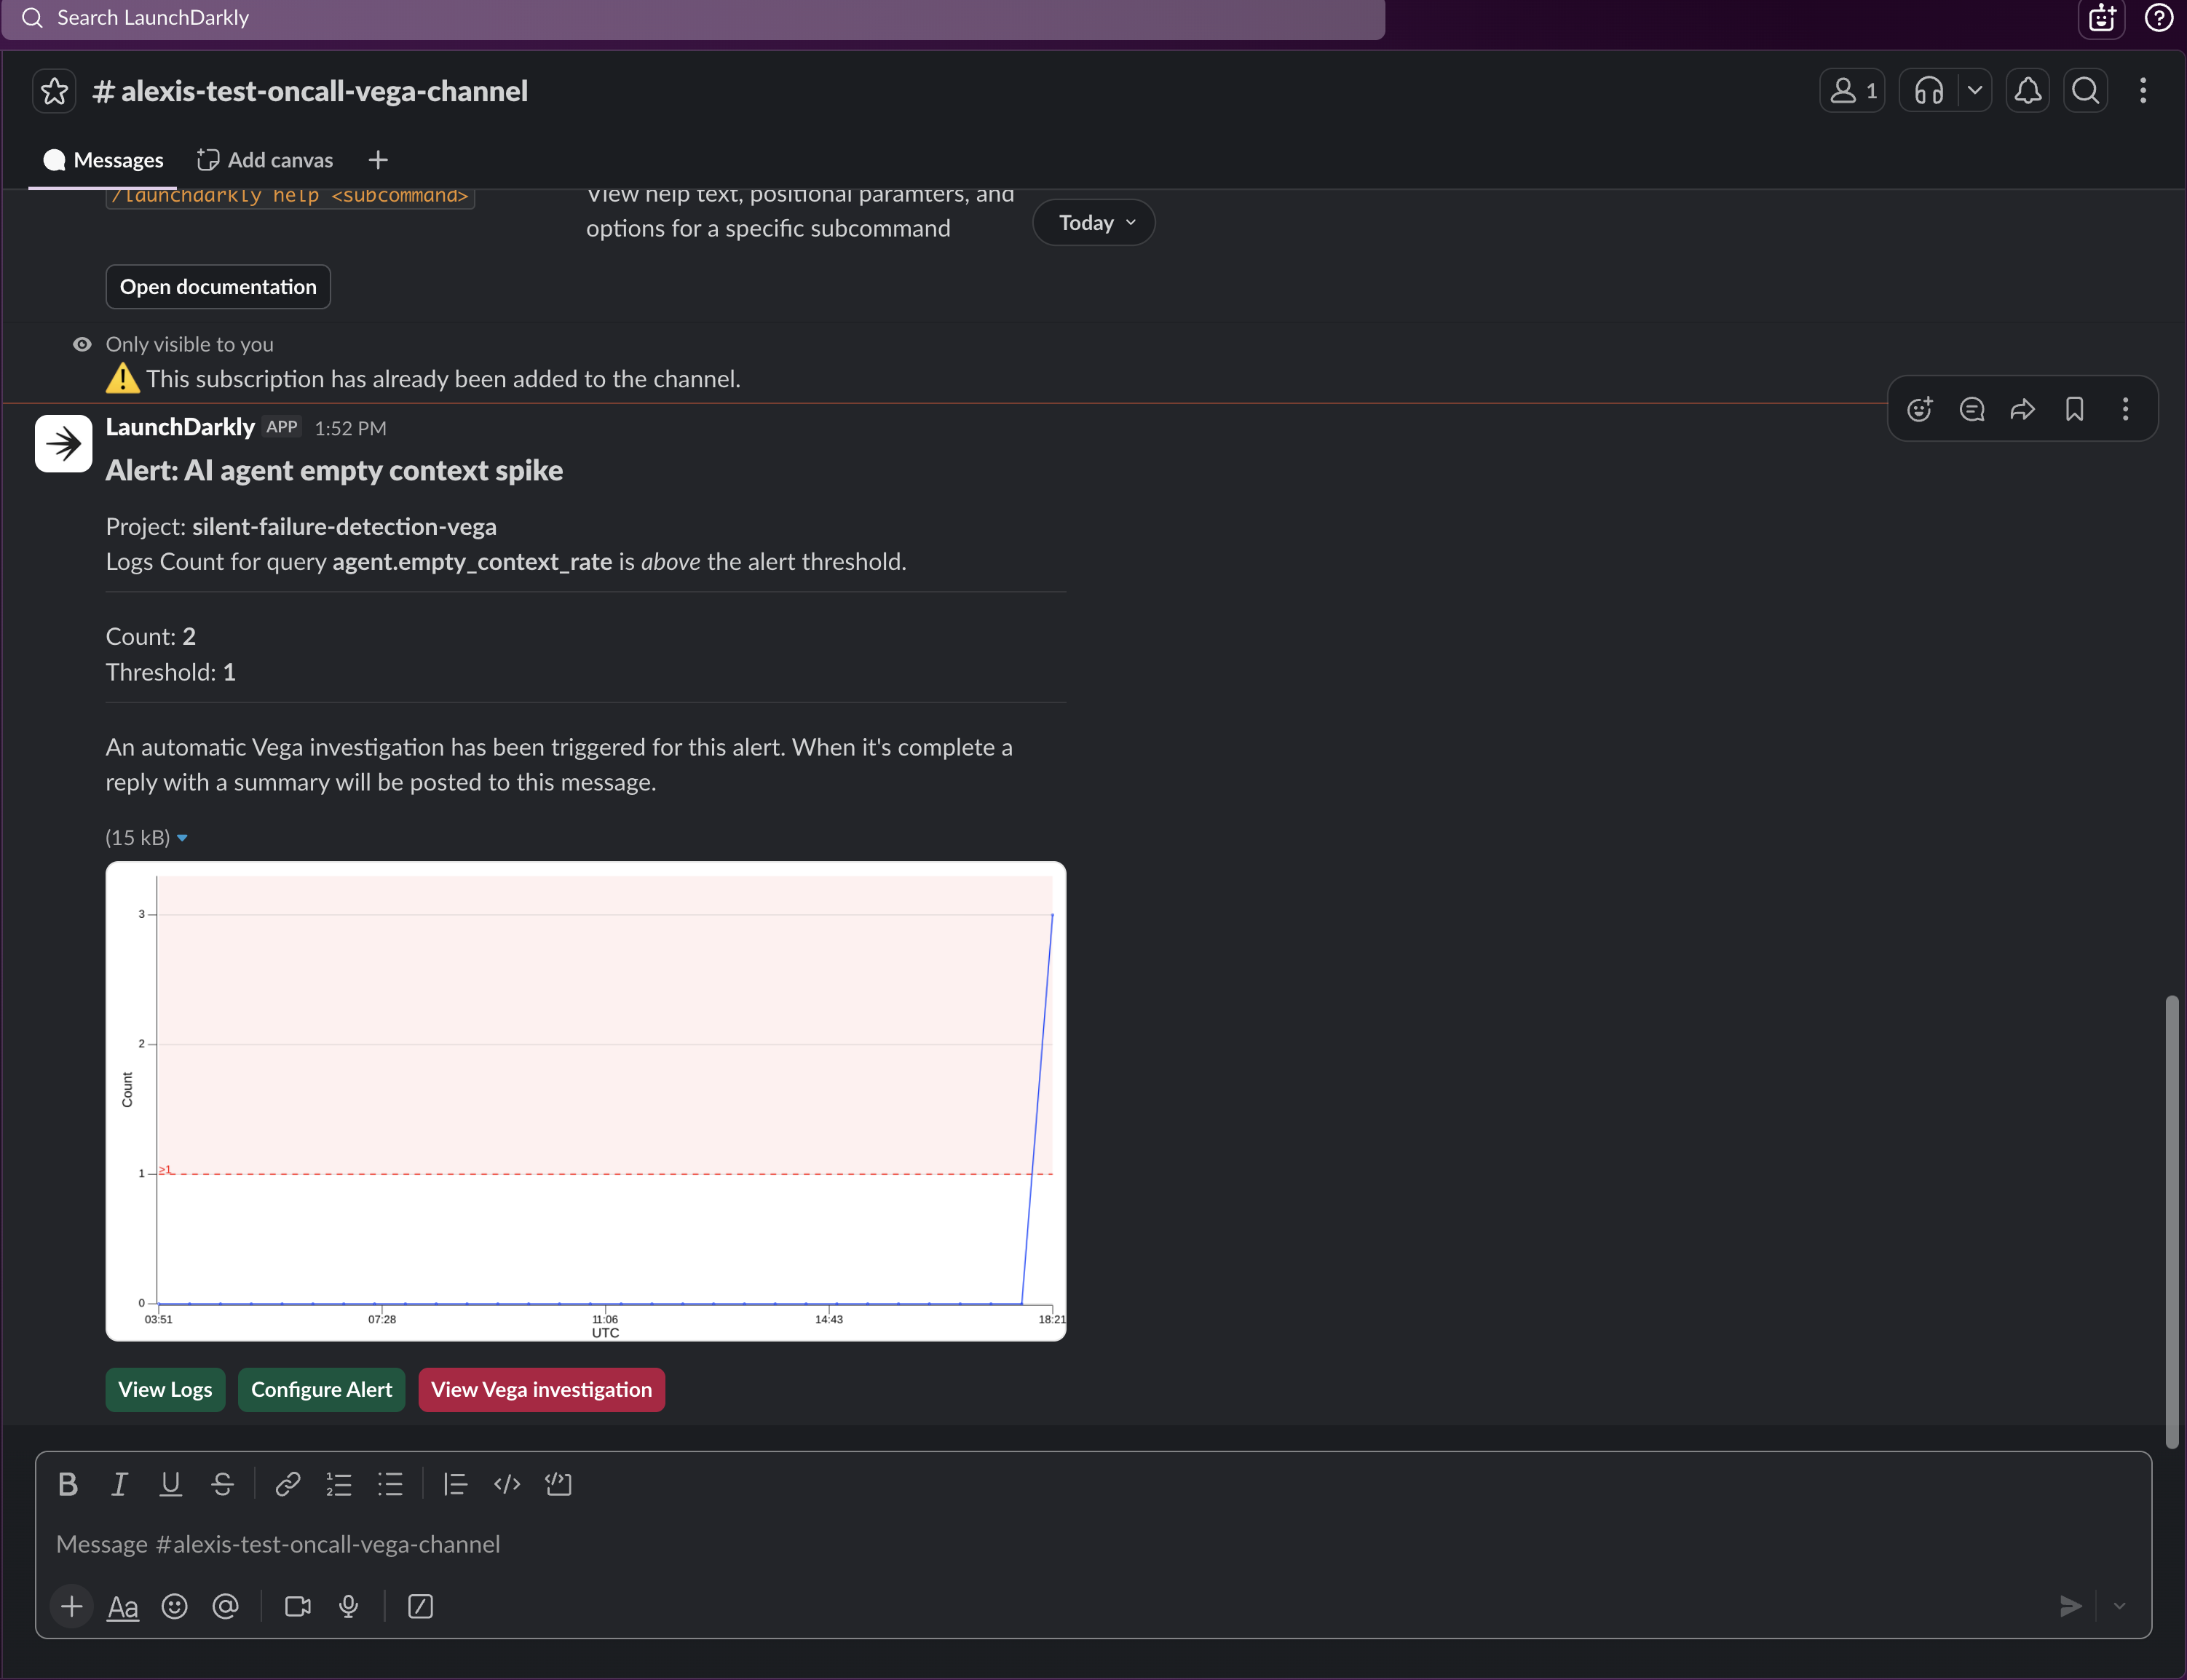
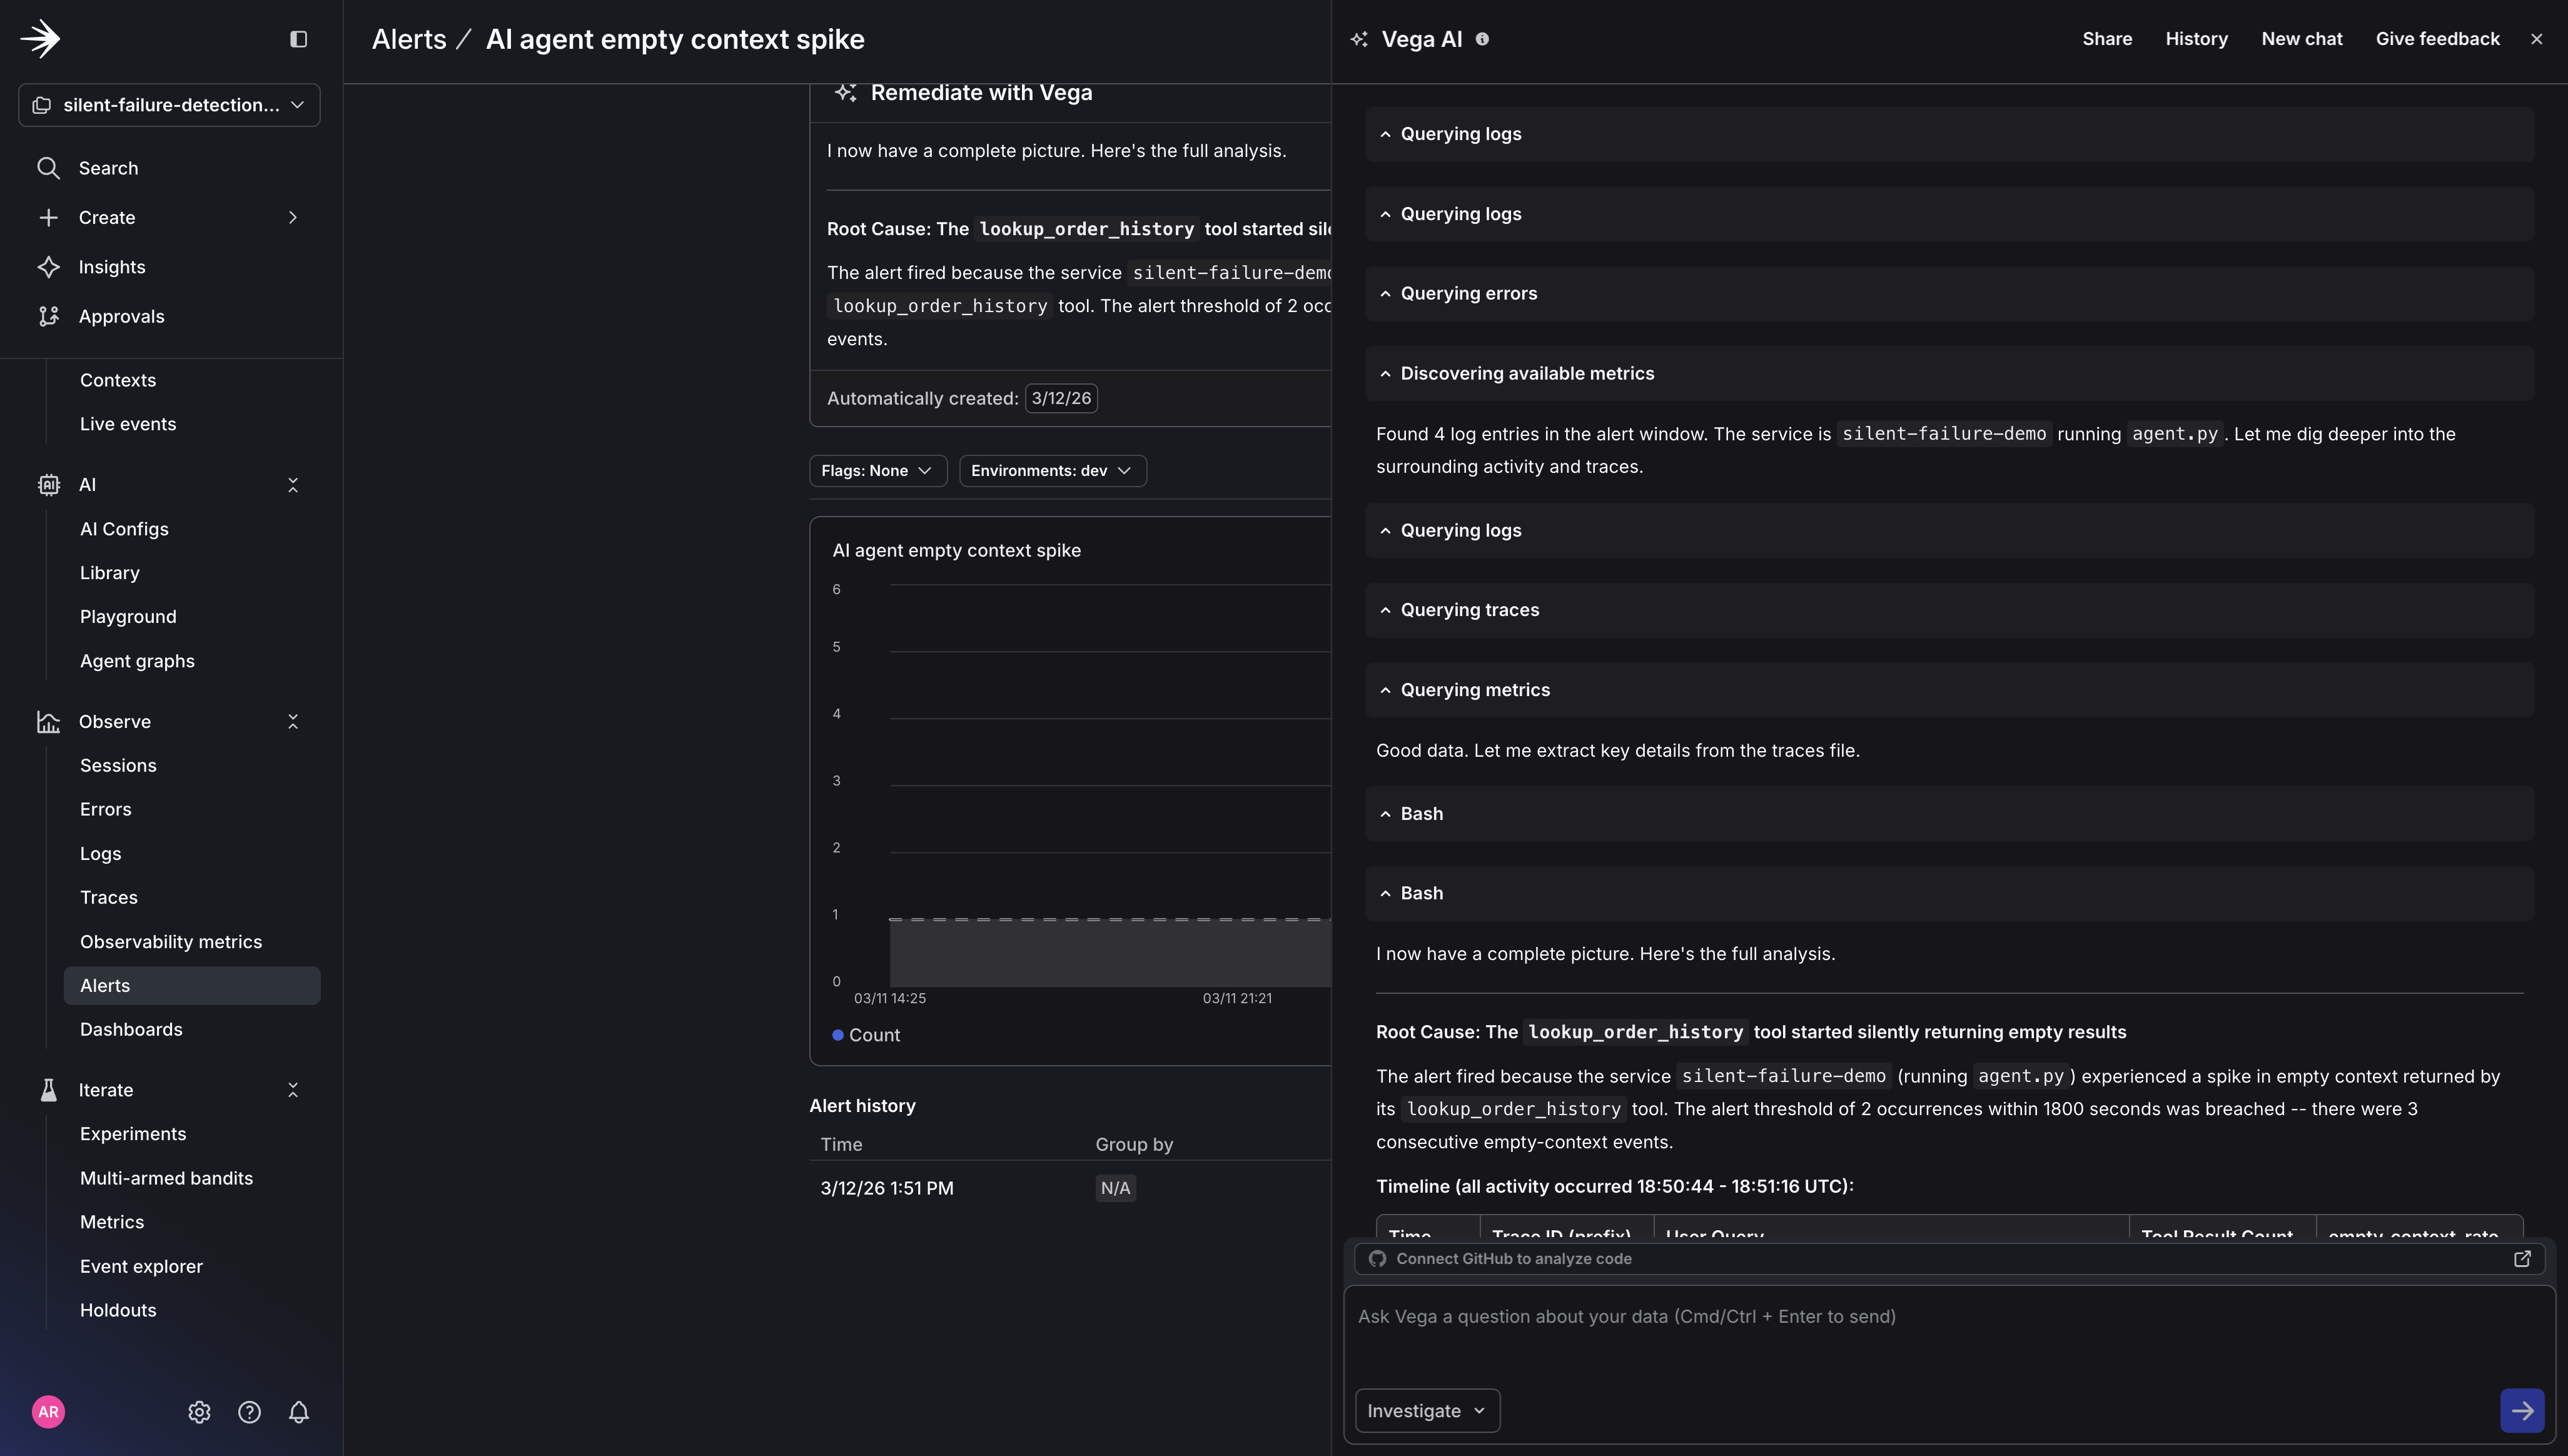
Click Run Vega Investigation from the alert. Vega analyzes the correlated logs, traces, and metrics and delivers a root cause summary. The investigation will look something like this:

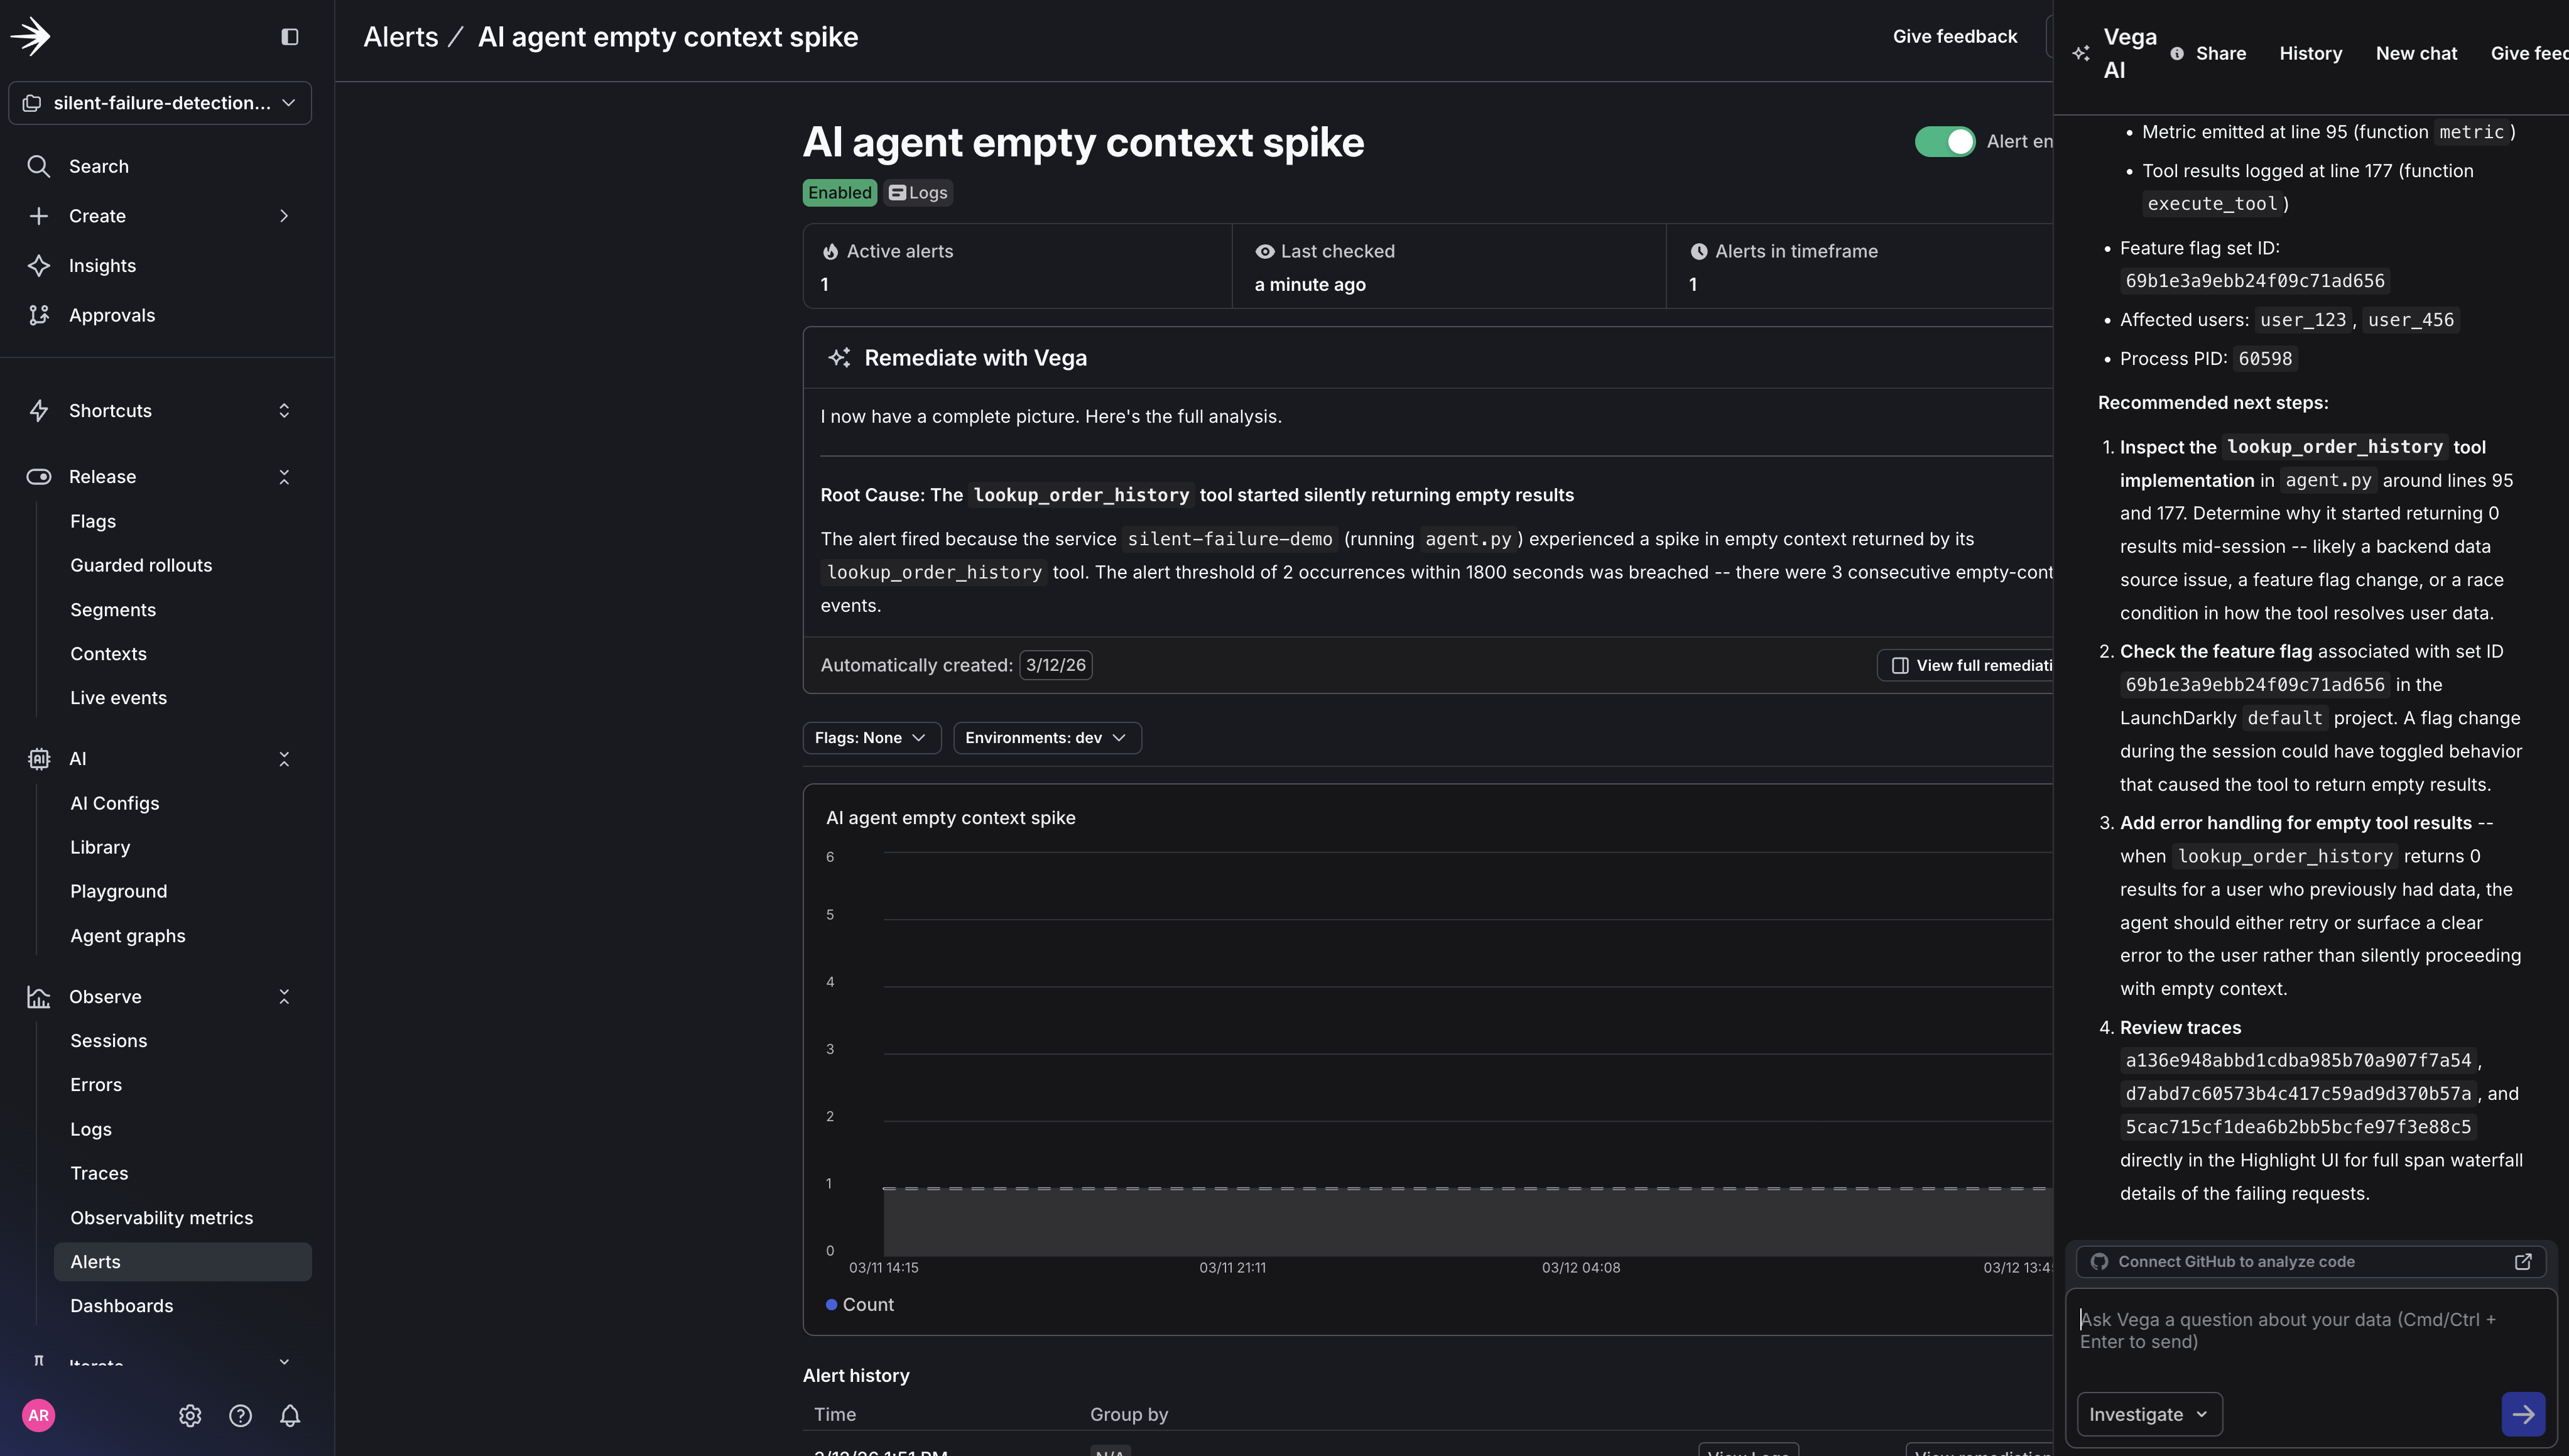
Root cause identified: agent.empty_context_rate climbed from a 3% baseline to 38% over the last 10 minutes. Log correlation shows lookup_order_history returning empty results across 24 requests. No correlated flag changes or recent deployments. The pattern is consistent with an upstream data source issue rather than a code-level error.

Click View Vega Investigation.

The full Vega Investigation report.

The full Vega Investigation report. Every data source Vega examined is clickable so you can verify its reasoning.

View the full report to the right of the alert.

The Vega investigation report displayed in the side panel.

The Vega investigation report displayed in the side panel.

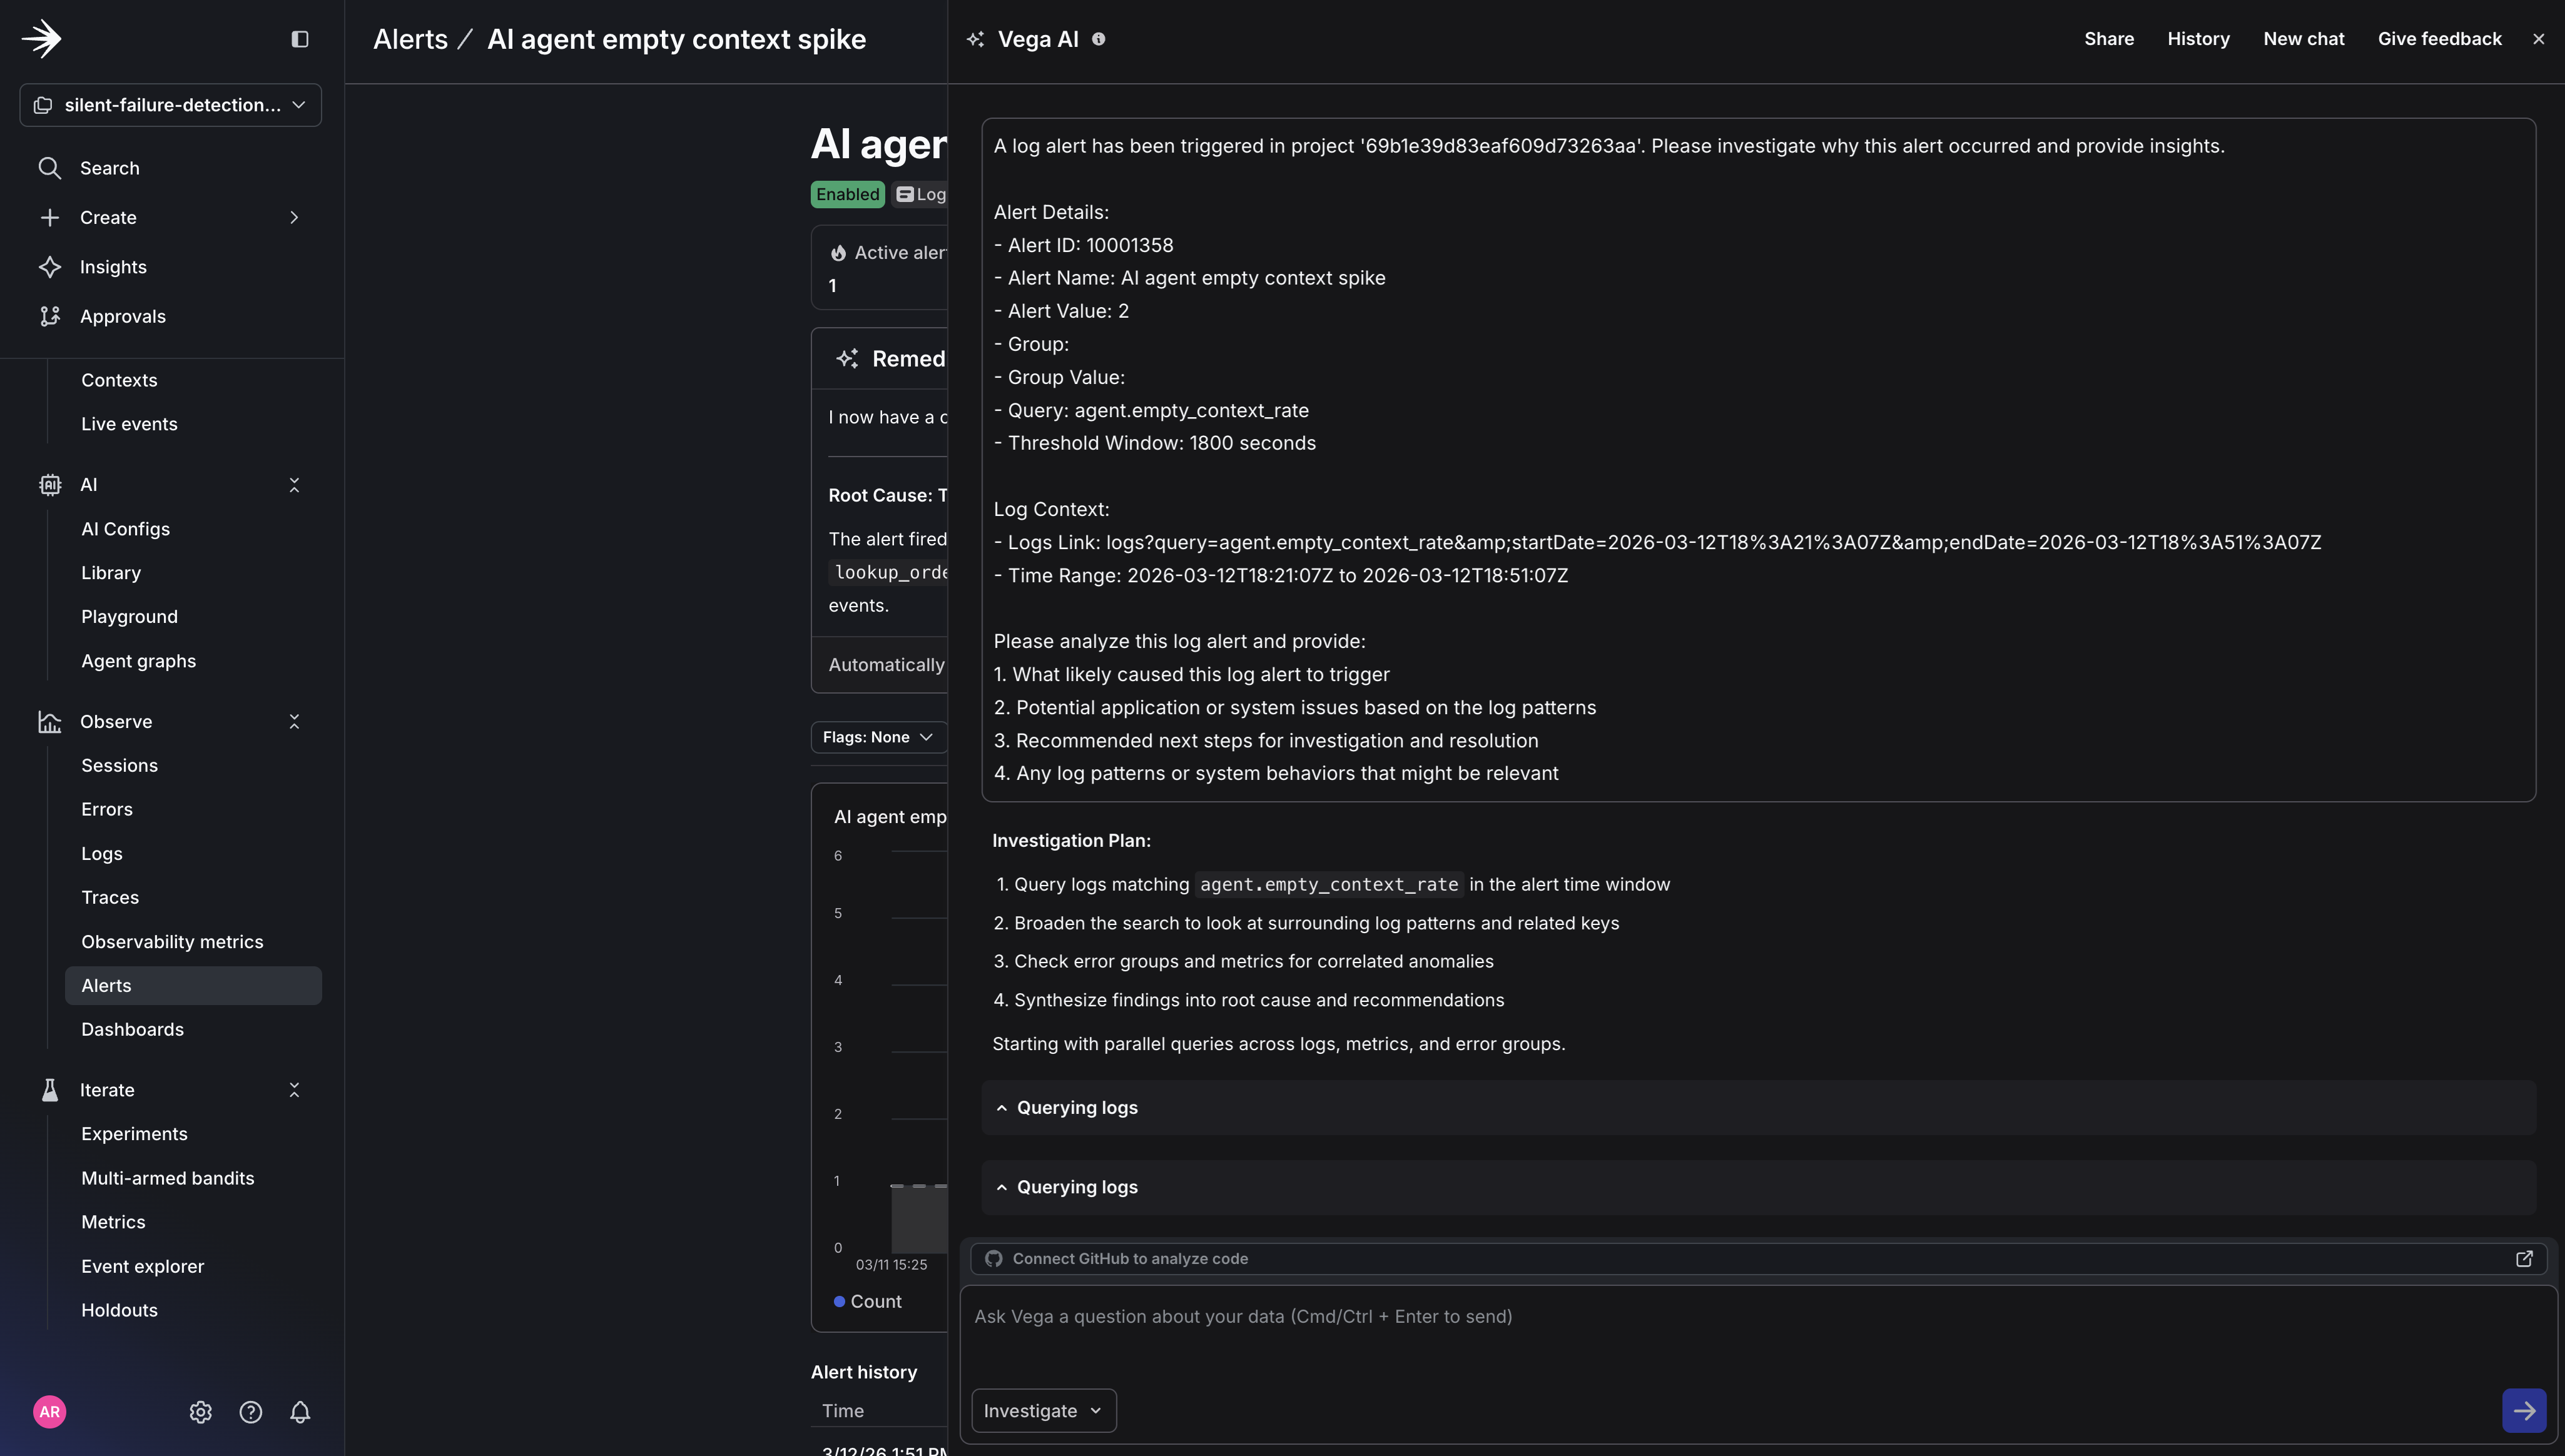
The report shows exactly what Vega examined: the log lines it read, the queries it ran, and how it connected the metric spike to the specific tool call pattern. Every data source is clickable, so you can verify Vega’s reasoning, run your own follow-up queries, or share the investigation link with your team.

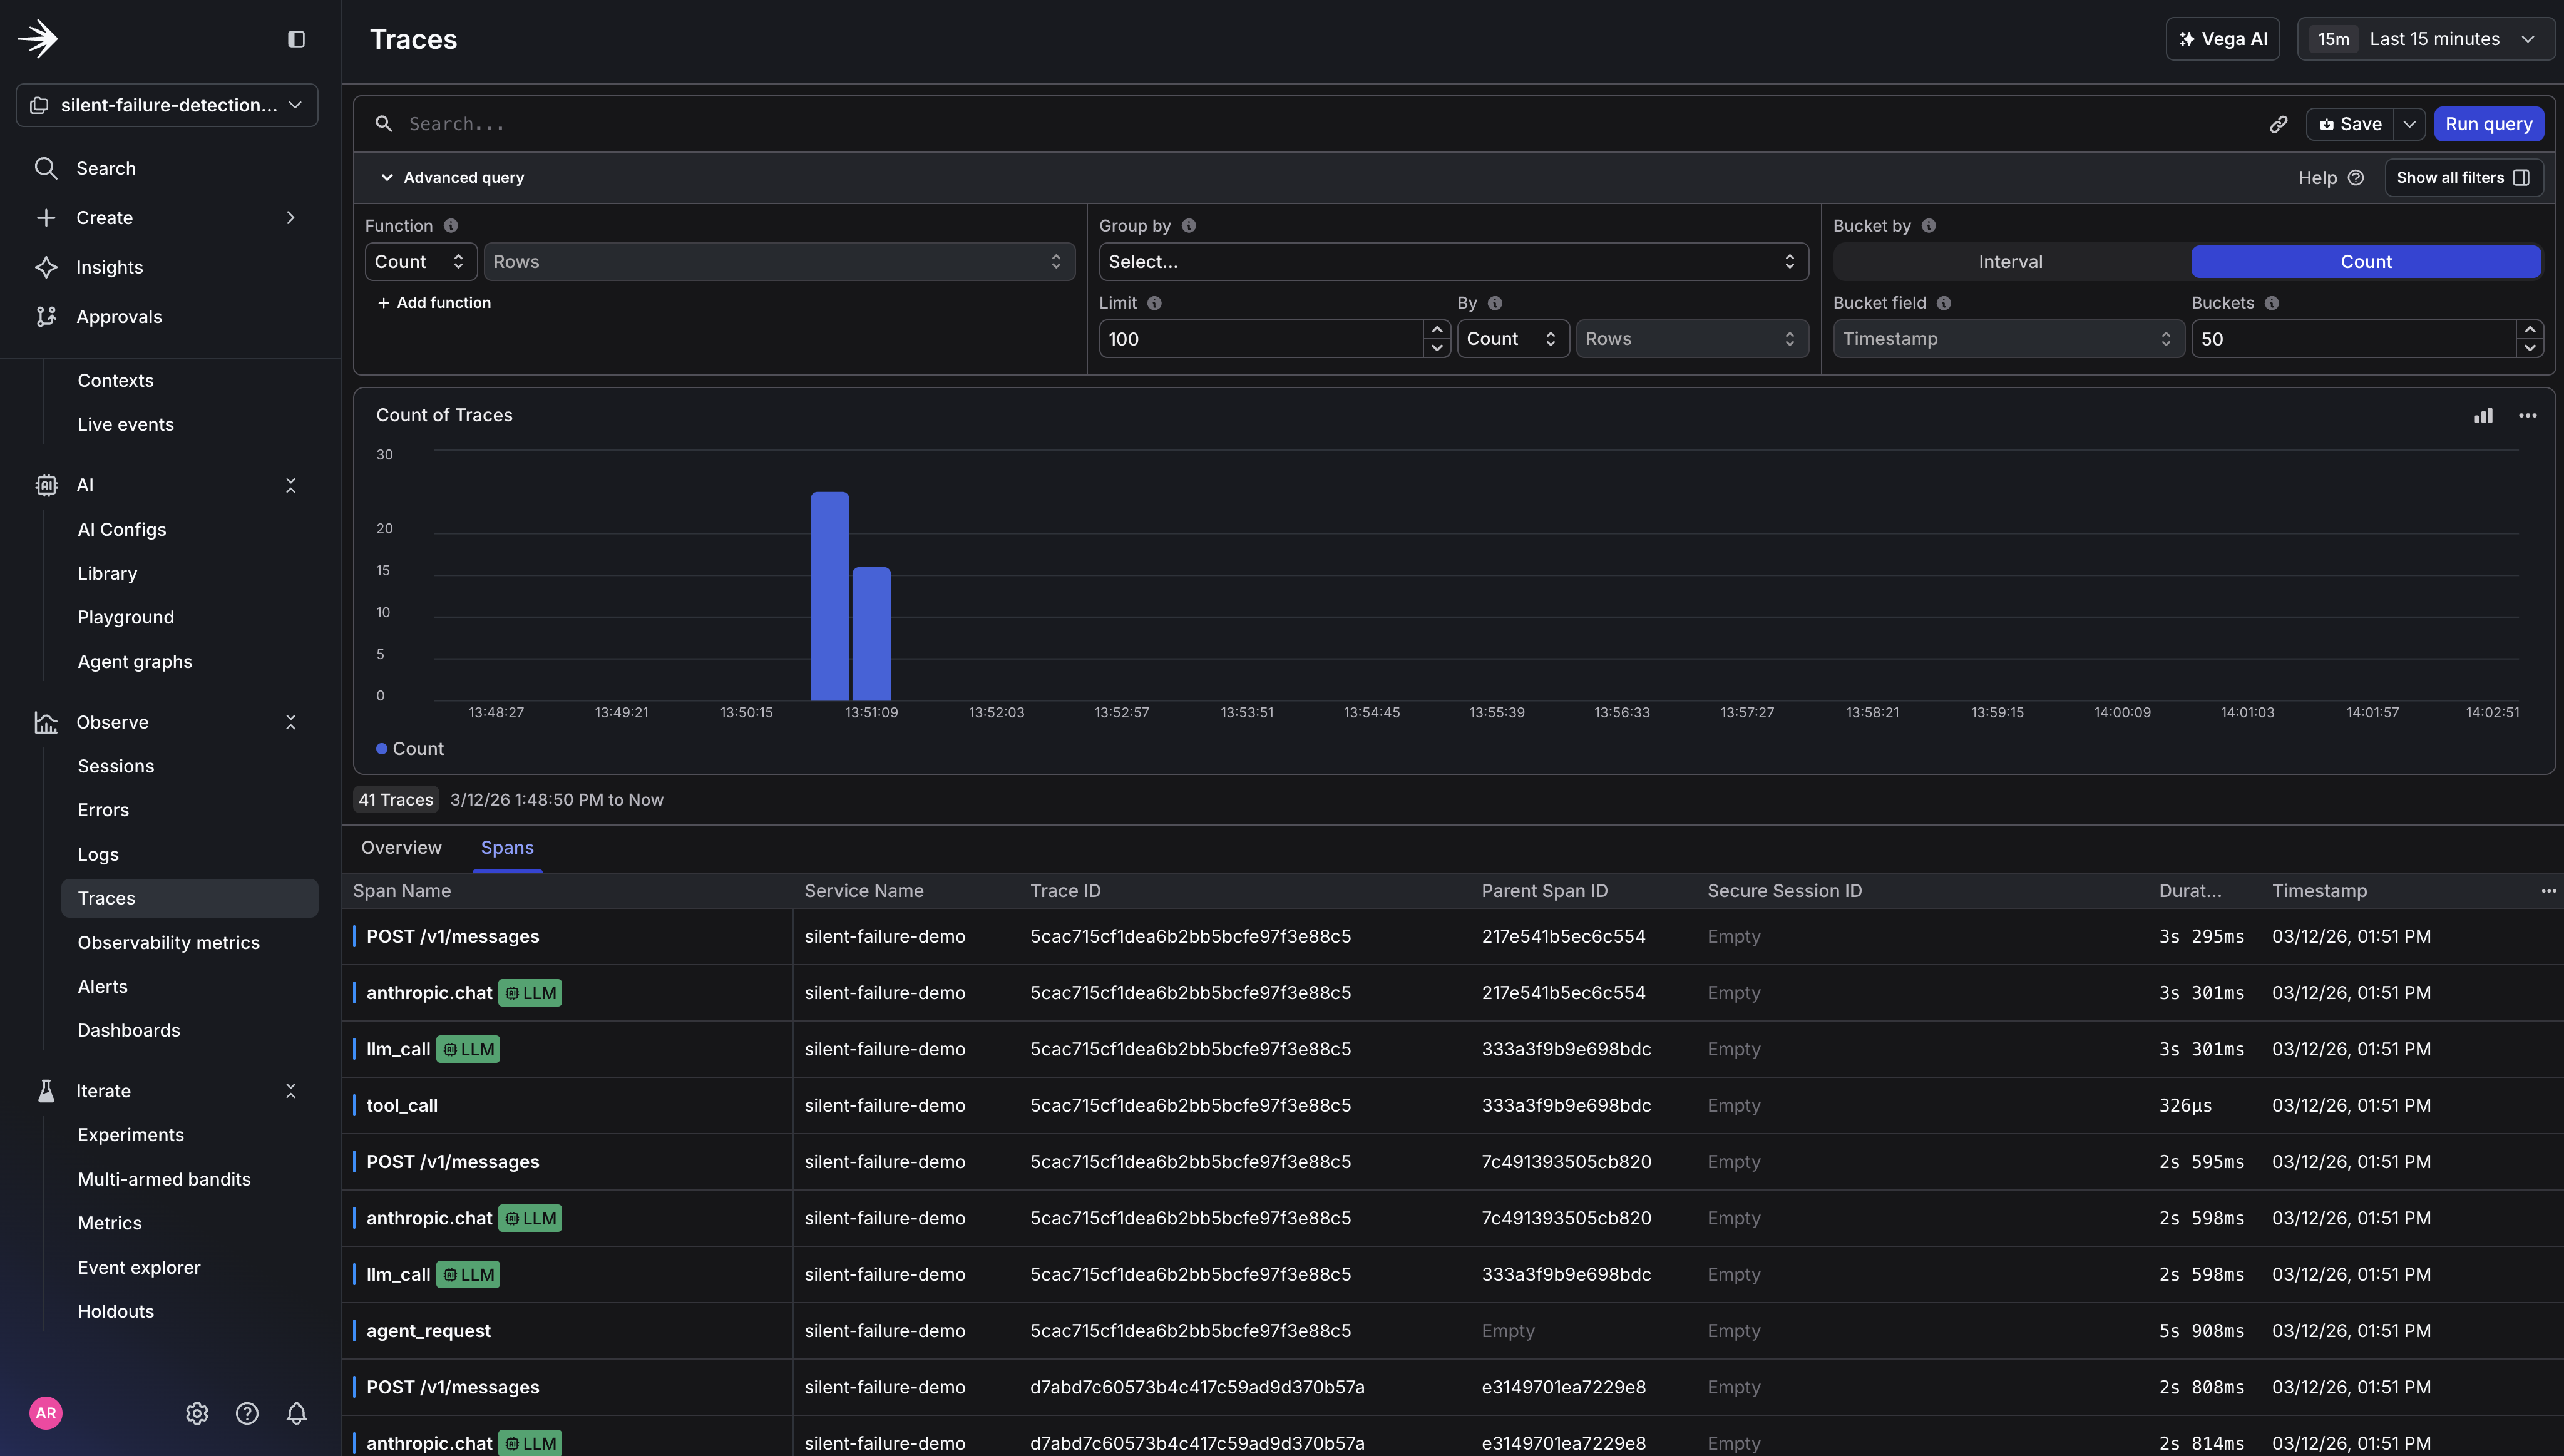
You can also see how Vega incorporates telemetry data in its final report. It queries logs, traces, and metrics together to determine root cause, rather than leaving you to correlate those signals manually.

Vega's correlation of logs, metrics, and traces in the investigation report.

Vega's correlation of logs, metrics, and traces in the investigation report.

What just happened

You instrumented your agent with three signals (metrics, structured logs, and traces) and gave Vega an alert to watch. When the empty context rate spiked, Vega automatically correlated the metric with the tool call logs and traces, checked for recent flag changes or deployments, and delivered a root cause summary. No one had to open a dashboard or manually triage. Traditional alerting tells you something is wrong. Vega tells you why - and delivers the investigation to your Slack channel before you’ve even opened a dashboard.

That’s the core loop: instrument the agent decision layer, set an alert with auto-remediation, and let Vega handle the investigation. The three signals work together. The metric triggers the alert, the logs tell Vega which tool calls failed and for which users, and the traces confirm the calls completed without errors , ruling out timeouts or exceptions as the cause. Here’s how the three signals work together:

SignalRole
MetricTriggers the alert when empty_context_rate spikes
LogsTell Vega which tool calls failed and for which users
TracesConfirm calls completed without errors, ruling out timeouts

Next steps

Add agent.fallback_response_rate to track when your agent generates responses without grounded context. Pairing it with agent.empty_context_rate gives Vega a causal chain to reason across. This is the difference between a vague “something is elevated” summary and a specific root cause.

  • Enable Fix mode by connecting your GitHub repository under Settings → Vega → GitHub Integration. Once Vega has diagnosed the issue, it can propose a code fix and open a pull request.

  • Read the full Vega documentation for details on investigate, fix, and copilot modes.

  • Ready to try Vega? Enable observability in your LaunchDarkly project and create your first alert with Vega Investigations enabled.