Product analytics events
This topic describes how to use LaunchDarkly product analytics events with observability features to help you understand how system performance affects user activities in your application.
Use the JavaScript, Flutter, Android, and iOS client-side SDK observability to record the following product events as OpenTelemetry spans:
- Clicks or taps, with details about the click or tap location and URL.
- Page views (web) or screen views (mobile), including the current and previous URL or screen.
- App launches and app lifecycle changes (mobile), including the launch type and whether the app moved to the foreground or background.
- Custom metric events that your code generates using the
track()method. The span events fortrack()calls include both the product URL and metric event key, as well as any optional numeric value provided for a numeric event.
All of the span events generated for these product analytics also include information about the LaunchDarkly context that generated the event. Use the context attributes to associate product usage events with other observability data, such as errors and log messages, to better understand how overall system performance affects user activities in your application.
Web product analytics are available through the JavaScript observability plugin. Mobile product analytics, including screen views, app launches, and app lifecycle events, are available through the Android, iOS, Flutter, and React Native observability plugins. The React Native observability plugin records taps, app launches, app lifecycle events, custom metric track events, and an app_reload lifecycle event when a session continues across a JavaScript reload. It does not record screen views. To learn about mobile-specific behavior, read Product analytics on mobile.
Prerequisites
To use LaunchDarkly automatic instrumentation for product analytics events, you require:
-
A supported LaunchDarkly client-side SDK:
- JavaScript SDK, version 3.7.0 or later
- Android SDK, version 5.9.0 or later
- iOS SDK, version 9.14.0 or later
- Flutter SDK, version 4.17.0 or later
- React Native SDK, version 10.10.0 or later
-
The observability plugin for your client SDK:
- The JavaScript observability plugin supports all web product analytics events.
- The Android observability plugin supports all mobile product analytics events.
- The iOS observability plugin supports all mobile product analytics events.
- The Flutter observability plugin supports mobile product analytics events on Android and iOS.
- The React Native observability plugin supports taps, app launches, app lifecycle events, custom metric
trackevents, and theapp_reloadevent. It does not support screen views.
The session replay plugin is optional
Use the session replay plugin in addition to the observability plugin for your SDK, but it is not required to generate product analytics events. The session replay plugin is required if you want to create a heat map to display click data over a session background.
-
For metric event analytics, your code should use the
track()method to generate LaunchDarkly metric events. To learn more, read Tracking custom events.
By default, the observability plugin for JavaScript automatically generates span events for clicks, page views, and custom metrics. You can choose to disable collecting all or some product analytics events by configuring the plugin options. To learn more, read Configure product analytics event collection.
The Android, iOS, and Flutter observability plugins generate mobile product analytics events. Support and default behavior vary by SDK. To learn more, read Product analytics on mobile.
Product analytics event attributes
Each product analytics event generates an OpenTelemetry span whose name describes its type. The available span names are:
click: A click (web) or tap (mobile).page_view: A page view. Web only.track: A custom metric event generated by atrack()call.screen_view: A screen view. Mobile only.app_launch: An app launch. Mobile only.app_foregroundandapp_background: An app lifecycle change. Mobile only.app_reload: An app lifecycle change where a session continued across a JavaScript reload. React Native only.
Use the span name or other span attributes to filter product analytics events on the Traces page, or to create charts for observability dashboards.
All product analytics events include one or more context.contextKeys.<context_name> attributes that provide the context keys that generated the event. On web, all events include an http.url attribute that provides the full application URL that generated the event.
Some events include additional, event-specific attributes that describe characteristics of the event or user interaction:
- Click events can include multiple attributes prefixed with
event.that describe details of the click or tap location (event.xandevent.y) or the interacted element (event.tag,event.text,event.xpath). - Page view events include both the URL of the page viewed and the previously-visited URL in the
page.view.urlandpage.view.previous_urlattributes. - Track events include the metric event key in the
keyattribute, and any optional numeric value in thevalueattribute. - Screen view events include the screen name in the
event.nameattribute, and can include additionalevent.attributes such as the previous screen (event.previous_screen), screen class (event.screen_class), screen identifier (event.screen_id), and a category (event.category). - App launch events include the launch type in the
event.launch_typeattribute (install,update, orrelaunch), along with version information. They also include anapp.startspan event that carries the startup type in thestart.typeattribute (coldorwarm) and, when available, the startup duration in thestart.duration_msattribute. - App lifecycle events include the lifecycle state in the
event.lifecycle_stateattribute (foregroundorbackground). - App reload events include the elapsed time since the previous activity in the
event.elapsed_msattribute, and the number of times the session has reloaded in theevent.reload_countattribute.
Because product analytics events are implemented as OpenTelemetry spans, each event also includes common span attributes to indicate factors such as the span duration, whether the span includes errors, and so forth. To learn more, read Search attributes.
Product analytics on mobile
The Android, iOS, Flutter, and React Native observability plugins record product analytics events for mobile applications. In addition to taps and custom track() events, mobile applications record screen views, app launches, and app lifecycle changes. These events let you analyze how users navigate your app and how application startup and lifecycle behavior affects user activity.
The React Native observability plugin records taps, app launches, app lifecycle changes, custom metric track events, and an app_reload lifecycle event when a session continues across a JavaScript reload. It does not record screen views. To learn more, read Product analytics events in the React Native SDK observability reference.
Mobile applications can record the following product analytics events:
- Taps: A
clickspan for each user tap, with details about the tapped element and screen location. Recorded automatically. - Screen views: A
screen_viewspan when the app shows a screen, with the screen name and optional details such as the previous screen, screen class, screen identifier, and category. On Android and iOS, you can record screen views automatically, manually withtrackScreenView(), or both. - Track events: A
trackspan when your code calls thetrack()method to record a custom metric event. - App launches: An
app_launchspan once per process launch, with the launch type (install,update, orrelaunch) and version information. The span includes anapp.startspan event that records whether the launch was acoldorwarmstart and, when available, the startup duration. To learn more, read App launch events. - App lifecycle changes: An
app_foregroundorapp_backgroundspan as the app moves between the foreground and background states. On React Native, the plugin also records anapp_reloadspan when a session continues across a JavaScript reload. To learn more, read App reload events.
Support and default behavior vary by SDK. The following table summarizes which events each mobile observability plugin records:
LaunchDarkly enables all mobile product analytics events by default. To enable or disable individual event types, configure the analytics options for your SDK:
- Android: Configure product analytics event collection
- iOS: Configure product analytics event collection.
- Flutter: Configure product analytics event collection.
The React Native observability plugin records taps, app launches, app lifecycle changes, track events, and the app_reload event. To learn more, read Product analytics events in the React Native SDK observability reference.
Screen view events
Screen view events are the mobile equivalent of web page view events. Each screen view generates a screen_view span that records the screen name in the event.name attribute, along with optional attributes such as the previous screen, screen class, screen identifier, and category.
On Android and iOS, the observability plugin can detect screen changes automatically. You can also record screen views manually by calling trackScreenView(), which is useful for naming screens or recording additional details. To learn how, read the recording product analytics events section for your SDK:
App launch events
App launch events help you understand how your application starts up and how startup behavior affects user activity. The observability plugin records a single app_launch span once per process launch.
The app_launch span includes an event.launch_type attribute that classifies the launch:
install: The first launch after the app is installed.update: The first launch after the app is updated to a new version.relaunch: A subsequent launch of the same version.
The span also includes version information, such as the app version and, on an update, the previous version. The span carries an app.start span event that records the startup performance dimension:
start.type: Whether the launch was acoldstart or awarmstart. A cold start occurs when the app starts from scratch. A warm start occurs when the operating system prewarms the app before the user opens it.start.duration_ms: When available, the time from process start to when the SDK initialized, in milliseconds.
On both iOS and Android, the SDK captures process start timing as early as possible during launch, then emits the app_launch span after observability initializes, so the recorded duration reflects actual startup time rather than SDK initialization time. To learn more about how each SDK records app launches, read the observability reference for your SDK:
- Android: Configure product analytics event collection
- iOS: Configure product analytics event collection
- Flutter: Configure product analytics event collection
Using product analytics events
LaunchDarkly product analytics let you easily visualize common product usage events alongside system-level observability measurements, such as errors, logs, and other trace spans. The primary method for associating analytics with system performance is by charting product analytics events alongside other observability sources in dashboards.
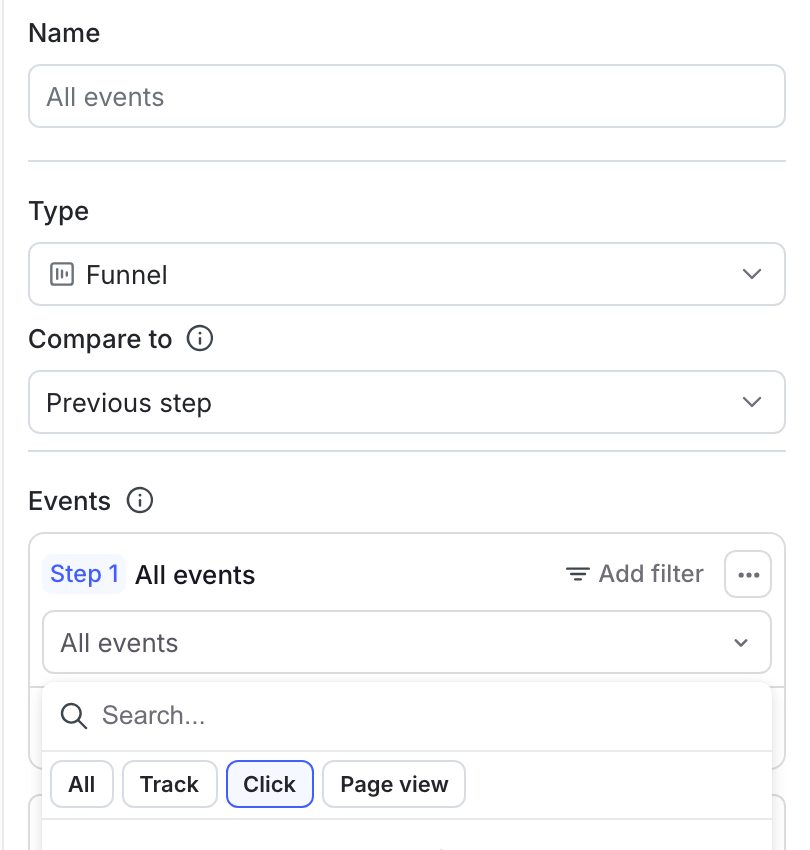
Observability funnel charts provide the ability to filter on different product analytics events during chart setup.
For other graph types, choose Events as the chart data source from the Source drop-down menu. Then, use the Events menu to filter for the events you want to visualize.
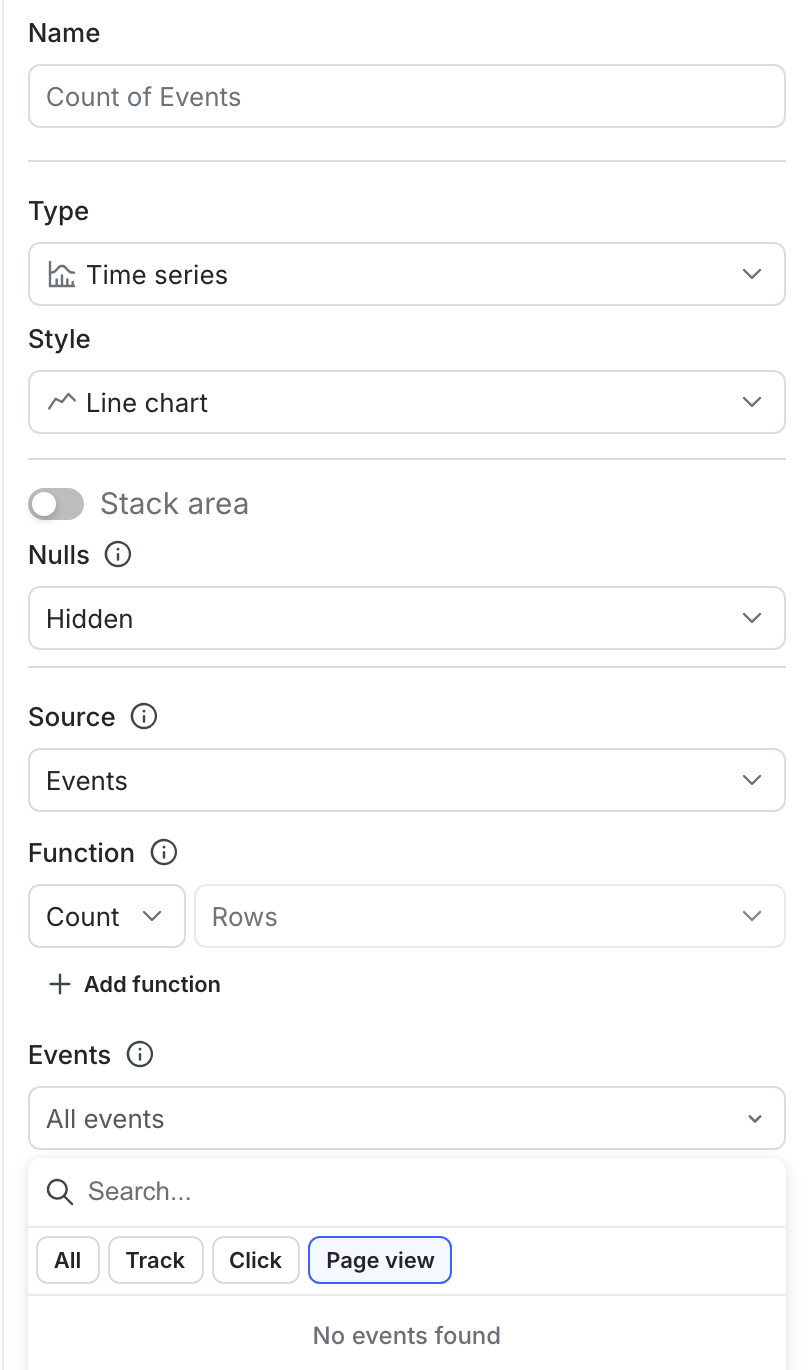
To learn more, read Custom dashboards.