Experiment metric types
This topic explains the different kinds of metrics you can use with experiments in LaunchDarkly.
Metrics measure audience and application events that change in response to feature flag variations. You can use metrics to understand how a flag variation affects customer actions, system performance, or business outcomes. You can connect metrics to experiments and guarded rollouts to help you evaluate impact, compare variations, or make release decisions based on collected data.
You don’t need to create a new metric for each new experiment. You can reuse existing metrics in multiple experiments, which lets you to compare how the metric performs with different flags. Similarly, a single experiment can use primary and secondary metrics, which lets you to observe how the variations perform against different measurements.
Metric sources
When running an experiment in LaunchDarkly, you can use LaunchDarkly hosted metrics or metrics from an external warehouse you specify.
You can also choose to use Data Export to export data from your experiments to a third-party analysis tool, which doesn’t require you to select any metrics when you create the experiment.
LaunchDarkly can automatically create metrics based on events that your application sends to LaunchDarkly. To learn more, read Autogenerated metrics.
LaunchDarkly hosted metrics
LaunchDarkly hosted metrics can measure a wide variety of events such as user interface interactions or page views, or changes in your application codebase like the time required to process a transaction. The LaunchDarkly SDKs generate these metric events, and LaunchDarkly aggregates and analyzes the events based on the metrics you create.
You can use LaunchDarkly hosted metrics to run A/B experiments and A/A tests.
To learn about the different kinds of LaunchDarkly hosted metrics available, read Creating and managing metrics.
Warehouse native metrics
Warehouse native metrics measure events stored in an external warehouse you specify, such as Snowflake. You can use these metrics to create experiments and analyze them against trusted data in your external warehouse to gain deeper insights and make data-informed product decisions.
Warehouse native metrics must be:
- one of:
- use the “average” analysis method
Experiments using warehouse native metrics cannot use:
- Clicked or tapped conversion metrics
- Page viewed conversion metrics
- Custom metrics with a percentile analysis method
- Any LaunchDarkly hosted metric
- Metric groups or metric funnel groups
Configure the Snowflake native Experimentation integration
Before you create a warehouse native metric, you must configure a the Snowflake native Experimentation integration. Configuring the integration allows you to select a metric data source when you create a warehouse native metric.
Metric groups
A metric group is a reusable set of metrics you can use to standardize metrics across multiple experiments. There are two kinds of metric groups you can use with experiments: funnel metric groups and standard metric groups.
Funnel metric groups
A “funnel” is a marketing model that describes a customer’s journey through your purchasing or conversion cycle, typically from the awareness stage to the purchasing stage. Funnel metric groups are useful when you want to measure the effectiveness of your marketing funnel.
When you create a funnel metric group, each metric should measure a required step in the user journey. If end users skip a step, the results may be incomplete or misleading and will skew your experiment results.
Metric types for funnel metric groups
To include a metric in a funnel metric group, the metric must be:
- LaunchDarkly hosted
- one of:
- Custom conversion binary
- Clicked or tapped conversion, using the “Occurrence” measurement method
- Page viewed conversion, using the “Occurrence” measurement method
To learn more, read Aggregation method and Analysis method.
Custom conversion binary and clicked or tapped conversion metrics are most often used in funnel metric groups.
LaunchDarkly experiment results focus on the final metric listed in the metric funnel group.
To learn more, read Choose a metric type.
Standard metric groups
Standard metric groups are an unordered set of metrics that you can reuse in multiple experiments. If you have a set of metrics that you want to monitor in all of your experiments, add them to a standard metric group to reuse them every time you create a new experiment.
To learn more, read Metric groups.
Primary and secondary metrics
You can designate only one metric as the primary metric in an A/B experiment, but you can attach secondary metrics to your experiments if you want to track the performance of additional measurements. You can connect up to 20 metrics to an experiment.
The primary metric is sometimes called the “overall evaluation criterion.” When you are making decisions about the winning variation in an experiment, you should base your decision-making only on your primary metric, because decision-making becomes much more complicated when you include multiple metrics in a decision.
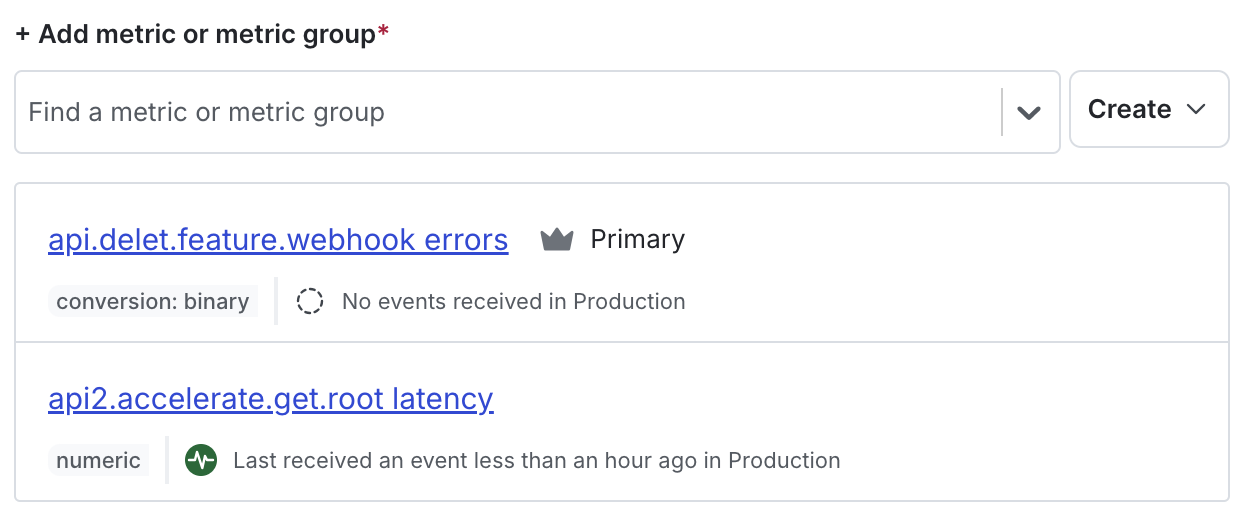
When you create an experiment, the primary metric is designated with a crown icon. After you add two or more metrics to an experiment, you can change the primary metric by clicking the crown icon of the new metric you want to designate as primary. To learn more, read Creating experiments.
Outcomes when using multiple metrics
If you are using just one metric, there are two possible outcomes: better or worse. If you are using two metrics, there are four possible outcome combinations: better/worse, worse/better, better/better, or worse/worse.
For each metric you add to an experiment, the possible outcomes increase quickly. If you are using three metrics, there are eight different possible outcome combinations. If you are using ten metrics, there are 1,024 possible outcome combinations. For this reason we recommend basing your decision-making on only your primary metric.
To learn how to create a new metric, read Metrics.