Funnel charts
Overview
This topic explains how to create a funnel chart in product analytics.
A funnel chart shows how users progress through a series of events. These events refine common user behaviors into more specific outcomes, visualized by a funnel shape. Each funnel chart can have up to nine steps.
Funnels calculate the number and percentage of users converting from one event to another within a certain conversion window. This gives you the ability to analyze where your users drop off, what groups convert the most, and other important aspects of the user journey.
Using funnels
Here are some example questions that a funnel chart can help you answer:
- What percent of users converted through my signup funnel within an hour?
- At what step of the signup funnel did most users drop off?
- Which countries and devices have a higher or lower signup conversion rate than others?
- How did the latest feature release impact conversions in the signup funnel?
- Has my conversion rate for a particular funnel gone up or down over a period of time?
- What is the average time it takes for users to convert between different steps of the funnel?
Understanding conversions
This section explains how funnels calculate conversion. For a funnel analysis, a user must complete the steps you designate in your funnel in loose order. “Loose order” here means that a user can take other actions between steps in the funnel, as long as they complete the steps in the funnel in order.
Only users who have gone through each of the previous steps in the funnel appear in any following step.
Let’s examine more specific examples.
For example: Your funnel has steps A, B, C, D, and E.
- A user does steps A, B, C, D, and E in exact order. Product analytics counts this as a conversion.
- A user does steps A and B, completes other actions in your product that do not count toward the funnel, then completes steps C, D, and E. Product analytics counts this as a conversion. This is an example of loose ordering.
- A user does steps A, B, D, C, D, and E. Observe that they performed step D twice. Product analytics counts this as conversion. Even though the user did step D before the first time they did step C, their actions convert because they ultimately did step D after step C within the conversion window.
- A user does steps A, B, C, and E. Product analytics does not count this as a conversion for step E, but will measure conversions for steps B and C. The user will not appear in the funnel after step C. The user’s completion of step E is excluded from the funnel, because they did not perform step D.
Create a funnel chart
To create a dashboard with a funnel chart:
- Click New dashboard. The “Untitled dashboard” page opens. Click the dashboard title to give it a unique name.
- Click Add content and choose the “Funnels” type from the dropdown that appears. The “Events” configuration menu appears.
- Click in the “Events” search bar and choose an event to track. Optionally, choose more events to track. To learn more, read Event ordering and filters.
- Optionally, update the “Conversion criteria.” To learn more about these options, read Conversion criteria.
- In the “Counting” section, click to specify if you want to count Uniques or Total events.
- In the “Breakdown” section, click the plus icon to expand menu options. Choose an event property to use for the breakdown.
- In the “Filters” section, click the plus icon to expand menu options. Choose a filter to apply to the data.
- (Optional) In the event table below the chart, check or uncheck the checkbox next to different event types to show or hide those events on the funnel chart.
- Click Save. The new dashboard content appears.
Advanced concepts
This section explains some advanced concepts for funnels.
Event ordering and filters
You can filter each step by properties associated with the event. Click the filter icon next to each event to open the filter window. Use the first-time filter to study early user behavior. Apply it to specific events to filter your analysis to see the first instance of users completing the step across their lifetime in your app.
Conversion criteria
There are optional configuration steps for funnels that can help refine your data. They are:
- Counting criteria: Counting criteria determine how many times product analytics counts a particular user’s activity as a conversion. Funnels are calculated by uniques and totals. “Uniques” is the default option.
- Uniques: This option counts the number of users who complete the funnel. If one user completes the funnel multiple times in the date range you set, the user only counts as a conversion one time. That time is logged as the first time they perform the first step of the funnel.
- Totals: This option accounts for every time users converted through the funnel, including multiple entries per user. A re-entry into the funnel begins every time a user performs the first step of the funnel, and each time this happens, the previous funnel entry is assumed to be completed.
- Conversion window: The conversion window determines how much time a user has to perform all steps of the funnel. The conversion window is set to one hour by default.
Funnel chart views
Product analytics displays funnel charts in four ways:
Funnel steps view
This view appears as a bar chart. The leftmost bar represents the first step of the funnel, and the rightmost bar represents the last step of the funnel.
The height of each bar represents the number of users who completed the funnel. It is typical for the bars to decrease in height as you move from left to right. This represents users dropping out of the funnel.
The chart displays the number and percentage of users who completed the funnel above and in the hover state for each bar.
Table view
Table view shows the data powering each chart visualization in a table format. You can sort the table by any column.
Funnel trends view
Use the funnel trends view to visualize the conversion trend over a period of time. It shows the percentage converted between all the steps a user takes in the funnel. It displays with a daily, weekly, monthly, or yearly granularity.
This view is helpful if you want to discover whether your conversion for the funnel is increasing, decreasing, or not changing.
Time to convert
The time to convert view helps you analyze how much time users take to complete the funnel.
Product analytics displays the time to convert through the entire funnel by default. The chart updates if you select a specific step in the funnel to indicate the conversion rate up to that step, rather than the full funnel.
By default, the interval for this chart is two minutes. You can adjust this with the dropdown above the chart.
Show and hide different event types
You can show or hide different event types from the funnel chart using the chart’s data table.
To show or hide different event types on an existing chart:
- From the dashboard, click on the name of a funnel chart. The chart editor opens.
- Click the full-page icon:
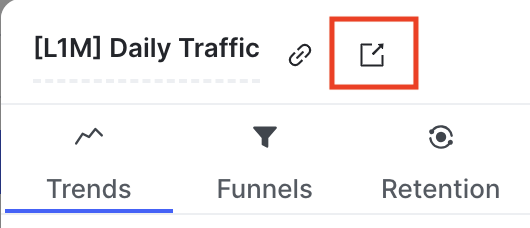
- In the event table below the chart, check or uncheck the checkbox next to different event types to show or hide those events on the funnel chart.
- Click Save.