Dashboards
Overview
This topic explains how to use the product analytics Dashboards tab, and what information that tab contains. The Dashboards tab shows you analytics and information for different types of activity. You can also use this tab to create new dashboards.
The Dashboards tab is where you can start performing deep analysis of your product data. You can create dashboards to track user behavior and other information, and you can see the dashboards created by other people in your organization.
The Dashboards tab
Click any existing dashboard to open it. You can also search by typing in the box to find a specific dashboard.
The Dashboards tab is displayed with multiple columns. They are:
- Dashboard name: The name of a specific dashboard.
- Last modified: Shows how recently the contents of this cohort changed.
- Created by: Shows who from your LaunchDarkly account created this dashboard.
Click the three-dot overflow menu to delete a dashboard.
Create a dashboard from charts
Create new dashboards from the Dashboard tab. Dashboards are comprised of charts. There are different types of charts:
- Trends: Let you track the number of times different events are triggered over time so you can identify usage patterns and detect anomalies.
- Funnels: Let you track how users progress through a series of events so you can identify conversion and drop-off rates.
- Retention: Let you track how users stay or do not stay engaged with your product over time so you can measure ongoing engagement.
- Stickiness: Let you track how often users perform an event in a specific interval so you can understand how specific features are used.
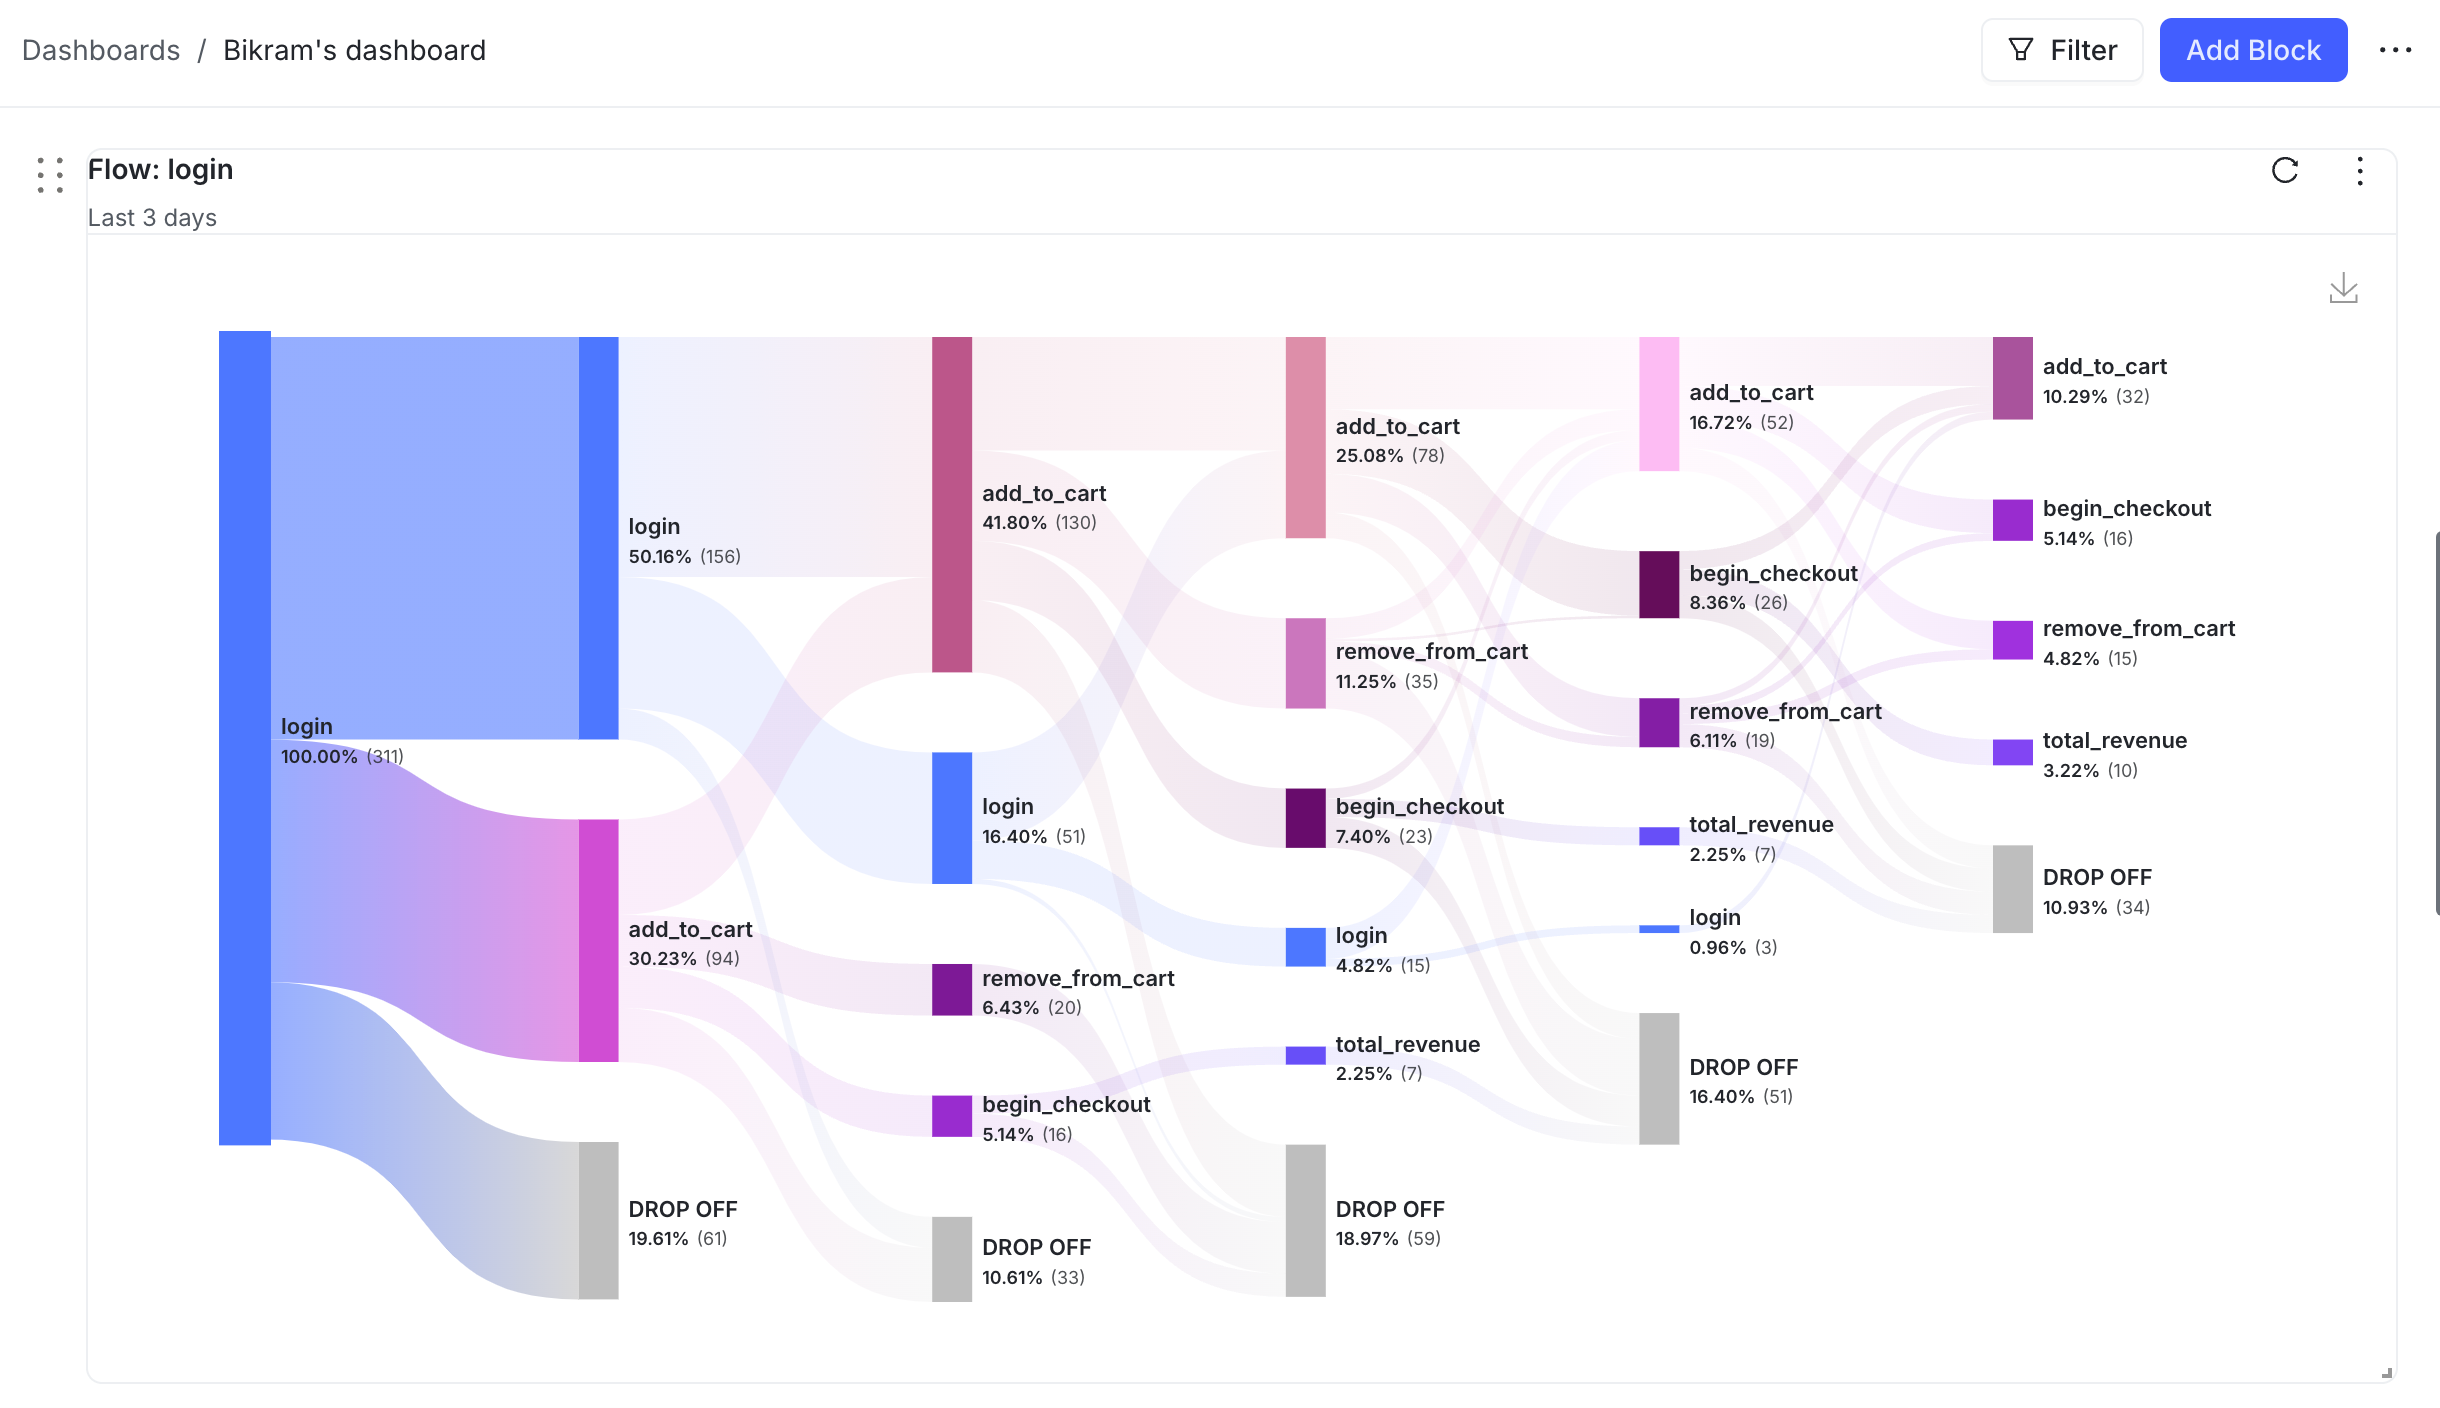
- Flows: Let you track the most common sequences of events your users perform so you can understand the different paths they take through your product.
You can also customize your dashboard’s UI by adding embedded content or data from another dashboard.